

Second primary malignancies among cancer patients
- PMID: 32566575
- PMCID: PMC7290649
- DOI: 10.21037/atm-20-2059
Second primary malignancies among cancer patients
Abstract
Background: Rate of second primary malignancies (SPM) is steadily increasing over the last decades. New therapies, early diagnostic markers, screening tests for a larger number of individuals contribute to the increase prevalence of SPM. In the current study, we try to described the demographic composition of SPM victims, distribution of primary sites, and the impact of related factors on prognosis.
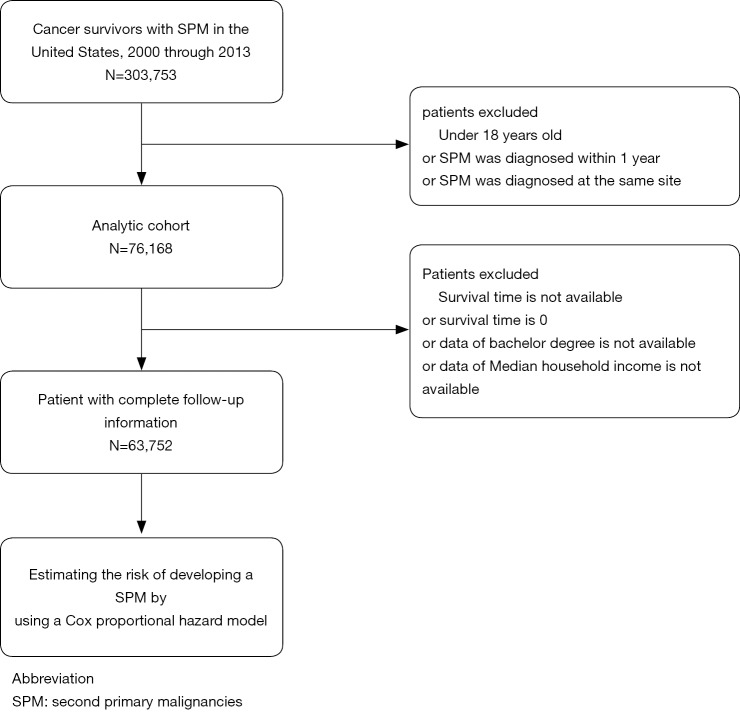
Methods: We conducted a retrospective study identifying patients over the age of 18 who were diagnosed with SPM from the 16 most common cancer sites between 2000 and 2013 from Surveillance, Epidemiology, and End Results data. Cox proportional hazards regression was used to analyze the relationship between different factors associated to the prognosis of SPM. Standard incidence rate of multiple primary (MP-SIR) was also calculated.
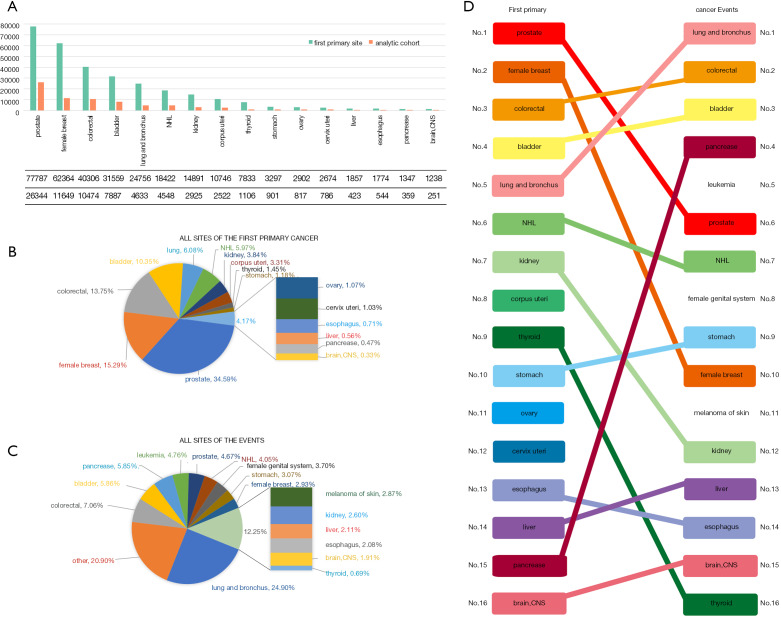
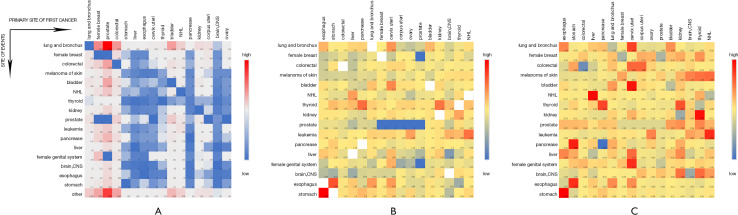
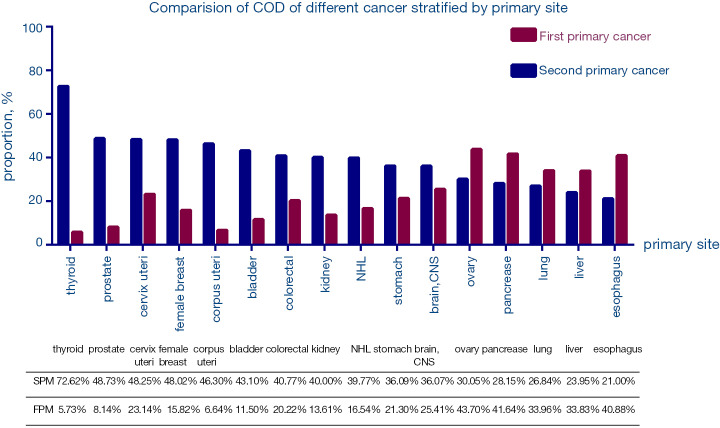
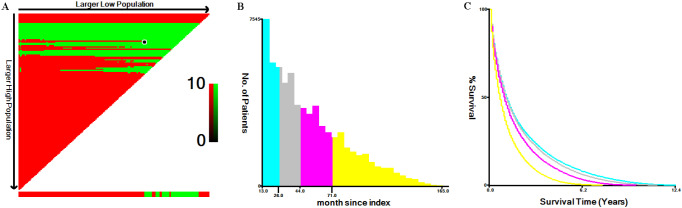
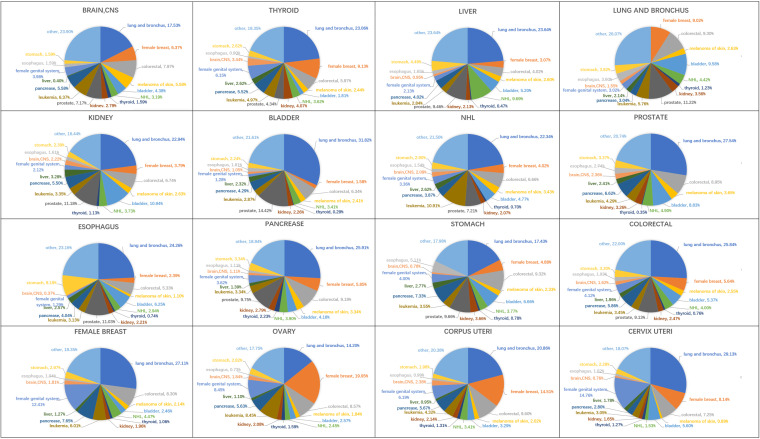
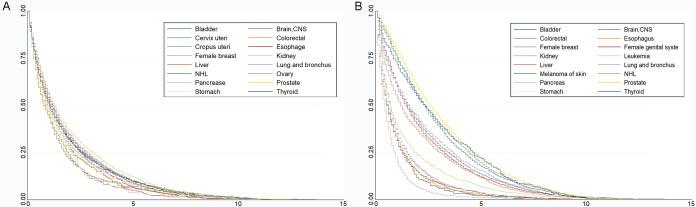
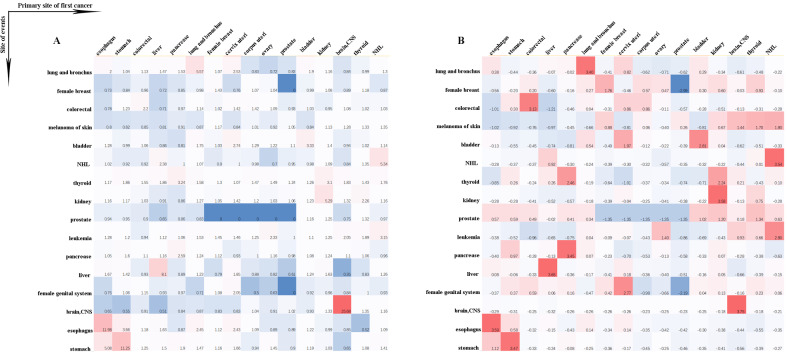
Results: A total of 303,753 patients were diagnosis with SPM and 76,168 of whom (25.08%) were included in our analytic cohort. Patients with prostate cancer was vulnerable to SPM, accounting for 34.59%, and SPM was prone to occur in lung and bronchus, accounting for 24.90%. The heat map shows that esophagus cancer survivors have the highest risk of developing stomachache tumors (SIR =5.08). The result of Cox regression suggests that a history of liver was associated with the shortest survival time (HR =1.64, 95% CI, 1.54-1.75, P<0.001).
Conclusions: With the advancement of medical standards, the survival time of cancer patients is prolonged, but the occurrence of SPM is also increasing, and the prognosis is not optimistic. More attention needs to be invested in the prevention and treatment of SPM.
Keywords: SEER; Second primary malignancy (SPM); epidemiological investigation; median survival time; standard incidence rate (SIR).
2020 Annals of Translational Medicine. All rights reserved.
Conflict of interest statement
Conflicts of Interest: All authors have completed the ICMJE uniform disclosure form (available at http://dx.doi.org/10.21037/atm-20-2059). XL serves as an unpaid section editor of Annals of Translational Medicine from Jan 2020 to Dec 2021. The other authors have no conflicts of interest to declare.
Figures
References
-
- US Mortality Files, National Center for Health Statistics, Centers for Disease Control and Prevention 2016.
-
- Howlader N, Noone AM, Krapcho M, et al. editors. SEER Cancer Statistics Review, 1975-2016, National Cancer Institute. Bethesda, MD, https://seer.cancer.gov/csr/1975_2016/, based on November 2018 SEER data submission, posted to the SEER web site, April 2019.
-
- American Cancer Society. Cancer Treatment & Survivorship Facts & Figures: 2014–2015. Atlanta, GA: American Cancer Society; 2014.
LinkOut - more resources
Full Text Sources