. 2020 May;8(9):579.
doi: 10.21037/atm.2020.04.58.

Comparative proteomics analysis of plasma protein in patients with neuropsychiatric systemic lupus erythematosus

Affiliations

Comparative proteomics analysis of plasma protein in patients with neuropsychiatric systemic lupus erythematosus

Chen Chen et al. Ann Transl Med. 2020 May.

Abstract

Background: The aim of this study was to evaluate serum biomarkers of systemic lupus erythematous (SLE) patients, with and without neuropsychiatric (NP) manifestation by high-resolution proteomic analysis.

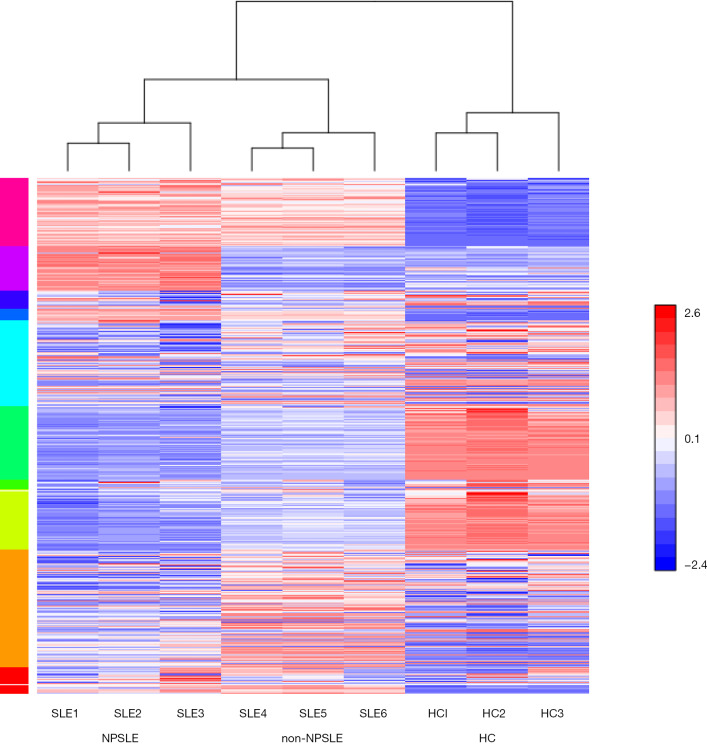
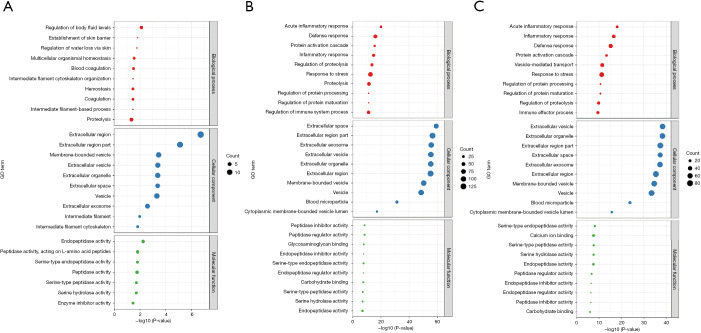
Methods: SLE patients with NP (NPSLE, n=9), SLE patients without NP (non-NPSLE, n=9) and healthy controls (HC, n=9) were prospectively enrolled in this study, and their plasma samples were collected and pooled into 3 NPSLE, 3 non-NPSLE and 3 HC samples for discovery profile. The TMT-LC-MS/MS-based proteomics approach was used to identify the differential proteome among the three matched groups, and the data were analyzed by bioinformatics tools, including Gene Ontology (GO) categories, Kyoto Encyclopedia of Genes and Genomes enrichment analysis, to explore canonical pathways and networks involved in the pathogenesis of NPSLE. To validation of differentially expressed proteomics results, four proteins were measured by ELISA.

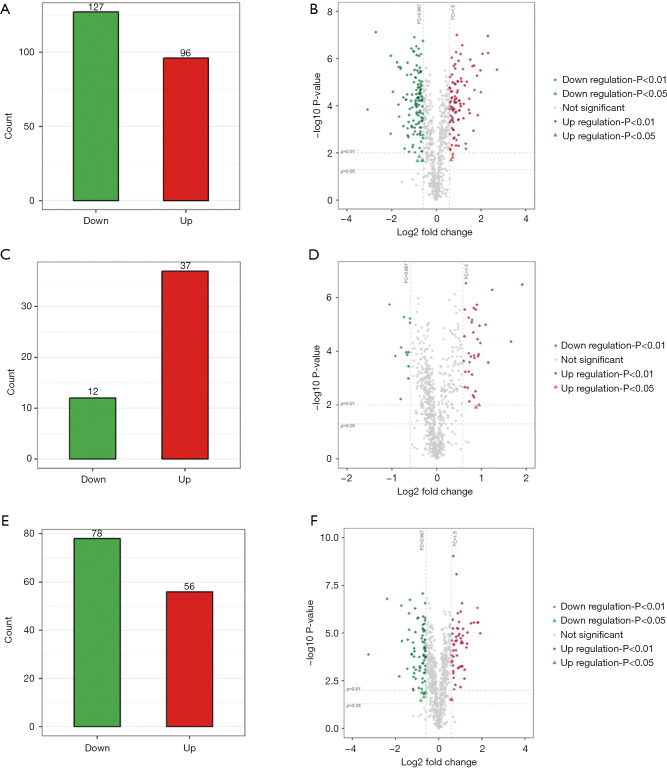
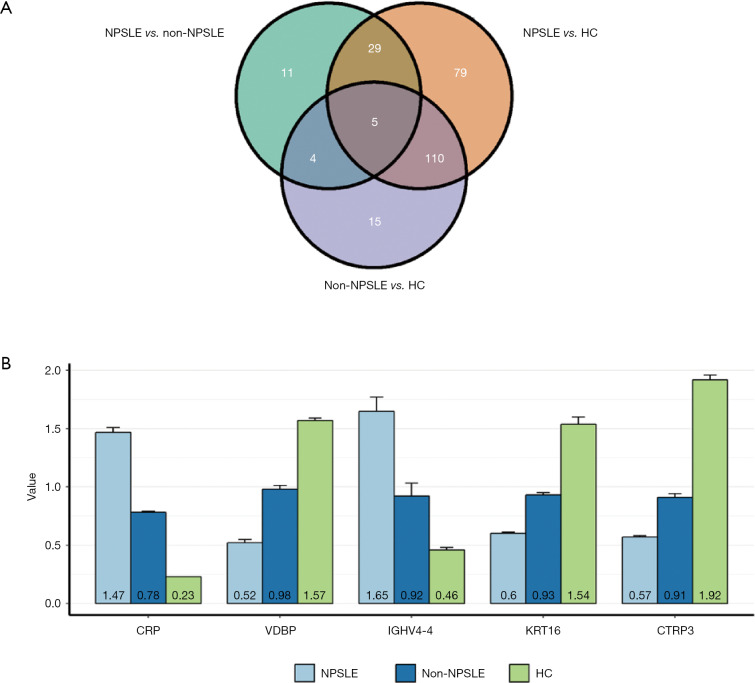
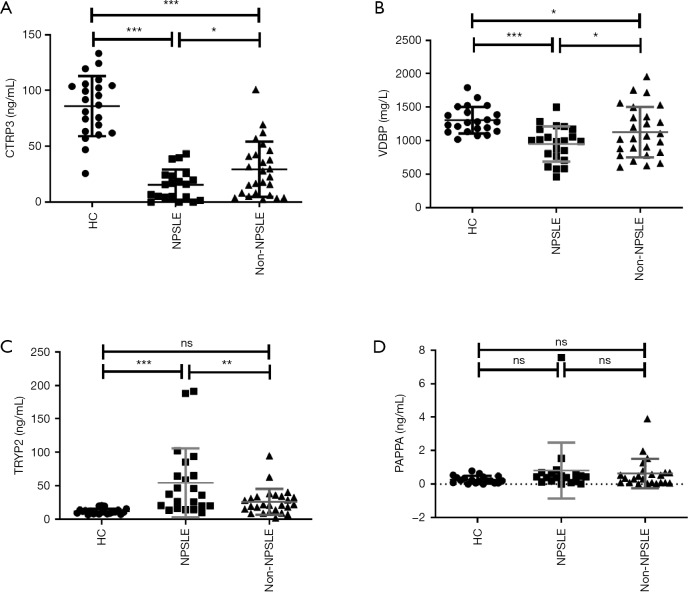
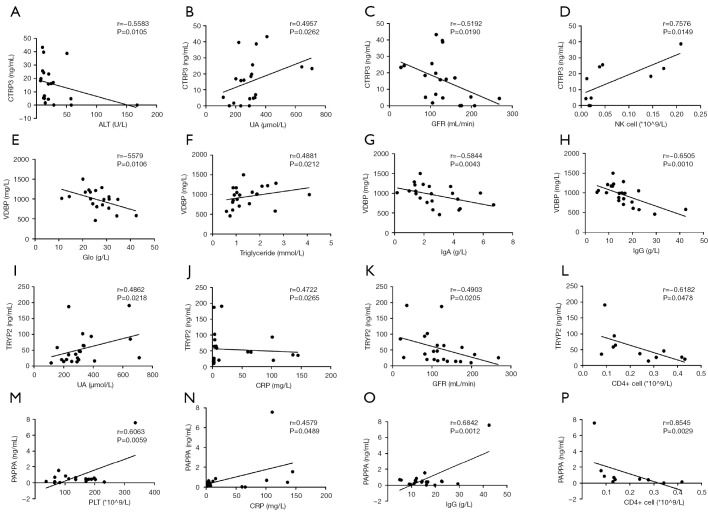
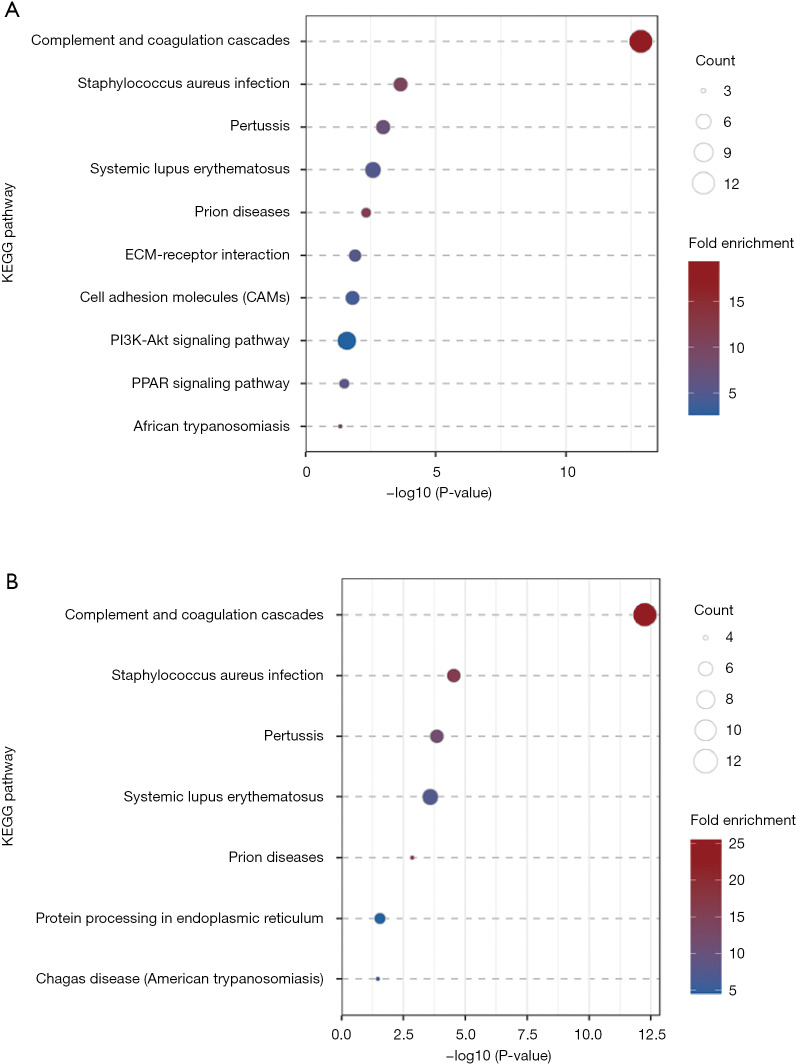
Results: There were altogether 223 differentially expressed proteins in NPSLE groups compared with healthy controls (HC), of which 96 proteins increased while 127 proteins decreased. Compared with non-NPSLE, there were only 49 differentially expressed proteins in NPSLE groups, of which 37 proteins increased while 12 proteins decreased. The significantly changed pathway that those proteins are involved in was complement and coagulation cascades in NPSLE group compared with health controls. However, we didn't find significantly changed pathway between NPSLE group and non-NPSLE group. Five proteins were found significantly changed in all group-comparisons with consistent tendencies using Venn analysis, including Vitamin D binding protein (VDBP), C-reactive protein (CRP), KRT16, IGHV4-4 and CTRP3. Four proteins including CTRP3, VDBP, PAPPA and TRYP2 were selected to estimate the validity of the proteomics approach by ELISA. The expression levels of CTRP3 and TRYP2 were significantly changed in NPSLE patients compared with either HC or non-NPSLE patients.

Conclusions: Our research has successfully established serum protein profiles of NPSLE and non-NPSLE patients through TMT technology and screened out five proteins significantly changed in group-comparisons with consistent tendencies. The pathway of complement and coagulation cascades may participate in pathogenesis of NPSLE and non-NPSLE.

Keywords: Neuropsychiatric systemic lupus erythematosus (NPSLE); gene ontology (GO) terms; kyoto encyclopedia of genes and genomes; proteomics analysis.


Conflict of interest statement

Conflicts of Interest: All authors have completed the ICMJE uniform disclosure form (available at http://dx.doi.org/10.21037/atm.2020.04.58). The authors have no conflicts of interest to declare.

Figures

Figure 1
Figure 1
Heat map showing hierarchical clustering of proteins with expression changes greater than two-fold and P value <0.01. NPSLE: SLE1–3; non-NPSLE: SLE3–6; Healthy control group: HC1–3. Red and blue colors represent up- and downregulated proteins, respectively. NPSLE, neuropsychiatric systemic lupus erythematosus; SLE, systemic lupus erythematosus; HC, healthy control.
Figure 2
Figure 2
The differentially expressed proteins in NPSLE, non-NPSLE patients and HCs. (A,C,E) Histogram showed the differentially expressed proteins between NPSLE/HC, NPSLE/non-NPSLE and non-NPSLE/HC samples; (B,D,F) volcano plot of differentially expressed proteins. The horizontal dotted lines represent a P value of 0.01 and 0.05, and vertical dotted lines represent 2.0-fold changes up and down. X axes are the fold change values (log2 scaled), and Y axes are the P values (log10 scaled). Red and blue plots represent up- and downregulated genes, respectively. NPSLE, neuropsychiatric systemic lupus erythematosus; HC, healthy control.
Figure 3
Figure 3
The differentially expressed proteins in all three groups. (A) The differentially expressed proteins were showed by Venn diagram; (B) The specific five differentially expressed proteins significantly changed in all three groups. NPSLE, neuropsychiatric systemic lupus erythematosus; HC, healthy control.
Figure 4
Figure 4
The differentially expressed proteins levels in plasma in of NPSLE patients, non-NPSLE patients and HCs are identified using ELISA. (A) The CTRP3 levels were significantly decreased in NPSLE patients and non-NPSLE patients. n (NPSLE) =20, n (non-NPSLE) =26, n (HC) =22; (B) the VDBP levels were significantly decreased in NPSLE patients and non-NPSLE patients. n (NPSLE) =22, n (non-NPSLE) =26, n (HC) =22; (C) the TRYP2 levels were significantly decreased in NPSLE patients instead of non-NPSLE patients. n (NPSLE) =22, n (non-NPSLE) =26, n (HC) =22; (D) there was a trend that PAPPA levels were increased in NPSLE patients. n (NPSLE) =19, n (non-NPSLE) =23, n (HC) =19. *, P<0.05; **, P<0.01; ***, P<0.001. ns, P>0.05.
Figure 5
Figure 5
Correlation between differentially expressed proteins and clinical characteristics in NPSLE patients. (A,B,C,D) The expression levels of CTRP3 were associated with aminotransferase (ALT), uric acid (UA), glomerular filtration rate (GFR) and NK cells numbers; (E,F,G,H) the expression levels of VDBP were associated with globin (Glo), triglyceride, serum IgA and IgG levels; (I,J,K,L) the expression levels of TRYP2 were associated with UA, CRP, GFR and CD4+ cells numbers; (M,N,O,P) the expression levels of PAPPA were associated with platelets (PLT), CRP, serum IgG levels and CD4+ cells numbers.
Figure 6
Figure 6
Subcellular location annotation of totally proteins. Most proteins were concentrated in the following categories: cytoplasm, membrane, endoplasmic reticulum.
Figure 7
Figure 7
Enrichment analysis of GO terms for differentially expressed proteins between NPSLE, non-NPSLE and healthy controls. (A) The top 10 GO analysis which consisted of significant molecular function, cellular component and biological process of differentially expressed proteins between NPSLE and non-NPSLE; (B) the top 10 GO analysis between NPSLE and healthy controls; (C) the top 10 GO analysis between non-NPSLE and healthy controls.
Figure 8
Figure 8
KEGG pathway enrichment analysis of NPSLE, non-NPSLE and healthy controls. (A) The bubble chart showed the top 10 pathways enriched in NPSLE and healthy controls. (B) The bubble chart showed the top 10 pathways enriched in non-NPSLE and healthy controls.
Figure S1
Figure S1
The annotative MS spectra for the unique peptides of 5 identified proteins. (A) VDBP; (B) CRP; (C) KRT16; (D) IGHV4-4; (E) CTRP3.

References

    1. Tipton CM, Fucile CF, Darce J, et al. Diversity, cellular origin and autoreactivity of antibody-secreting cell population expansions in acute systemic lupus erythematosus. Nat Immunol 2015;16:755-65. 10.1038/ni.3175 - DOI - PMC - PubMed
    1. Jeltsch-David H, Muller S. Neuropsychiatric systemic lupus erythematosus: pathogenesis and biomarkers. Nat Rev Neurol 2014;10:579-96. 10.1038/nrneurol.2014.148 - DOI - PubMed
    1. Wen J, Stock AD, Chalmers SA, et al. The role of B cells and autoantibodies in neuropsychiatric lupus. Autoimmun Rev 2016;15:890-5. 10.1016/j.autrev.2016.07.009 - DOI - PMC - PubMed
    1. Hanly JG, Urowitz MB, Su L, et al. Prospective analysis of neuropsychiatric events in an international disease inception cohort of patients with systemic lupus erythematosus. Ann Rheum Dis 2010;69:529-35. 10.1136/ard.2008.106351 - DOI - PMC - PubMed
    1. Hanly JG, Kozora E, Beyea SD, et al. Review: Nervous System Disease in Systemic Lupus Erythematosus: Current Status and Future Directions. Arthritis Rheumatol 2019;71:33-42. 10.1002/art.40591 - DOI - PubMed