

Identification and characterization of diverse OTU deubiquitinases in bacteria
- PMID: 32567101
- PMCID: PMC7396840
- DOI: 10.15252/embj.2020105127
Identification and characterization of diverse OTU deubiquitinases in bacteria
Abstract
Manipulation of host ubiquitin signaling is becoming an increasingly apparent evolutionary strategy among bacterial and viral pathogens. By removing host ubiquitin signals, for example, invading pathogens can inactivate immune response pathways and evade detection. The ovarian tumor (OTU) family of deubiquitinases regulates diverse ubiquitin signals in humans. Viral pathogens have also extensively co-opted the OTU fold to subvert host signaling, but the extent to which bacteria utilize the OTU fold was unknown. We have predicted and validated a set of OTU deubiquitinases encoded by several classes of pathogenic bacteria. Biochemical assays highlight the ubiquitin and polyubiquitin linkage specificities of these bacterial deubiquitinases. By determining the ubiquitin-bound structures of two examples, we demonstrate the novel strategies that have evolved to both thread an OTU fold and recognize a ubiquitin substrate. With these new examples, we perform the first cross-kingdom structural analysis of the OTU fold that highlights commonalities among distantly related OTU deubiquitinases.
Keywords: bacterial effector; deubiquitinase; pathogen; protein structure; ubiquitin.
© 2020 The Authors. Published under the terms of the CC BY 4.0 license.
Conflict of interest statement
The authors declare that they have no conflict of interest.
Figures
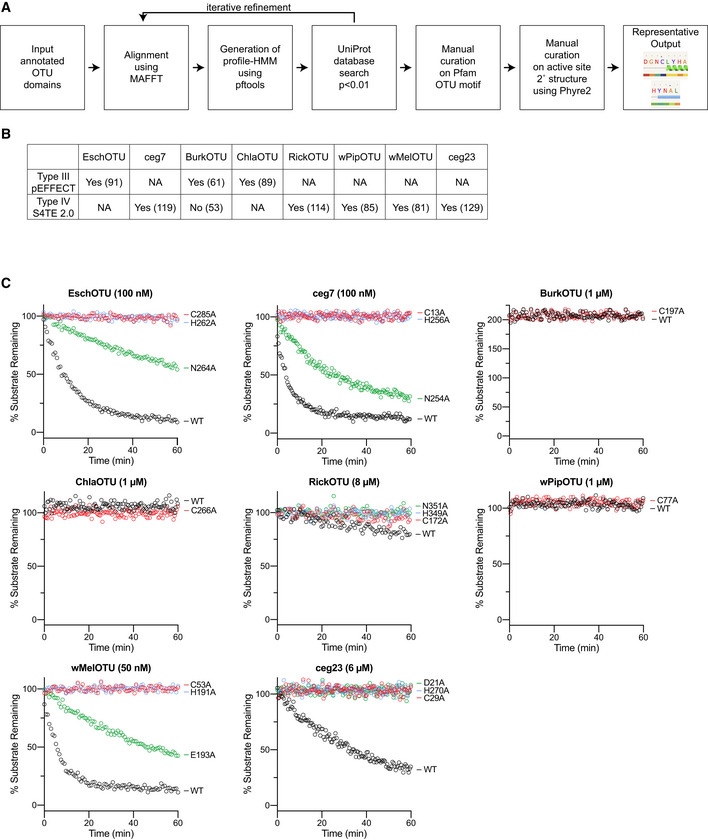
- A
Workflow illustrating the process used for bioinformatic prediction of bacterial OTU domains, followed by their manual curation. Representative output from the Phyre2 curation is shown for the predicted EschOTU active site.
- B
Table presenting prediction scores for type III and type IV secretion signals using the pEFFECT (Goldberg et al, 2016) and S4TE 2.0 (Noroy et al, 2019) prediction approaches, respectively. For pEFFECT predictions, prediction reliability scores above 50 or above 80 are associated with 87% or 96% accuracy, respectively. For S4TE 2.0, a prediction score above 72 is associated with a 98% sensitivity. Organisms that lack one of the secretion systems are marked as not applicable (NA).
- C
Full fluorescent Ub substrate cleavage data for all bacterial OTUs following Ala substitution at each member of the predicted catalytic triad. These data were collected in parallel with those presented in Fig 1G, and the WT dataset is shown again for clarity. The rise above 100% observed with BurkOTU is indicative of a noncovalent interaction.
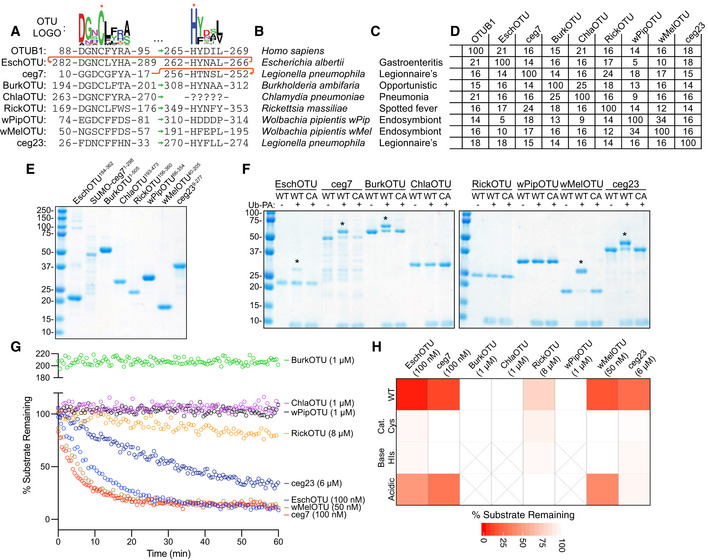
- A
Pfam‐generated sequence logo of the regions surrounding the OTU catalytic Cys and general base His (marked with asterisks). The conservation of these regions in the human OTUB1 and predicted bacterial OTUs are shown below, together with their relative order in the sequence topology indicated by the sequence position as well as green and red arrows for the typical and atypical arrangements, respectively.
- B
Bacterial species to which the predicted OTUs belong.
- C
Outcome of interactions between the highlighted bacterial species and their respective eukaryotic hosts.
- D
Percent identity matrix calculated from a PSI‐Coffee alignment (Notredame et al, 2000) of the predicted OTU domains. OTUB1 (80–271), EschOTU (184–362), ceg7 (1–298), BurkOTU (186–315), ChlaOTU (193–473), RickOTU (161–356), wPipOTU (66–354), wMelOTU (40–205), and ceg23 (9–277) were used to create the alignment.
- E
Coomassie‐stained SDS–PAGE gel showing purified protein from the predicted bacterial OTU constructs.
- F
Ub‐PA activity‐based probe assay for wild‐type (WT) and catalytic Cys‐to‐Ala mutants (CA). Strong, Cys‐dependent reactivity is indicated with asterisks.
- G
Ub‐KG(TAMRA) cleavage assay monitored by fluorescence polarization at the indicated DUB concentrations. Note that BurkOTU displays an increase in fluorescence polarization, indicative of noncovalent binding.
- H
Heatmap representation of DUB activity against the Ub‐KG(TAMRA) substrate shown in (G), including the WT enzyme and Ala substitutions at the predicted catalytic Cys, general base His, or acidic position. Substrate remaining at the end of the assay is reported after correction against an initial reading from an equivalent assay performed with the catalytically inactive CA mutants.
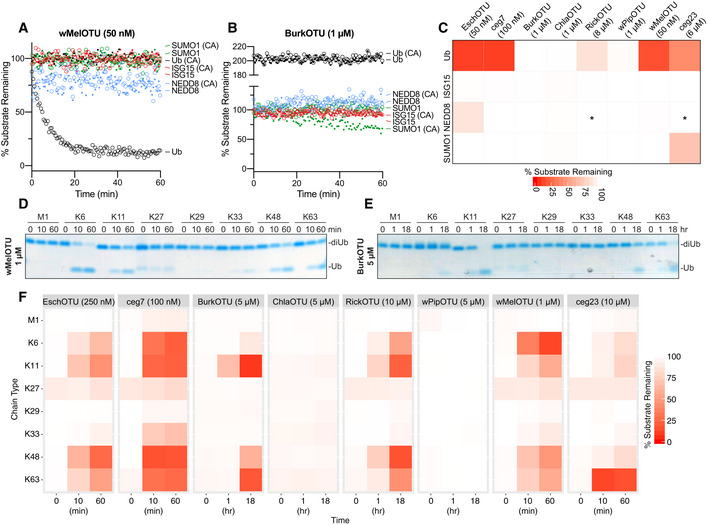
- A
Ub/Ub‐like specificity assay measuring activity of WT and inactive Cys‐to‐Ala wMelOTU toward the Ub‐, ISG15‐, NEDD8‐, and SUMO1‐KG(TAMRA) substrates.
- B
Ub/Ub‐like specificity assay measuring activity of WT and inactive Cys‐to‐Ala BurkOTU toward the Ub‐, ISG15‐, NEDD8‐, and SUMO1‐KG(TAMRA) substrates. Note that the rise in fluorescence polarization signal, indicative of a noncovalent interaction, is specific to the Ub substrate.
- C
Heatmap representation of corrected OTU activities toward the Ub and Ub‐like fluorescent substrates. In the reactions marked by an asterisk, an unusually high level of noise in fluorescence polarization signal was observed, likely a result of high OTU concentration.
- D
Ub chain specificity assay measuring wMelOTU activity toward the eight diUb linkages. Reaction samples were quenched at the indicated timepoints, resolved by SDS–PAGE, and visualized by Coomassie staining.
- E
Ub chain specificity assay measuring BurkOTU activity toward the eight diUb linkages. Reaction samples were quenched at the indicated timepoints, resolved by SDS–PAGE, and visualized by Coomassie staining.
- F
Heatmap representation of WT bacterial OTU activities toward the eight diUb linkages at the indicated timepoints.
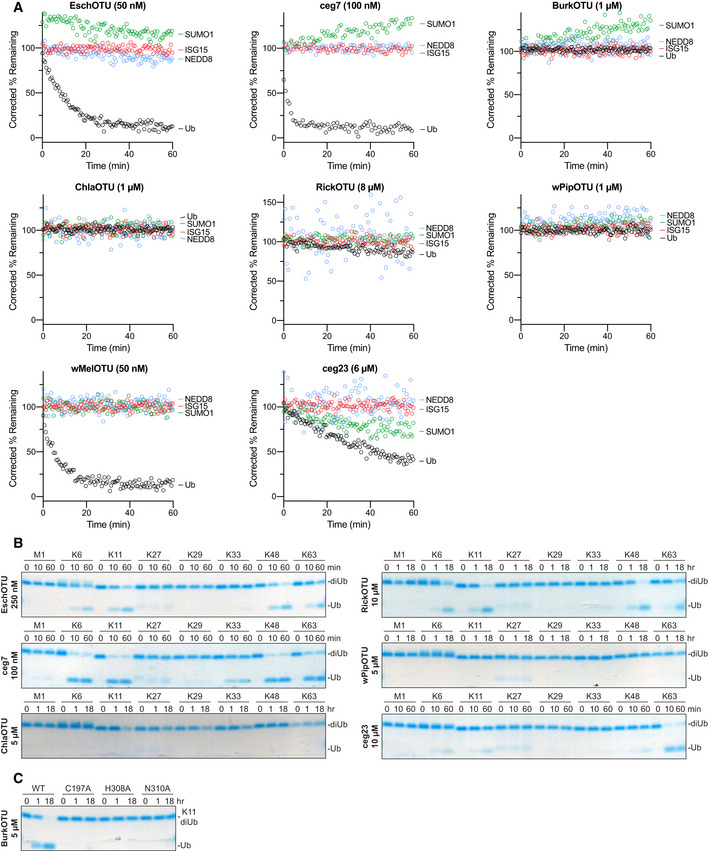
- A
Corrected Ub/Ub‐like substrate specificity assays for all bacterial OTUs.
- B
Ub chain specificity assays for EschOTU, ceg7, ChlaOTU, RickOTU, wPipOTU, and ceg23 toward the eight diUb linkages. Reaction samples were quenched at the indicated timepoints, resolved by SDS–PAGE, and visualized by Coomassie staining.
- C
K11 diUb cleavage assay for BurkOTU WT and Ala‐substituted catalytic triad mutants. Reaction samples were quenched at the indicated timepoints, resolved by SDS–PAGE, and visualized by Coomassie staining.
- A
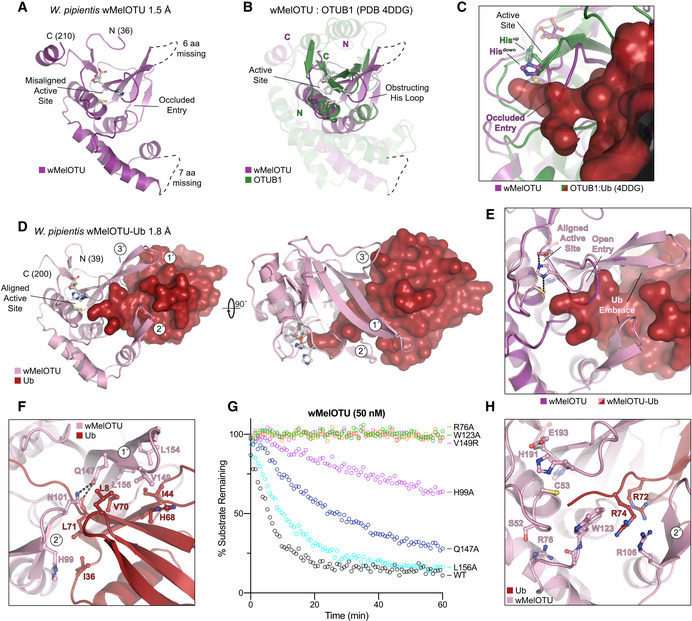
Cartoon representation of the 1.5 Å Wolbachia pipientis wMelOTU crystal structure with labeled termini, missing regions, and features of the active site.
- B
Structural alignment of the core OTU folds (central β‐sheet and two supporting α‐helices) from human OTUB1 (green, PDB 4DDG) and wMelOTU (purple). Surrounding regions are less well conserved and shown as semi‐transparent.
- C
Enlarged region of the OTUB1:Ub structure (PDB 4DDG) showing entry of the Ub C‐terminus (red) into the OTUB1 active site (green). The wMelOTU structure (purple) is overlaid to highlight the structural conflict between the downward position of the His‐loop and the Ub C‐terminus.
- D
1.8 Å crystal structure of the covalent wMelOTU‐Ub complex. wMelOTU (cartoon, pink) is linked to the Ub (surface, red) C‐terminus through its active site. Primary, secondary, and tertiary regions of the Ub‐binding S1 site are indicated.
- E
Structural overlay of the apo (violet) and Ub‐bound (pink) wMelOTU structures highlighting the repositioning of the His‐loop to accommodate entry of the Ub C‐terminus, as well as ordering of two regions in the S1 site that form an embrace around Ub.
- F
Detailed view of the primary and secondary interfaces between wMelOTU (pink) and Ub (red) observed in the wMelOTU‐Ub structure. wMelOTU and Ub residues participating in the interface are shown with ball and stick representation.
- G
Ub‐KG(TAMRA) cleavage assay monitoring the effects of structure‐guided wMelOTU mutations. These data were collected in parallel with those presented in Fig 1G, and the WT dataset is shown again for reference.
- H
Detailed view of the wMelOTU (pink) active site region and its coordination of the Ub C‐terminus (red). Residues that coordinate Ub or stabilize the active site are shown with ball and stick representation.
- A
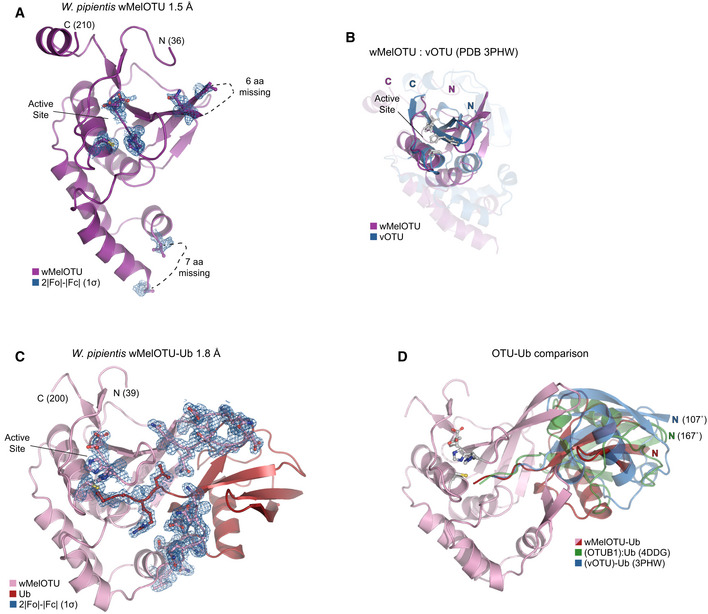
Cartoon representation of the 1.5 Å Wolbachia pipientis wMelOTU crystal structure with representative 2|F o|−|F c| electron density contoured at 1σ. Electron density is shown for catalytic triad residues as well as either edge of regions lacking interpretable density.
- B
Structural alignment of the core OTU folds (central β‐sheet and two supporting α‐helices) from CCHFV vOTU (blue, PDB 3PHW) and wMelOTU (purple). Surrounding regions are less well conserved and shown as semi‐transparent.
- C
Cartoon representation of the 1.8 Å W. pipientis wMelOTU‐Ub crystal structure with representative 2|F o|−|F c| electron density contoured at 1σ. Electron density is shown for the wMelOTU catalytic triad residues, the Ub C‐terminus, the two wMelOTU β‐hairpin regions that form the Ub embrace.
- D
Cartoon representation of the wMelOTU‐Ub crystal structure (pink/red) overlaid with the bound Ub molecules from the OTUB1:Ub structure (green, PDB 4DDG) and the CCHFV vOTU‐Ub structure (blue, PDB 3PHW). The OTUB1‐ and vOTU‐bound Ub molecules are rotated by 167° and 107°, respectively, in relation to the wMelOTU‐bound Ub.
- A
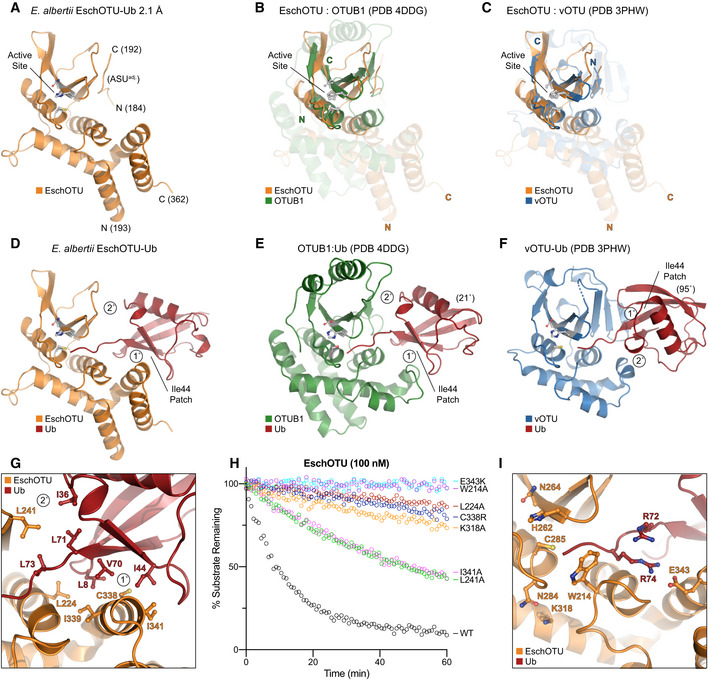
Cartoon representation of the 2.1 Å Escherichia albertii EschOTU‐Ub crystal structure with labeled termini and active site. Ub is hidden for this initial view of the OTU fold.
- B
Structural alignment of the core OTU folds (central β‐sheet and two supporting α‐helices) from human OTUB1 (green, PDB 4DDG) and EschOTU (orange). Surrounding regions are less well conserved and shown as semi‐transparent.
- C
Structural alignment of the core OTU folds (central β‐sheet and two supporting α‐helices) from CCHFV vOTU (blue, PDB 3PHW) and EschOTU (orange). Surrounding regions are less well conserved and shown as semi‐transparent.
- D
Full view of EschOTU (orange) covalently bound to Ub (red) in the S1 site. Primary and secondary interactions with Ub are labeled, as well as the Ub Ile44 hydrophobic patch.
- E
An aligned view as in (D), showing S1 site interactions between human OTUB1 (green) and Ub (red) (PDB 4DDG). Ub is rotated 21° relative to the EschOTU‐Ub structure, but maintains similar primary and secondary contacts.
- F
An aligned view as in (D), showing S1 site interactions between CCHFV vOTU (blue) and Ub (red) (PDB 3PHW). Ub is rotated by 95° relative to the EschOTU‐Ub structure and displays swapped primary and secondary contacts.
- G
Detailed view of the primary and secondary interfaces observed in the EschOTU‐Ub structure. EschOTU (orange) and Ub (red) residues participating in the interface are shown with ball and stick representation.
- H
Ub‐KG(TAMRA) cleavage assay monitoring the effects of structure‐guided EschOTU mutations. These data were collected in parallel with those presented in Fig 1G, and the WT dataset is shown again for clarity.
- I
Detailed view of the EschOTU (orange) active site region and its coordination of the Ub C‐terminus (red). Residues that coordinate Ub or stabilize the active site are shown with ball and stick representation.
- A
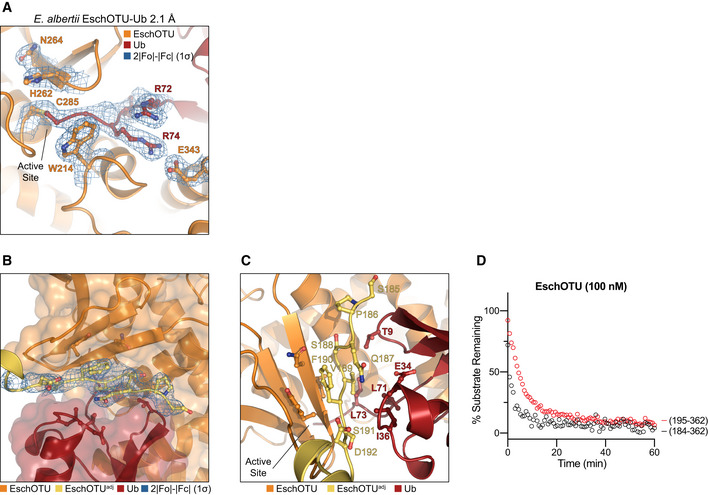
Detailed view of the active site in the EschOTU‐Ub crystal structure with representative 2|F o|−|F c| electron density contoured at 1σ. Electron density is shown for the EschOTU active site as well as the Ub C‐terminus and EschOTU residues that coordinate it.
- B
Transparent surface representation of the EschOTU‐Ub crystal structure (orange/red) showing insertion of the N‐terminus from a symmetry‐related molecule (yellow) with 2|F o|−|F c| electron density contoured at 1σ.
- C
Detailed view of the EschOTU N‐terminal insertion from a symmetry‐related molecule (yellow), and contacts to EschOTU (orange) and Ub (red).
- D
Ub‐KG(TAMRA) cleavage assay showing little effect on activity following removal of the N‐terminal region (residues 184–194).
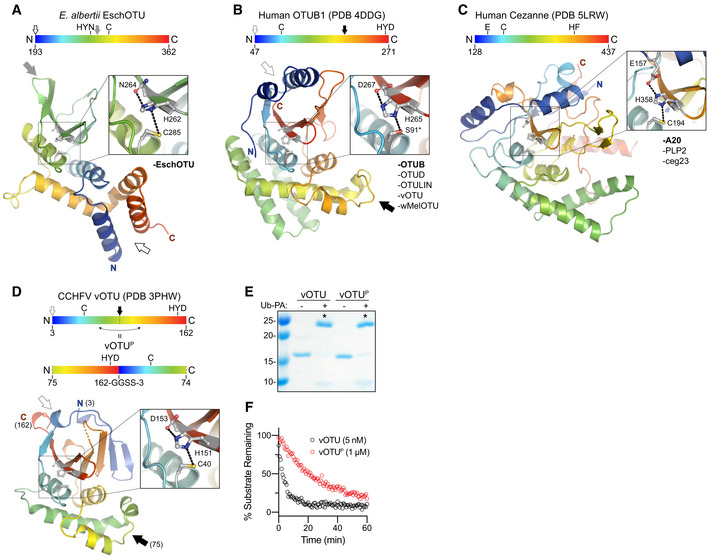
- A
Cartoon representation of the EschOTU crystal structure colored in a rainbow gradient from N‐ to C‐terminus. The catalytic triad residues are marked on both the structure and the linear color gradient above, showing their positions with respect to each other and the overall OTU sequence. The black and gray arrows relate how the EschOTU fold is permutated with respect to other OTUs. The black open arrow marks the open N‐ and C‐termini, while the closed gray arrow marks a closed loop. OTU subfamilies that follow this overall sequence topology are listed in the lower right. This arrangement is only observed in EschOTU.
- B
As in (A), for the human OTUB1 structure (PDB 4DDG). The closed black arrow marks a closed loop, while the open gray arrow marks the open N‐ and C‐termini. This arrangement is representative of the human Otubain, OTUD, and OTULIN subfamilies, as well as vOTUs.
- C
As in (A), for the human Cezanne structure (PDB 5LRW). This arrangement is representative of the human A20 subfamily, viral PLP2, and Legionella ceg23.
- D
As in (A), for the CCHFV vOTU structure (PDB 3PHW). A schematic for the permutated vOTUP variant is shown to illustrate how it relates to the native sequence topology.
- E
Ub‐PA activity‐based probe assay for WT vOTU and sequence‐permutated vOTUP. Strong reactivity is indicated with asterisks.
- F
Ub‐KG(TAMRA) cleavage assay monitored by fluorescence polarization for WT vOTU and sequence‐permutated vOTUP.
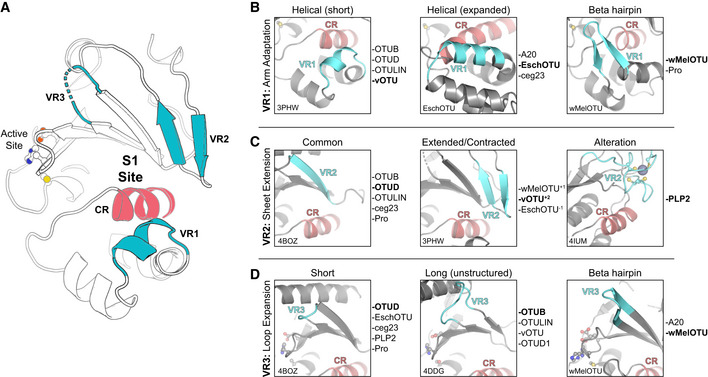
- A
Cartoon representation of the OTU fold (vOTU, PDB 3PHW), with the active site and S1 site indicated. The S1 site is composed of a common region (CR, red) surrounded by three variable regions (VR, blue) that are responsible for Ub binding.
- B
Comparison of structural adaptations in the VR1 arm region of the S1 site. VR1 has been observed to contribute to Ub binding as either a short α‐helical segment (left), an extended α‐helical region (center), or a β‐hairpin (right). Examples of OTUs that follow each arrangement are provided to the right.
- C
Comparison of structural adaptations in the VR2 central β‐sheet edge of the S1 site. VR2 has been observed to contribute to Ub binding in its most common arrangement (left), with additional or fewer β‐strands (center), or altered with additional substructure (right). Examples of OTUs that follow each arrangement are provided to the right.
- D
Comparison of structural adaptations in the VR3 loop extending from the central β‐sheet. This VR3 loop has been observed as short and not utilized in Ub binding (left), expanded and participating in unstructured interactions with Ub (center), or expanded with a β‐hairpin motif that binds Ub (right). Examples of OTUs that follow each arrangement are provided to the right.
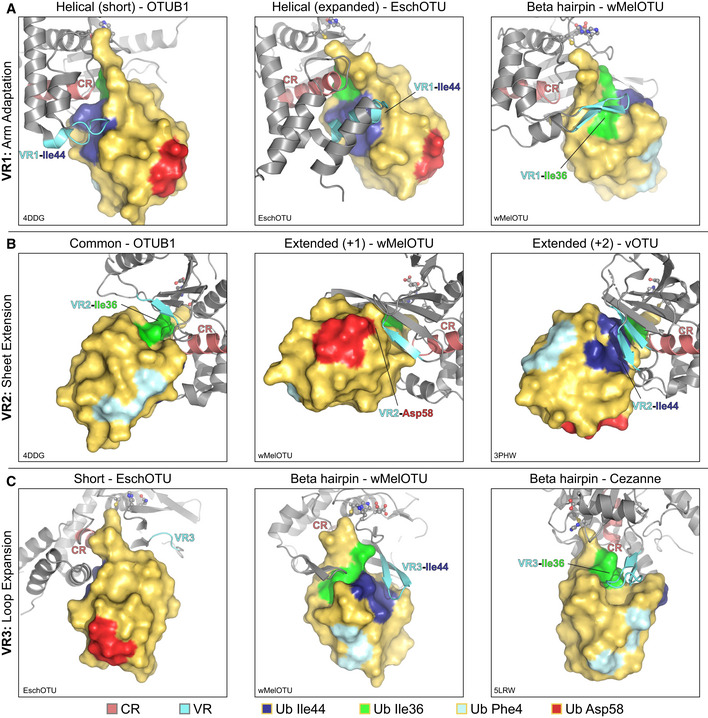
- A
Examples of Ub interaction surfaces contacted by OTU VR1 arm regions in the S1 site. OTUB1 (left) and EschOTU (center) contact the Ub Ile44 hydrophobic patch (blue), while wMelOTU (right) contacts the Ile36 hydrophobic patch (green).
- B
Examples of Ub interaction surfaces contacted by OTU VR2 β‐sheet edges in the S1 site. OTUB1 (left) contacts the Ub Ile36 hydrophobic patch (green), while wMelOTU (center) reaches to the Asp58 acidic patch (red) and CCHFV vOTU (right) contacts the Ile44 hydrophobic patch (blue).
- C
Examples of Ub interaction surfaces contacted by OTU VR3 loops in the S1 site. EschOTU (left), with its short VR3, makes no Ub contacts, while wMelOTU (center) contacts the Ub Ile44 hydrophobic patch (blue) and Cezanne (right) contacts the Ile36 hydrophobic patch (green).
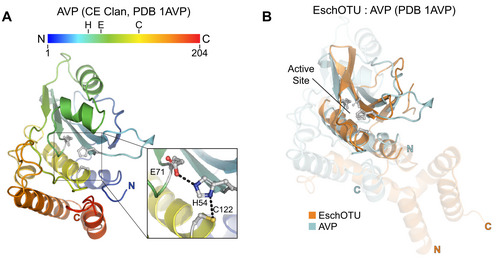
- A
Cartoon representation of the CE clan, human adenovirus 2 proteinase crystal structure (PDB 1AVP) colored in a rainbow gradient from N‐ to C‐terminus. The catalytic triad residues are marked on both the structure and the linear color gradient above, showing their positions with respect to each other and the overall sequence.
- B
Structural alignment of the core protease folds (central β‐sheet and two supporting α‐helices) from human adenovirus proteinase 2 of the CE clan (light blue, PDB 1AVP) and EschOTU (orange). Surrounding regions are less well conserved and shown as semi‐transparent.
References
Publication types
MeSH terms
Substances
Supplementary concepts
Associated data
- Actions
- Actions
- Actions
Grants and funding
LinkOut - more resources
Full Text Sources
