. 2020 Sep;88(3):588-595.
doi: 10.1002/ana.25812. Epub 2020 Jul 9.

Development and Validation of Forecasting Next Reported Seizure Using e-Diaries

Affiliations

Development and Validation of Forecasting Next Reported Seizure Using e-Diaries

Daniel M Goldenholz et al. Ann Neurol. 2020 Sep.

Abstract

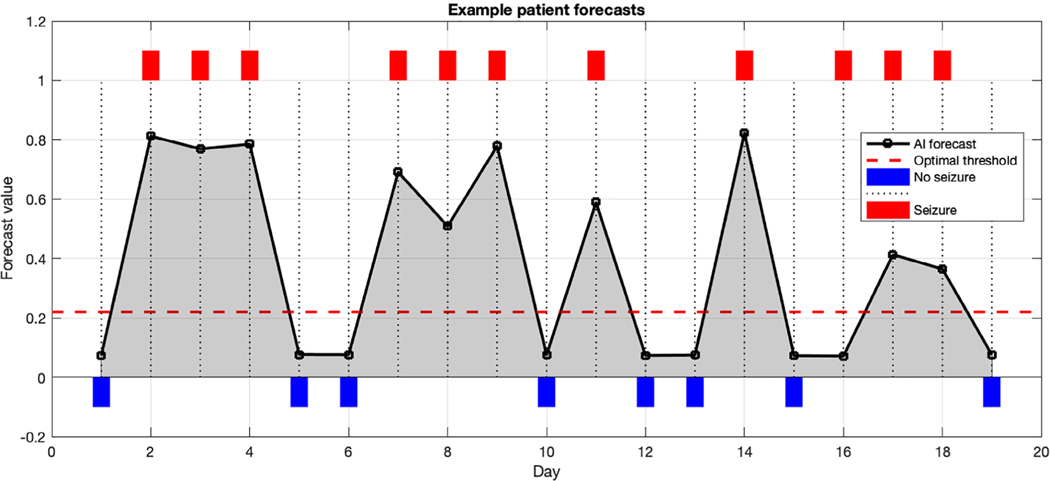
Objective: There are no validated methods for predicting the timing of seizures. Using machine learning, we sought to forecast 24-hour risk of self-reported seizure from e-diaries.

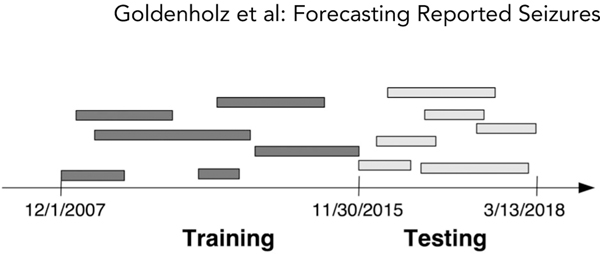
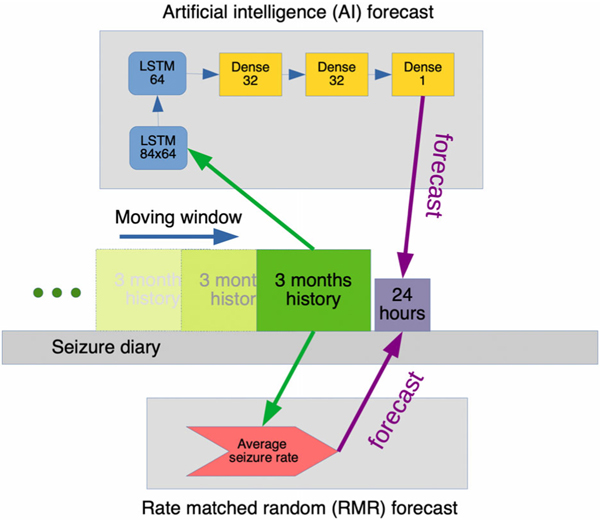
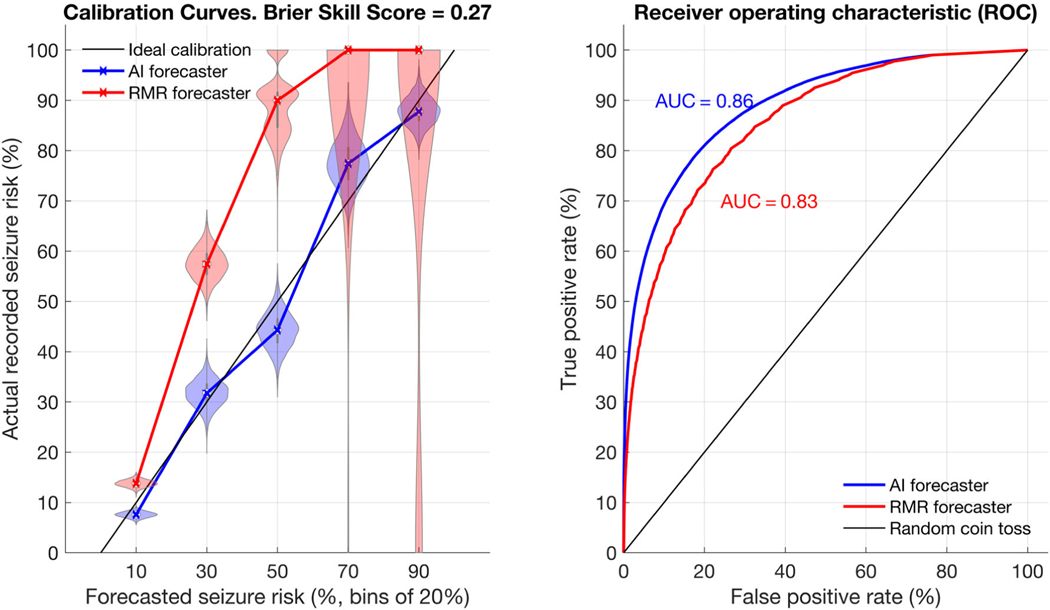
Methods: Data from 5,419 patients on SeizureTracker.com (including seizure count, type, and duration) were split into training (3,806 patients/1,665,215 patient-days) and testing (1,613 patients/549,588 patient-days) sets with no overlapping patients. An artificial intelligence (AI) program, consisting of recurrent networks followed by a multilayer perceptron ("deep learning" model), was trained to produce risk forecasts. Forecasts were made from a sliding window of 3-month diary history for each day of each patient's diary. After training, the model parameters were held constant and the testing set was scored. A rate-matched random (RMR) forecast was compared to the AI. Comparisons were made using the area under the receiver operating characteristic curve (AUC), a measure of binary discrimination performance, and the Brier score, a measure of forecast calibration. The Brier skill score (BSS) measured the improvement of the AI Brier score compared to the benchmark RMR Brier score. Confidence intervals (CIs) on performance statistics were obtained via bootstrapping.

Results: The AUC was 0.86 (95% CI = 0.85-0.88) for AI and 0.83 (95% CI = 0.81-0.85) for RMR, favoring AI (p < 0.001). Overall (all patients combined), BSS was 0.27 (95% CI = 0.23-0.31), also favoring AI (p < 0.001).

Interpretation: The AI produced a valid forecast superior to a chance forecaster, and provided meaningful forecasts in the majority of patients. Future studies will be needed to quantify the clinical value of these forecasts for patients. ANN NEUROL 2020;88:588-595.


Conflict of interest statement

Potential Conflicts of Interest

Nothing to report.

Figures

FIGURE 1:
FIGURE 1:
Illustration of training/testing data split. The entire seizure diary database was split based on the cutoff date of November 30, 2015. All diaries that began before that date that met eligibility criteria were included in the training set, but truncated at that date. All diaries that began after that date were included in the testing set. This scheme allowed for testing to occur on patients that the artificial intelligence was not exposed to during training.
FIGURE 2:
FIGURE 2:
How forecasts were made. A moving window of time, comprising 3 months of history and a 24-hour period, was slid across each patient’s seizure diary. For each position, the artificial intelligence (AI) and the rate-matched random (RMR) methods were used to produce one forecast. As shown, the AI method employed a preprocessing stage to generate an 84 × 3 matrix for input, and the RMR method took the first row from that matrix as input. The AI then processed the input using 2 long short-term memory (LSTM) layers, and then 3 densely connected layers to produce a single output forecast. The RMR calculated the average daily seizure rate from the 3-month history to produce an estimate.
FIGURE 3:
FIGURE 3:
Calibration and receiver operator characteristic (ROC). Calibration shows the relationship between actual recorded seizure probability and seizure forecast values. The rate-matched random (RMR) and artificial intelligence (AI) forecasters are shown in the left calibration curve with violin plots. On the right, the ROC plot compares both forecasters directly. For calibration plots, 5 bins of size 20% were used, meaning forecast values from 0–20, 20–40, 40–60, 60–80, and 80–100 are summarized in the figure along the x-axis. The ideal calibration for a hypothetical perfect forecaster is shown as a dotted black line. The violin plots represent a histogram of values, allowing a clear representation of the spread of values observed. The wider the plot becomes, the more likely a given value was. For instance, when RMR forecasted 20–40%, the true risk often was 60–75%. The calibration curve intersects the median values from each violin plot. RMR shows very poor calibration, particularly at higher forecast values, whereas the AI shows good calibration (ie, close to the idealized calibration curve). Of note, RMR rarely forecasted high-valued (>80%) forecasts, but when it did the true risk was always very low. The ROC plot shows the AI consistently outperforms RMR for any given threshold. AUC = area under the ROC curve.
FIGURE 4:
FIGURE 4:
Example patient diary. Shown here is a 19-day diary excerpt from one patient. The black line indicates the forecasts from each day. Red rectangles indicate seizure days, whereas blue rectangles indicate nonseizure days. The red dashed line shows the threshold that this particular patient can optimally use as a cutoff (based on the receiver operating characteristic over this patient’s entire 96-day diary). Optimal threshold was selected by finding the threshold that optimally trades off sensitivity and specificity. As seen here, most seizure days have forecasts above the optimal threshold, and most nonseizure days have forecasts below. AI = artificial intelligence.
FIGURE 5:
FIGURE 5:
Individual level forecasting metrics for dichotomized forecasts. Taking the optimal threshold cutoff for each patient, forecasts were recasts as “high risk” versus “low risk.” In that context, the upper graph compares time in warning (TIW) to sensitivity, whereas the lower graph compares the accuracy of high-risk to low-risk forecasts. In both, the color of each marker indicates the seizure rate for that patient. The ideal for the upper figure would be very low TIW (which would depend on seizure rate) and extremely high sensitivity. The ideal for the lower figure would be 0% seizures in low warning, and 100% seizures in high warning. sz = seizures.

References

    1. Institute of Medicine (US) Committee on the Public Health Dimensions of the Epilepsies In: England MJ, Liverman CT, Schultz AM, Strawbridge LM, eds. Epilepsy across the spectrum: promoting health and understanding. Washington, DC: National Academies Press, 2012. - PubMed
    1. Janse SA, Dumanis SB, Huwig T, et al. Patient and caregiver preferences for the potential benefits and risks of a seizure forecasting device: a best-worst scaling. Epilepsy Behav 2019;96:183–191. - PubMed
    1. Herzog AG, Fowler KM, Sperling MR, Massaro JM. Distribution of seizures across the menstrual cycle in women with epilepsy. Epilepsia 2015;56:e58–e62. - PubMed
    1. Baud MO, Kleen JK, Mirro EA, et al. Multi-day rhythms modulate seizure risk in epilepsy. Nat Commun 2018;9:1–10. - PMC - PubMed
    1. Karoly PJ, Goldenholz DM, Freestone DR, et al. Circadian and circaseptan rhythms in human epilepsy: a retrospective cohort study. Lancet Neurol 2018;17:977–985. - PubMed

Publication types