

Seizure protein 6 controls glycosylation and trafficking of kainate receptor subunits GluK2 and GluK3
- PMID: 32567721
- PMCID: PMC7396870
- DOI: 10.15252/embj.2019103457
Seizure protein 6 controls glycosylation and trafficking of kainate receptor subunits GluK2 and GluK3
Abstract
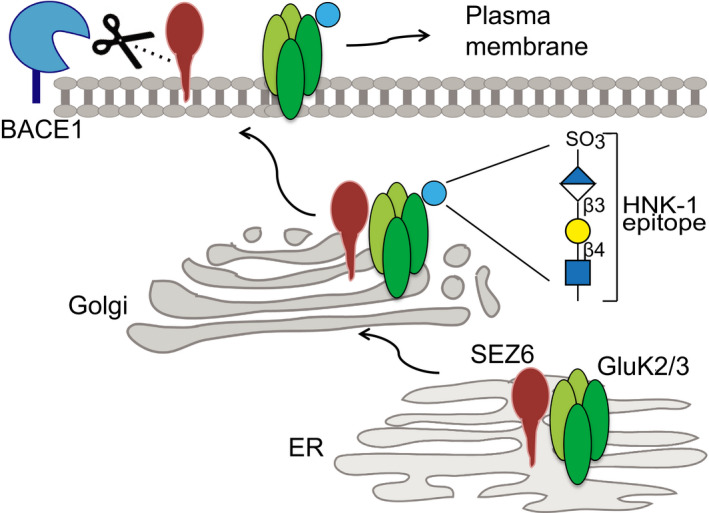
Seizure protein 6 (SEZ6) is required for the development and maintenance of the nervous system, is a major substrate of the protease BACE1 and is linked to Alzheimer's disease (AD) and psychiatric disorders, but its molecular functions are not well understood. Here, we demonstrate that SEZ6 controls glycosylation and cell surface localization of kainate receptors composed of GluK2/3 subunits. Loss of SEZ6 reduced surface levels of GluK2/3 in primary neurons and reduced kainate-evoked currents in CA1 pyramidal neurons in acute hippocampal slices. Mechanistically, loss of SEZ6 in vitro and in vivo prevented modification of GluK2/3 with the human natural killer-1 (HNK-1) glycan, a modulator of GluK2/3 function. SEZ6 interacted with GluK2 through its ectodomain and promoted post-endoplasmic reticulum transport of GluK2 in the secretory pathway in heterologous cells and primary neurons. Taken together, SEZ6 acts as a new trafficking factor for GluK2/3. This novel function may help to better understand the role of SEZ6 in neurologic and psychiatric diseases.
Keywords: BACE1; GluK2/3; HNK-1; SEZ6; protein trafficking.
© 2020 The Authors. Published under the terms of the CC BY 4.0 license.
Conflict of interest statement
The authors declare that they have no conflict of interest.
Figures

- A
Workflow of the surface analysis performed in SEZ6KO and WT neurons. SEZ6 flox/flox neurons were infected with CRE (SEZ6KO) and GFP (WT) virus at DIV2 and metabolic labeling was started at DIV5. Surface analysis was performed at DIV7.
- B
Protein classification of the total proteins (3,209, left panel) and of the glycoproteins (571, right panel) detected in three out of three experiments. More than 90% of the glycoproteins detected are classified as membrane proteins, as expected for the surface labeling.
- C
Changes of the 3,209 proteins detected on the cell surface of SEZ6KO neurons compared to WT. The average log2 fold change of SEZ6KO neurons over WT (log2 SEZ6KO/WT) is plotted against the negative log10 of each protein's P‐value according to a one‐sample t‐test. Blue labeled dots are considered as hits (including GluK2 and GluK3) and are proteins with a P‐value less than 0.05 (neg. log10(0.05) = 1.3; horizontal dotted line) and a fold‐change to less than −0.5 or more than 0.5 (vertical dotted lines). GluK2 and GluK3 are labeled in pink, GluA1 and GluA2 are indicated with green lines and dots, and GluN1 and GluN2B are marked with red lines and dots.
- A
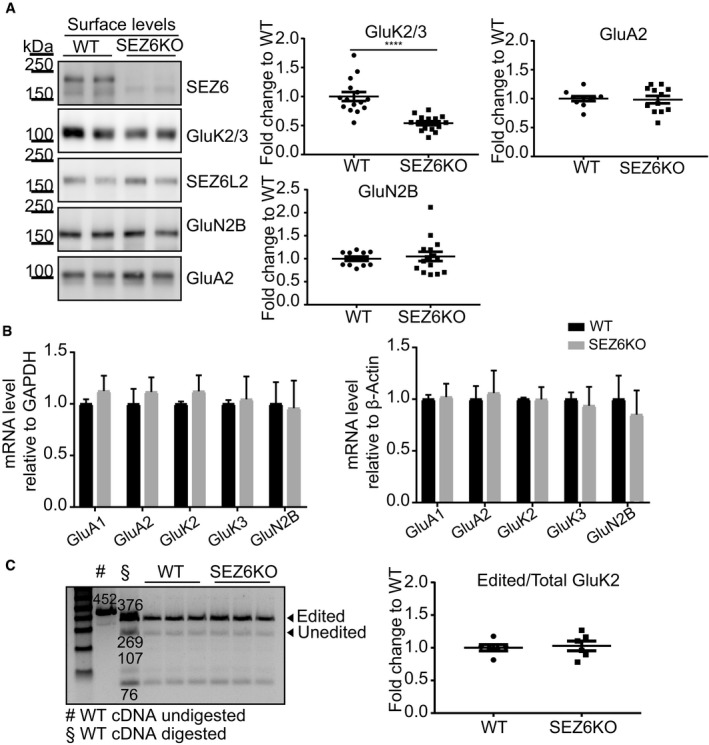
SEZ6KO and WT neurons were biotinylated with Sulfo‐NHS‐Biotin, and surface proteins were enriched by streptavidin bead pull‐down. The GluK2/3 antibody cannot discriminate the subunits 2 and 3 (Lerma & Marques, 2013); therefore, the band is commonly indicated with the labeling GluK2/3. GluK2/3, GluA2, and GluN2B surface levels were quantified, normalized to SEZ6L2 surface levels (negative control) in the same sample (GluK2/3/SEZ6L2) and divided by the WT levels, with the ratio for WT being set to 1.0 (plot shows mean ± SEM, at least 10 replicates in 4 independent biological experiments, Mann–Whitney ****P‐value < 0.005).
- B
mRNA levels of GluA1, GluA2, GluK2, GluK3, and GluN2B were quantified in SEZ6KO neurons, normalized to GAPDH and β‐actin mRNA in the same sample and compared to the mRNA levels in WT neurons. No difference in GluK2/3 mRNA was detected in SEZ6KO neurons compared to WT (plot shows mean ± SD, 6 replicates in 2 independent biological experiments, multiple t‐test was used).
- C
Editing of GluK2 mRNA was tested in SEZ6KO and WT neurons. The editing value was calculated as (intensity of 376 [edited]/intensity of [376 (edited) + 269 (unedited)]) × 100 and normalized to the band at 76 bp. No difference was detected in SEZ6KO neurons compared to WT (plot shows mean ± SEM, 6 replicates in 2 independent biological experiments, Mann–Whitney test was used).
- A
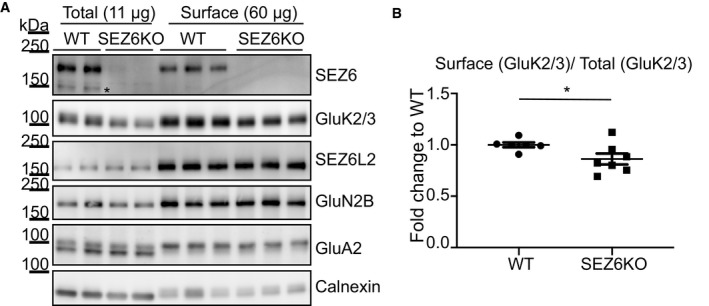
SEZ6KO and WT neurons were biotinylated with Sulfo‐NHS‐Biotin, and surface proteins were enriched by streptavidin bead pull‐down. Total proteins in the lysates (11 μg, “Total”) and surface proteins (60 μg, “Surface”) were analyzed by immunoblotting. The efficiency of the enrichment is shown by the calnexin depletion, by the absence of immature SEZ6 (black star, Pigoni et al, 2016) and by the absence of a second GluA2 band at a lower molecular weight in the surface pull‐down compared to the total lysates.
- B
GluK2/3 was quantified both in total lysates and at the cell surface, and GluK2/3 surface/total ratio was normalized for SEZ6L2 surface/total (plot shows mean ± SEM, 6 WT, and 7 SEZ6KO replicates and Mann–Whitney test were used. Exact *P‐value = 0.047).
- A
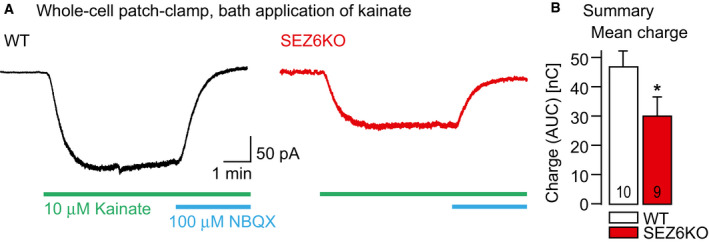
Left: Current trace resulting from whole‐cell voltage‐clamp recordings at a holding potential of −70 mV in a CA1 pyramidal neuron in a WT mouse hippocampal slice (P15). The current was recorded in the presence of 10 μM bicuculline, 20 μM GYKI53655, and 30 μM APV in the ACSF. Perfusion of the recording chamber with 10 μM kainate and 100 μM 2,3‐dioxo‐6‐nitro‐1,2,3,4‐tetrahydrobenzo[f]quinoxaline‐7‐sulfonamide (NBQX) are indicated with green and blue bars, respectively. Right: Analogous experiment in a SEZ6KO mouse (P15).
- B
Summary of the experiments in A. Bar graph illustrates mean charge with standard error of the mean carried by the inward currents (measured as area under the curve, AUC) for the two genotypes at P15 (WT 46.6 ± 0.5 nC (n = 10 cells), SEZ6KO 30.8 ± 0.5 nC (n = 9 cells), *P = 0.0375 Mann–Whitney U‐test).
- A
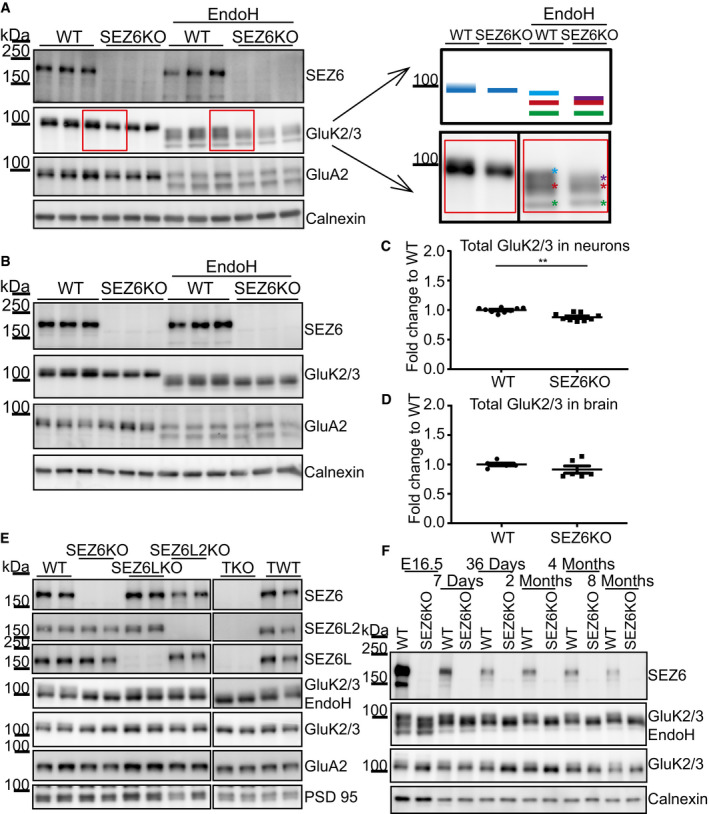
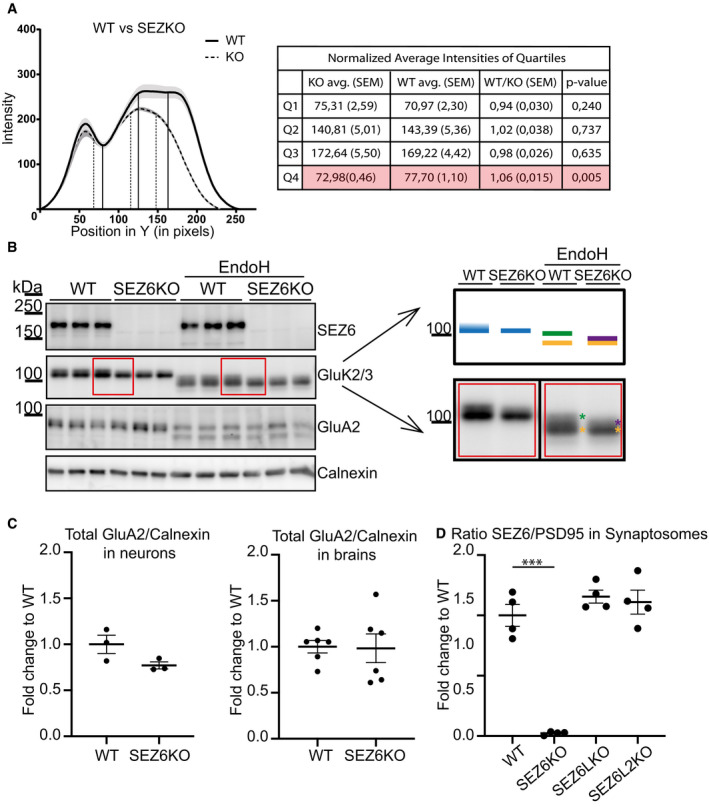
In WT neurons, GluK2/3 was seen as two closely comigrating bands, whereas the upper one of lower intensity was missing or running even more closely to the lower band of main intensity in SEZ6KO neurons (schematic representation on the right). When the total lysates of SEZ6KO and WT neurons were digested with endoglycosidase H (EndoH)—which removes immature, but not mature sugars—the two closely comigrating bands were converted to three bands of a lower apparent molecular weight, consistent with full deglycosylation of the lowest band and a partial deglycosylation of the upper two bands (marked in light blue, red, and green in the right panel). In SEZ6KO neurons, the uppermost (light blue) band was missing and a new band of lower apparent molecular weight was seen that was overlapping with the red labeled band and was indicated with the purple asterisk in the SEZ6KO. No difference in the glycosylation of GluA2 was detectable, pointing to a specific effect of SEZ6 on GluK2/3.
- B
The running pattern of GluK2/3 in SEZ6KO and WT brains was compared upon EndoH digestion. Similar to primary neurons, GluK2/3 displayed an immature glycosylation pattern in SEZ6KO brains.
- C
Total GluK2/3 levels were quantified and showed a significant but moderate reduction in SEZ6KO compared to WT neuronal lysates (plot shows mean ± SEM, 9 replicates in 3 independent biological experiments, Mann–Whitney **P‐value = 0.0012).
- D
No significant change in GluK2/3 total levels was detectable in SEZ6KO and WT adult brains (plot shows mean ± SEM, 6 replicates, Mann–Whitney test was used).
- E
Synaptosomes from knock‐out (KO) brains of single SEZ6 family members (SEZ6, SEZ6L, SEZ6L2), triple knock‐out (TKO), and respective controls (WT and TWT—triple WT) were digested with EndoH. GluK2/3 displayed the immature glycosylation in SEZ6KO and TKO brains, but not in SEZ6L and SEZ6L2 brains, demonstrating non‐redundant functions for the SEZ6 family members (n = 4).
- F
Brain homogenates from SEZ6KO and WT mice at different ages were digested with EndoH. GluK2/3 displayed the immature glycosylation at all developmental stages of SEZ6KO mice, suggesting that no compensation effect is occurring with aging.
- A
Quantification of the WT and KO samples represented in Fig 4A. In the graph, the average intensity along the y‐axis was plotted. Measurements were done from bottom to top. Thus, the point x = 0 marks the bottom of the band. The average of 6 WT and 5 SEZ6KO samples is plotted, with the shadowed area around the curves representing the standard error of the mean (SEM). Analysis of quartiles was done as described in the Materials and Methods section and was performed to focus on the intensity change in the top of the band. Vertical lines in the graph represent the quartiles that divide the area under the curve into 4 equal pieces. Results of the quartile analysis are summarized in the table. Analysis of the fourth quartile (Q4) demonstrates a significant increase in WT vs. SEZ6KO (highlighted lane in the table), consistent with the presence of the uppermost band in the immunoblot under WT but not under SEZ6KO conditions (t‐test was used, P‐values reported in the figure).
- B
In WT brains, GluK2/3 was seen as two closely comigrating bands, whereas the upper one of lower intensity was missing or running even more closely to the lower band of main intensity in SEZ6KO brains (schematic representation on the right). When the brains of SEZ6KO and WT neurons were digested with endoglycosidase H (EndoH), the two closely comigrating bands were converted to two bands of a lower apparent molecular weight, consistent with full deglycosylation of the lowest band and a partial deglycosylation of the upper band (marked in yellow and green in the right panel). In SEZ6KO neurons, the uppermost (green) band was missing and a new band of lower apparent molecular weight was seen that was overlapping with the yellow labeled band and was indicated with the purple asterisk in the SEZ6KO. No difference in the glycosylation of GluA2 was detectable, pointing to a specific effect of SEZ6 on GluK2/3.
- C
Total levels of GluA2 were quantified in WT and SEZ6 KO neurons and normalized to calnexin (left panel, plot shows mean ± SEM, 3 WT replicates and 3 SEZ6KO replicates were used). Total levels of GluA2 were quantified in WT and SEZ6 KO brains and normalized to calnexin (right panel, plot shows mean ± SEM, 6 WT replicates and 6 SEZ6KO replicates were used).
- D
SEZ6 was quantified in WT, SEZ6KO, SEZ6LKO, and SEZ6L2KO synaptosomes and normalized for PSD95 levels (plot shows mean ± SEM, 4 replicates per genotype, one‐way ANOVA, Dunnett's multiple comparison test vs. WT, ***P‐value < 0.0001).
- A
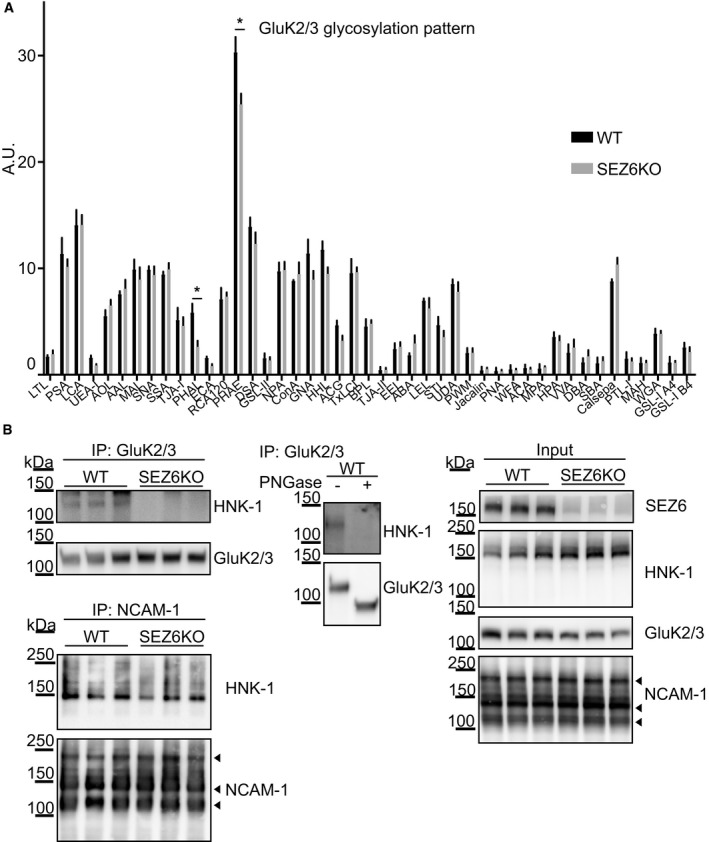
The glycome fingerprint of GluK2/3 was analyzed by lectin chip microarray (LecChip). Lectin PHAL and PHAE (indicated with asterisks) detected reduced amounts of the oligosaccharide Galβ1‐4GlcNAcβ1 on GluK2/3 in SEZ6KO neurons (plot shows mean ± SEM, 3 WT replicates and 4 SEZ6KO replicates were used, discoveries were determined using the FDR method of Benjamini and Hochberg, with Q = 2%).
- B
Immunoblot analysis revealed reduction of HNK‐1 epitope on GluK2/3 in SEZ6KO brains. Left panels: Comparable amounts of GluK2/3 were immunoprecipitated (IP) in WT and SEZ6KO brains using excess of brain homogenates compared to beads. Anti‐HNK‐1 antibody was used for detection. HNK‐1 band on GluK2/3 was detected only in WT brains but not in SEZ6KO brains (n = 6). As a control, HNK‐1 modification of NCAM‐1 was unaltered, as revealed after IP of NCAM‐1 from WT and SEZ6KO brains (n = 3), followed by detection with anti‐HNK‐1 antibody. Different isoforms of NCAM‐1 are annotated with arrowheads (NCAM 180, NCAM 140, and NCAM 120). Mid panel: To prove the specificity of the HNK‐1 antibody, GluK2/3 was immunoprecipitated and digested with Peptide‐N‐Glycosidase F (PNGase F), which removes N‐linked oligosaccharides. Upon PNGase F digestion, HNK‐1 was not detectable in WT brains and the molecular weight of GluK2/3 was reduced (n = 2). Right panels: In total brain homogenates (input), no difference of general HNK‐1 epitope or NCAM‐1 levels was detected.
- A
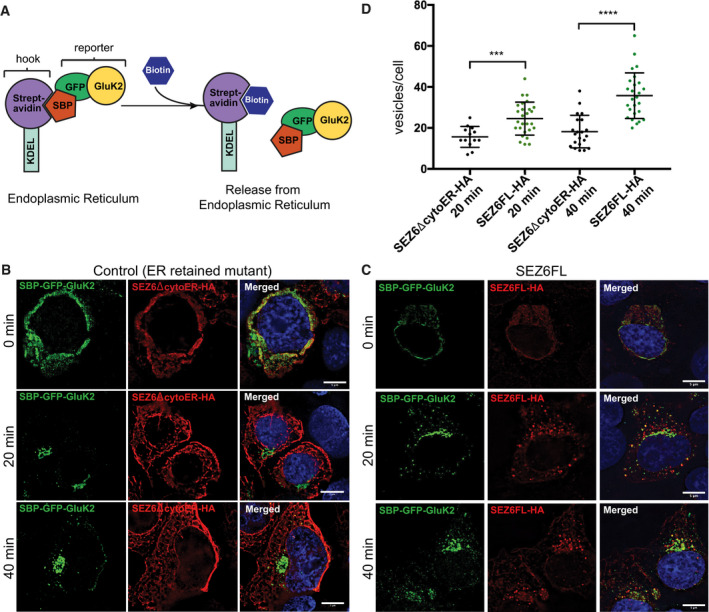
Schematic representation of the RUSH Cargo Sorting Assay using confocal microscopy. HEK293T cells were transfected with the SBP‐GFP‐GluK2 plasmid that expresses a fusion protein consisting of streptavidin binding peptide (SBP) followed by GFP and GluK2, and a streptavidin‐KDEL “anchor.” The ER retention signal KDEL retains SBP‐containing proteins in the ER. Upon addition of biotin to the cell culture medium, SBP‐GFP‐Gluk2 is released allowing its trafficking through the secretory pathway.
- B, C
The constitutively ER‐retained SEZ6 mutant SEZ6ΔcytoER‐HA (B) and full‐length wild‐type SEZ6FL‐HA (C) were co‐transfected with SBP‐GFP‐GluK2. Biotin was added to elicit release of SBP‐GFP‐GluK2 from the ER (0 min), and cells were fixed at different time points (0, 20, and 40 min). HA‐tagged SEZ6FL and SEZ6ΔcytoER transgenes were labeled with anti‐HA (mouse) and anti‐mouse‐Alexa594 antibodies. Size bars represent 5 μm.
- D
Scatter dot plot represents number of vesicles per cell in SBP‐GFP‐GluK2 RUSH experiment with SEZ6ΔcytoER‐HA (control) or SEZ6FL‐HA co‐transfection. Vesicle counts from 15 to 28 cells per timepoint from 2 independent experiments with mean number of vesicles and error bars (SD) are shown. Mann–Whitney test was used to compare HA‐tagged SEZ6FL and SEZ6ΔcytoER at each time point. At 20 min ***P‐value = 0.0007, at 40 min ****P‐value < 0.0001.
- A
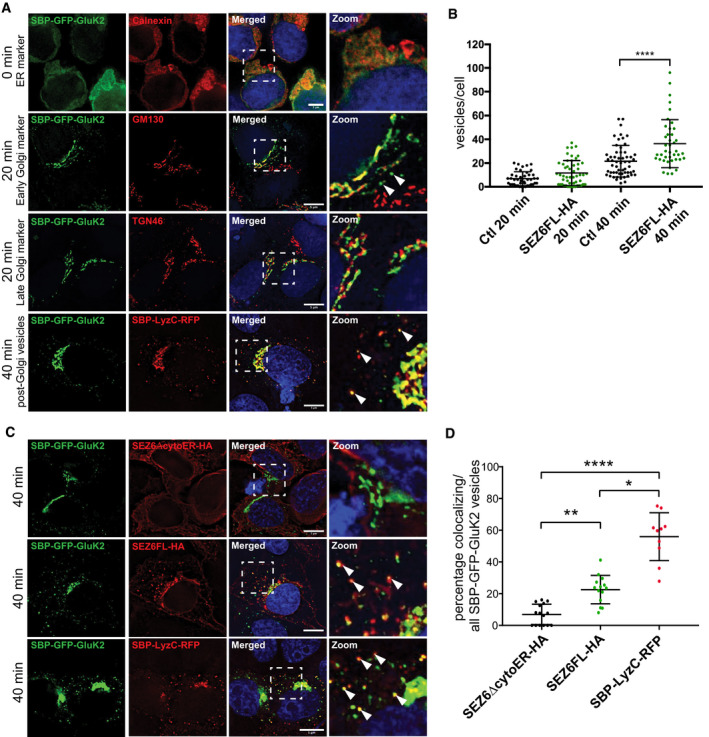
At timepoint “0 min”, SBP‐GFP‐GluK2 colocalizes with ER marker (anti‐calnexin(mouse) and anti‐mouse‐Alexa594). At “20 min”, SBP‐GFP‐GluK2 colocalizes with Golgi markers GM130 (mouse and anti‐mouse‐Alexa594) and TGN46 (sheep and anti‐sheep‐Alexa594) and is also found in some vesicles (white arrowheads). At “40 min”, SBP‐GFP‐GluK2 vesicles partially colocalize with SBP‐LyzC‐RFP vesicles (white arrowheads point to Golgi‐derived vesicles containing SBP‐GFP‐GluK2 and SBP‐LyzC‐RFP). Size bars represent 5 μm.
- B
RUSH experiment was performed co‐transfecting SBP‐mCherry‐GluK2 in HEK293T with the control plasmid (inactive Cre) or with SEZ6FL construct. The number of vesicles containing SBP‐mCherry‐GluK2 was determined at 20 and 40 min after biotin treatment. When SEZ6FL was co‐transfected, the number of vesicles containing SBP‐mCherry‐GluK2 was significantly higher compared to the control condition (plot shows mean ± S.D., 3 independent experiments, Mann–Whitney test was used to compare SEZ6FL and control at each time point. At 20 min, there was no significant difference, at 40 min ****P‐value < 0.0001).
- C
Colocalization of TGN‐derived vesicles of SBP‐GFP‐GluK2 in HEK293T cells co‐transfected with SEZ6ΔcytoER‐HA, SEZ6FL‐HA, and SBP‐LyzC‐RFP at “40 min” timepoint of RUSH experiment. White arrowheads point to vesicles containing SBP‐GFP‐GluK2 colocalizing with SEZ6FL‐HA or SBP‐LyzC‐RFP, respectively. Size bars represent 5 μm.
- D
Scatter dot plot represents percentage of colocalizing vesicles divided by total number of SBP‐GFP‐GluK2 vesicles. Plot shows mean and SD. Vesicle counts from 10 to 15 cells from 2 independent experiments are shown. Analysis was performed with non‐parametric Kruskal–Wallis test ****P‐value < 0.0001, followed by Dunn's multiple comparisons test SEZ6ΔcytoER‐HA vs. SEZ6FL‐HA **P‐value = 0.0093, SEZ6ΔcytoER‐HA vs. SBP‐LyzC‐RFP ****P‐value < 0.0001, SEZ6FL‐HA vs. SBP‐LyzC‐RFP *P‐value = 0.0241.
- A
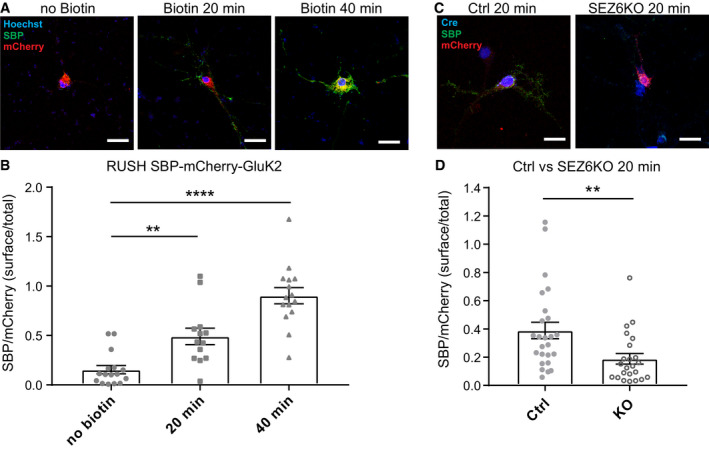
Representative pictures of WT hippocampal neurons transfected with the SBP‐mCherry‐GluK2 RUSH construct, followed by treating neurons with biotin and anti‐SBP antibodies (mouse, green) for 20 min or 40 min to live‐label the GluK2 transported to the neuronal cell surface. As a control (no biotin), neurons were incubated only with SBP antibody for 40 min. The surface/total ratio of SBP‐mCherry‐GluK2 constructs was estimated by calculating the ratio of SBP (green)/mCherry (red) fluorescence signals in the same area chosen for quantification.
- B
Quantification results for (A), indicating that incubation with biotin increases the surface/total ratio of SBP‐mCherry‐GluK2 over time. No Biotin n = 16, 20 min n = 13, 40 min n = 15, all biological replicates. Graph shows mean ± SEM, 1‐way ANOVA P < 0.0001 and Dunnett's post hoc test, no biotin vs. 20 min **P = 0.0030; no biotin vs. 40 min ****P < 0.0001.
- C, D
SEZ6 flox/flox neurons were lentivirally infected with inactivated Cre (Y324F, Ctrl) or Cre recombinase (SEZ6KO), followed by transfection with the SBP‐mCherry‐GluK2 construct and treated with biotin and anti‐SBP antibodies (mouse, green) for 20 min. The expression of inactivated Cre or Cre recombinase was confirmed by immunostaining with an anti‐Cre antibody (rabbit, blue). SEZ6KO neurons showed a significantly reduced surface/total ratio of SBP‐mCherry‐GluK2 (Ctrl n = 25, SEZ6KO n = 23 biological replicates. Graph shows mean ± SEM, unpaired t‐test, **P = 0.0068).
- A
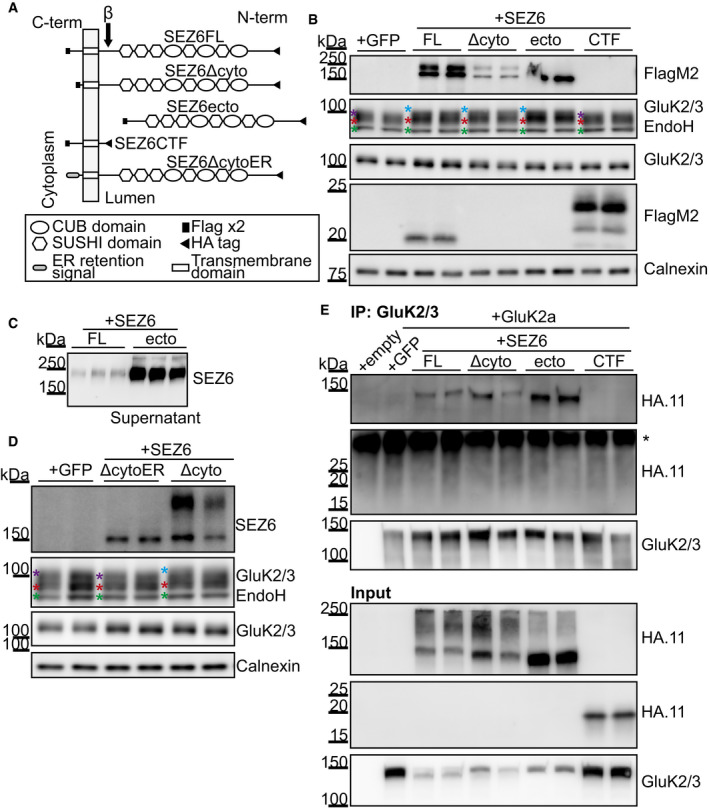
Schematic representation of the constructs used: SEZ6 full length (SEZ6FL), SEZ6 lacking the C‐terminal domain (SEZ6Δcyto), SEZ6 ectodomain generated by BACE1 cleavage (SEZ6ecto), SEZ6 C‐terminal fragment generated by BACE1 cleavage (SEZ6CTF), and SEZ6 lacking the C‐terminal domain but fused to an ER retention signal (SEZ6ΔcytoER).
- B, C
SEZ6 constitutive KO neurons were transduced with SEZ6 constructs. SEZ6FL and SEZ6Δcyto were detectable as two bands corresponding to mature (higher) and immature (lower) forms of SEZ6. No difference in the apparent molecular weight was detected because the high percentage of the gel used (12%) and the small C‐terminal deletion (39 amino acids). SEZ6ecto was present as the immature band in the neuronal lysates and as the mature, secreted band in the conditioned medium in panel C. SEZ6CTF (with HA and Flag‐tags) was detected at the expected low molecular weight. Additionally, the C‐terminal fragment generated from SEZ6FL by BACE1 cleavage was detected. Due to its lack of an HA‐tag, it had a lower molecular weight than SEZ6CTF. The C‐terminal fragment generated from SEZ6Δcyto upon BACE1 cleavage was not visible because of its low molecular weight. GluK2/3 glycosylation was rescued when SEZ6FL, SEZ6Δcyto, and SEZ6ecto were expressed in the neurons, but SEZ6CTF was not able to rescue the phenotype. Color coding for asterisks is the same as in Fig 4A. Representative blot of 3 independent experiments.
- D
Sez6 constitutive KO neurons were transduced with SEZ6ΔcytoER and SEZ6Δcyto. SEZ6ΔcytoER presented only the band corresponding to the immature form of SEZ6, as expected for a protein retained in the ER. SEZ6Δcyto, but not SEZ6ΔcytoER, was able to rescue GluK2/3 glycosylation, showing that SEZ6 localized to the ER is not sufficient to rescue the GluK2/3 glycosylation (n = 5). Color coding for asterisks is the same as in Fig 4A.
- E
HEK293T cells were co‐transfected with a GluK2a plasmid and the SEZ6 constructs. The expression of SEZ6 constructs was analyzed in the total lysates (“Input”) and revealed a similar expression of the different proteins. GluK2a was immunoprecipitated with GluK2/3 antibody, and the SEZ6 mutants were detected with the HA.11 antibody (“IP”). SEZ6FL, SEZ6Δcyto, and SEZ6ecto, but not SEZ6CTF were co‐immunoprecipitated with GluK2a, suggesting that SEZ6 extracellular domain is necessary for GluK2a binding. Representative blot of 2 independent experiments. * indicates the light chain of the antibody used for immunoprecipitation.

- A
WT neurons were treated with the BACE inhibitor C3 or DMSO as control and surface biotinylation with Sulfo‐NHS‐Biotin was performed. BACE1 inhibition did not only prevent SEZ6ecto formation (Pigoni et al, 2016), but also increased full‐length SEZ6 levels at the cell surface compared to the control condition. Even though SEZ6 full length accumulated on the cell surface of BACE‐inhibitor‐treated neurons, no change in GluK2/3 amounts at the cell surface was detected.
- B
Membrane fraction of WT and BACE1KO brains was digested with EndoH. As expected, SEZ6 full length accumulates in the membrane fraction of BACE1KO brains. No change in GluK2/3 glycosylation or total amount was detected. Color coding for asterisks is the same as in Fig 4A.
- C
WT and SEZ6KO neurons were treated with the BACE1 inhibitor C3 or DMSO as control and total lysates were analyzed after EndoH digestion. Even though SEZ6 full length accumulates upon BACE inhibition, and GluK2/3 presents immature glycosylation in the SEZ6KO neurons, no change of GluK2/3 glycosylation or total amounts was seen when WT neurons were treated with C3. This indicates that both surface localization (A) and glycosylation (B and C) of GluK2/3 are likely to have reached their maximum in WT cells and cannot be enhanced by increased SEZ6 levels, as induced here through BACE1 inhibition. Color coding for asterisks is the same as in Fig 4A.
Similar articles
-
Antagonism of recombinant and native GluK3-containing kainate receptors.Neuropharmacology. 2009 Jan;56(1):131-40. doi: 10.1016/j.neuropharm.2008.08.002. Epub 2008 Aug 12. Neuropharmacology. 2009. PMID: 18761361
-
Assembly and Trafficking of Homomeric and Heteromeric Kainate Receptors with Impaired Ligand Binding Sites.Neurochem Res. 2019 Mar;44(3):585-599. doi: 10.1007/s11064-018-2654-0. Epub 2018 Oct 9. Neurochem Res. 2019. PMID: 30302614 Free PMC article.
-
Amino-terminal domains of kainate receptors determine the differential dependence on Neto auxiliary subunits for trafficking.Proc Natl Acad Sci U S A. 2017 Jan 31;114(5):1159-1164. doi: 10.1073/pnas.1619253114. Epub 2017 Jan 18. Proc Natl Acad Sci U S A. 2017. PMID: 28100490 Free PMC article.
-
The Deletion of GluK2 Alters Cholinergic Control of Neuronal Excitability.Cereb Cortex. 2022 Jul 12;32(14):2907-2923. doi: 10.1093/cercor/bhab390. Cereb Cortex. 2022. PMID: 34730179
-
Kainate and AMPA receptors in epilepsy: Cell biology, signalling pathways and possible crosstalk.Neuropharmacology. 2021 Sep 1;195:108569. doi: 10.1016/j.neuropharm.2021.108569. Epub 2021 Apr 26. Neuropharmacology. 2021. PMID: 33915142 Review.
Cited by
-
BACE inhibitor treatment of mice induces hyperactivity in a Seizure-related gene 6 family dependent manner without altering learning and memory.Sci Rep. 2021 Jul 23;11(1):15084. doi: 10.1038/s41598-021-94369-0. Sci Rep. 2021. PMID: 34302009 Free PMC article.
-
ADAMTS1, MPDZ, MVD, and SEZ6: candidate genes for autosomal recessive nonsyndromic hearing impairment.Eur J Hum Genet. 2022 Jan;30(1):22-33. doi: 10.1038/s41431-021-00913-x. Epub 2021 Jun 16. Eur J Hum Genet. 2022. PMID: 34135477 Free PMC article.
-
Syngap+/- CA1 Pyramidal Neurons Exhibit Upregulated Translation of Long MRNAs Associated with LTP.eNeuro. 2025 May 19;12(5):ENEURO.0086-25.2025. doi: 10.1523/ENEURO.0086-25.2025. Print 2025 May. eNeuro. 2025. PMID: 40295099 Free PMC article.
-
Whole-genome resequencing of three Coilia nasus population reveals genetic variations in genes related to immune, vision, migration, and osmoregulation.BMC Genomics. 2021 Dec 6;22(1):878. doi: 10.1186/s12864-021-08182-0. BMC Genomics. 2021. PMID: 34872488 Free PMC article.
-
The β-Secretase Substrate Seizure 6-Like Protein (SEZ6L) Controls Motor Functions in Mice.Mol Neurobiol. 2022 Feb;59(2):1183-1198. doi: 10.1007/s12035-021-02660-y. Epub 2021 Dec 27. Mol Neurobiol. 2022. PMID: 34958451 Free PMC article.
References
-
- Ball SM, Atlason PT, Shittu‐Balogun OO, Molnar E (2010) Assembly and intracellular distribution of kainate receptors is determined by RNA editing and subunit composition. J Neurochem 114: 1805–1818 - PubMed
-
- Bernard A, Ferhat L, Dessi F, Charton G, Represa A, Ben‐Ari Y, Khrestchatisky M (1999) Q/R editing of the rat GluR5 and GluR6 kainate receptors in vivo and in vitro: evidence for independent developmental, pathological and cellular regulation. Eur J Neuorsci 11: 604–616 - PubMed
-
- Boncompain G, Divoux S, Gareil N, de Forges H, Lescure A, Latreche L, Mercanti V, Jollivet F, Raposo G, Perez F (2012) Synchronization of secretory protein traffic in populations of cells. Nat Methods 9: 493 - PubMed
-
- Bonifacino JS, Traub LM (2003) Signals for sorting of transmembrane proteins to endosomes and lysosomes. Annu Rev Biochem 72: 395–447 - PubMed
Publication types
MeSH terms
Substances
Grants and funding
LinkOut - more resources
Full Text Sources
Molecular Biology Databases
Miscellaneous
