

Structural insights into actin filament recognition by commonly used cellular actin markers
- PMID: 32567727
- PMCID: PMC7360965
- DOI: 10.15252/embj.2019104006
Structural insights into actin filament recognition by commonly used cellular actin markers
Abstract
Cellular studies of filamentous actin (F-actin) processes commonly utilize fluorescent versions of toxins, peptides, and proteins that bind actin. While the choice of these markers has been largely based on availability and ease, there is a severe dearth of structural data for an informed judgment in employing suitable F-actin markers for a particular requirement. Here, we describe the electron cryomicroscopy structures of phalloidin, lifeAct, and utrophin bound to F-actin, providing a comprehensive high-resolution structural comparison of widely used actin markers and their influence towards F-actin. Our results show that phalloidin binding does not induce specific conformational change and lifeAct specifically recognizes closed D-loop conformation, i.e., ADP-Pi or ADP states of F-actin. The structural models aided designing of minimal utrophin and a shorter lifeAct, which can be utilized as F-actin marker. Together, our study provides a structural perspective, where the binding sites of utrophin and lifeAct overlap with majority of actin-binding proteins and thus offering an invaluable resource for researchers in choosing appropriate actin markers and generating new marker variants.
Keywords: actin cytoskeleton; cellular markers; cryoEM; lifeAct; phalloidin.
© 2020 The Authors. Published under the terms of the CC BY 4.0 license.
Conflict of interest statement
The authors declare that they have no conflict of interest.
Figures
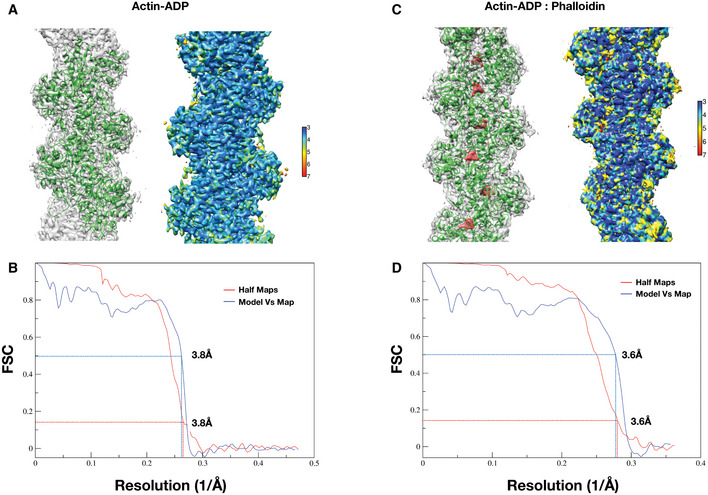
- A–D
(A, C) The overlay of the model (green) on the cryoEM map in gray and local resolution map of actin:ADP (apo) and actin:ADP‐phalloidin structures, respectively. The red density is the difference density of phalloidin in panel (C). (B, D) FSC plots of the half‐maps and the map versus model for the Actin–ADP and Actin–ADP–phalloidin, respectively. The resolutions were estimated based on 0.143 criteria for the half‐maps and 0.5 for the model versus map.
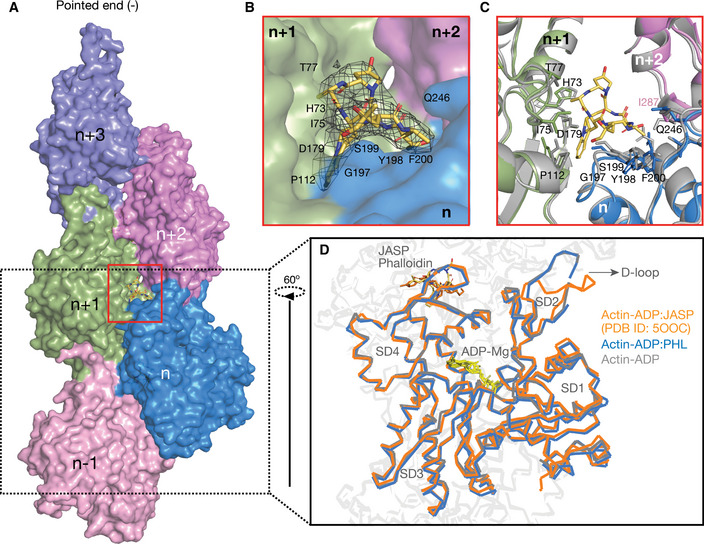
- A
Surface representation of F‐actin–ADP model, five monomers marked as n series from barbed to pointed end. A phalloidin molecule (yellow stick representation) bound between three actin monomers is highlighted.
- B
Expanded view of phalloidin‐binding pocket as marked with red box in panel (A). The density of phalloidin from EM map is shown around the ligand.
- C
Comparison of phalloidin‐binding pocket residues between apo (in gray) and phalloidin bound (actin monomer colors as indicated in panel A) Key residues with their side chains and phalloidin are represented in stick representation.
- D
Overlay of F‐actin–ADP (gray), ADP/Phalloidin (blue), and ADP/Jasplakinolide (orange) shows the D‐loop conformations across different structures as indicated.
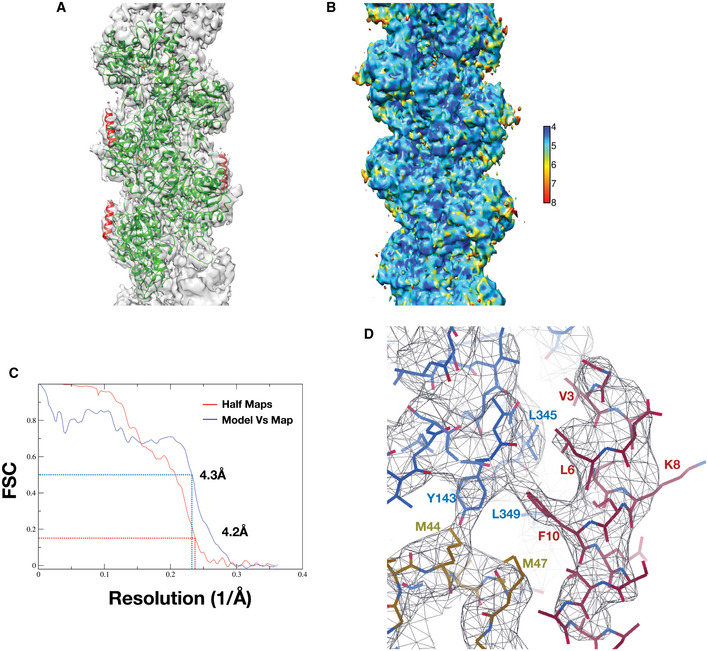
- A
Overlay of model with map, actin, and lifeAct are colored as green and red, respectively.
- B
Local resolution of lifeAct‐bound F‐actin map with color gradient chart determined with Resmap.
- C
FSC plots of the half‐maps (0.143) and the map versus model (0.5) for F‐actin:lifeAct structure.
- D
Closer view of lifeAct:F‐actin interaction with map, key residues marked.
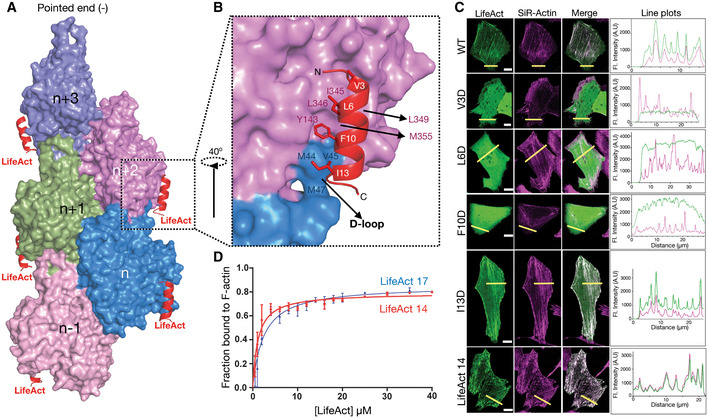
- A
Surface representation of F‐actin bound to lifeAct as indicated.
- B
Cartoon representation of lifeAct (red) in expanded view with n and n + 2nd actin monomers (surface representation in magenta and blue), key interacting residues are highlighted.
- C
Confocal images of U2OS cells transiently expressing lifeAct‐GFP wild‐type and mutants of lifeAct residues interacting with F‐actin, cells were additionally stained with SiR‐actin to confirm the actin filaments. The line scan as indicated with yellow line on the cells shows the extent of lifeAct (green) and SiR‐actin (magenta) co‐staining of actin structures. Scale bar = 5 μm.
- D
Binding affinities calculated from titration data of co‐sedimentation assays of lifeAct‐14 (1.2 μM) and lifeAct‐17 (2.2 μM) as indicated. Data points for each concentration were averaged from three independent experiments; error bars represent SD between independent experiments.
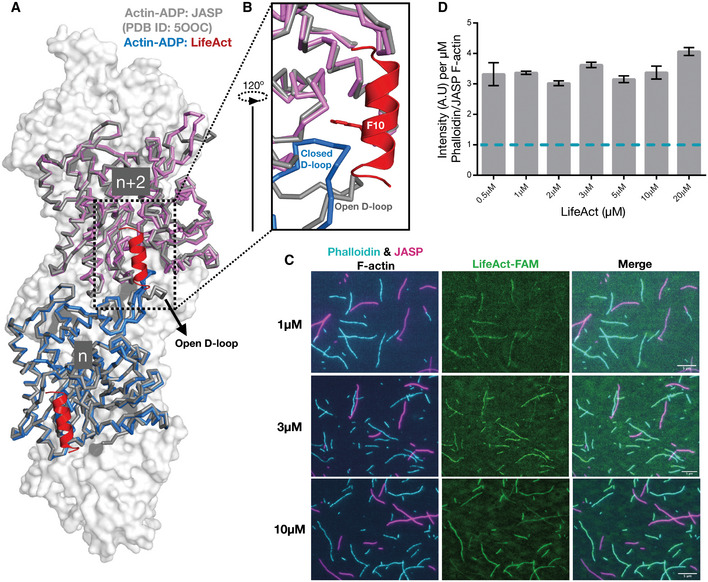
- A, B
Overlay of F‐actin:ADP‐bound LifeAct (actin in blue and magenta ribbon representation and lifeAct in red cartoon) and jasplakinolide (in gray).
- C
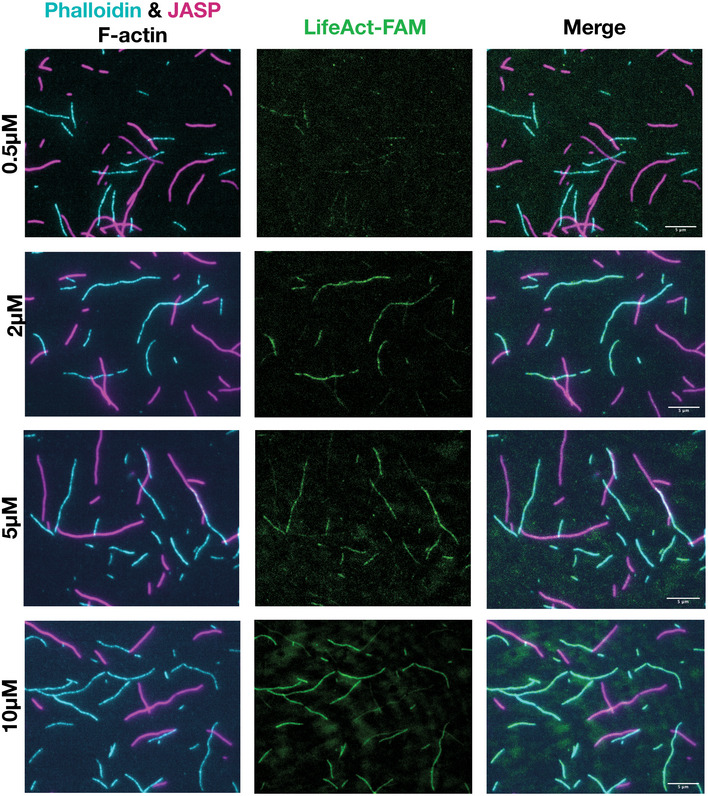
Representative TIRF images of lifeAct‐binding experiments as indicated. The remaining lifeAct concentration images are shown in Fig EV3. Scale bar = 5 μm.
- D
Mean ratio of lifeAct fluorescent intensity bound to phalloidin and jasplakinolide F‐actin (mean and SEM; n = 2 or three independent experiments with > 50 actin filament for each set).
- A
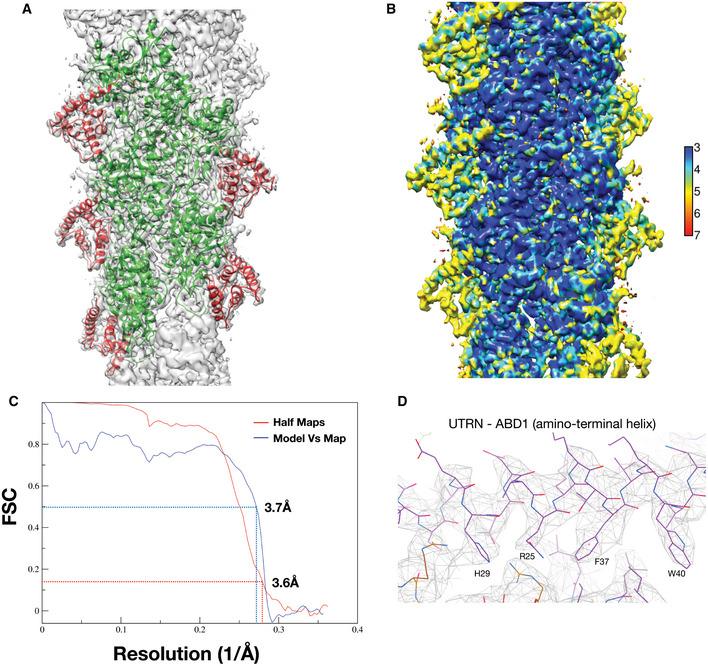
Overlay of model with map, actin and utrophin CH1 are colored as green and red, respectively.
- B
Local resolution of utrophin CH1‐bound F‐actin map with color gradient chart as indicated.
- C
FSC plots of the half‐maps (0.143) and the map versus model (0.5) for F‐actin:utrophin CH1 structure.
- D
Closer view of ABD1 (amino‐terminal helix) utrophin map with key residues marked.
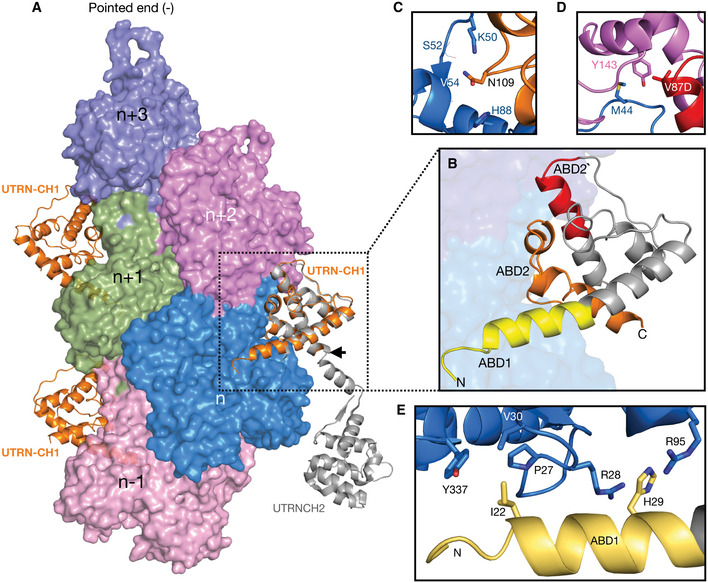
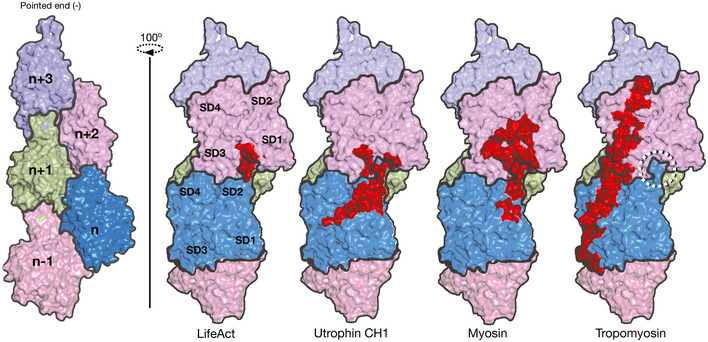
- A
Surface representation of F‐actin–ADP, five monomers marked as n series from barbed to pointed end. The utrophin CH1 domain in orange interacts with two adjacent actin monomers thus following the actin helical pattern. The crystal structure of dystrophin/utrophin in gray (1DXX) superimposed with cryoEM utrophin CH1 model, boundary of CH1 is marked by an arrow.
- B
Closer view of utrophin CH1 model, the yellow, orange, and red region depicts ABD1, ABD2, and ABD2′ sites, respectively. The ABD1 and ABD2 sites are restricted to n th actin monomer, and the ADB2` site partially interacts with the neighboring n + 2nd actin monomer.
- C–E
Residual level information of key amino acids interacting with actin monomers from ABD2: N109 (C); ABD2' site: V87 (D); and ABD1: I22, H29 (E).
- A
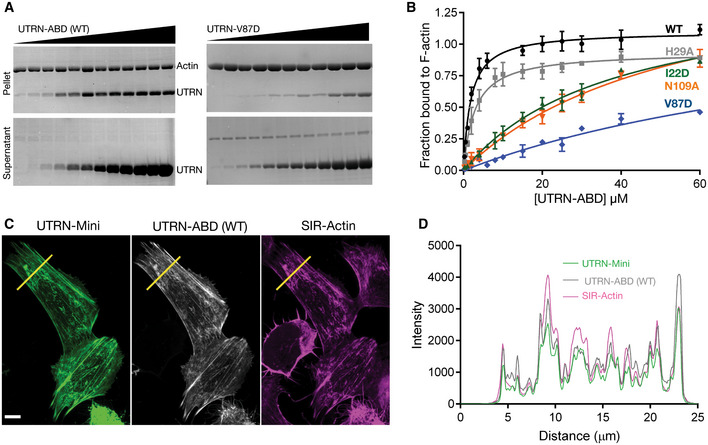
Representative Coomassie‐stained SDS‐PAGE gels of UTRN‐ABD and UTRN‐V87D co‐sedimentation with F‐actin. Pellet (top) and supernatant (bottom) fractions of individual co‐sedimentation reactions of increasing utrophin concentrations, and uncropped gel images of all the co‐sedimentation reactions are presented in Appendix Fig S3.
- B
Apparent K d indicated was calculated from the titration data of co‐sedimentation assays of utrophin wild‐type (1.8 μM) and mutants; H29A (2.8 μM), I22D (38 μM), V87D (> 100 μM), and N109A (55 μM) as indicated. Data points for each concentration were averaged from three independent experiments; error bars represent SD between independent experiments.
- C
Confocal images of U20S cells transfected with GFP tagged UTRN‐mini and mCherry‐UTRN‐ABD, stained with SIR‐Actin shows F‐actin structures, mainly stress fibers. Scale bar = 5 μm.
- D
Co‐localization analysis by intensity plot of GFP UTRN‐mini, mCherry‐UTRN‐ABD, and SiR‐Actin fluorescence using line scan of the region as indicated by the yellow line in (C).
References
Publication types
MeSH terms
Substances
Associated data
- Actions
- Actions
- Actions
- Actions
Grants and funding
- SB/S2/RJN-094/2017/Science and Engineering Research Board (SERB)
- IA/I/14/2/501533/The Wellcome Trust DBT India Alliance (India Alliance)
- European Molecular Biology Organization (EMBO)
- RA-40796915460/Department of Biotechnology, Ministry of Science and Technology (DBT)
- WT_/Wellcome Trust/United Kingdom
LinkOut - more resources
Full Text Sources
Research Materials
Miscellaneous
