

MICOS assembly controls mitochondrial inner membrane remodeling and crista junction redistribution to mediate cristae formation
- PMID: 32567732
- PMCID: PMC7361284
- DOI: 10.15252/embj.2019104105
MICOS assembly controls mitochondrial inner membrane remodeling and crista junction redistribution to mediate cristae formation
Abstract
Mitochondrial function is critically dependent on the folding of the mitochondrial inner membrane into cristae; indeed, numerous human diseases are associated with aberrant crista morphologies. With the MICOS complex, OPA1 and the F1 Fo -ATP synthase, key players of cristae biogenesis have been identified, yet their interplay is poorly understood. Harnessing super-resolution light and 3D electron microscopy, we dissect the roles of these proteins in the formation of cristae in human mitochondria. We individually disrupted the genes of all seven MICOS subunits in human cells and re-expressed Mic10 or Mic60 in the respective knockout cell line. We demonstrate that assembly of the MICOS complex triggers remodeling of pre-existing unstructured cristae and de novo formation of crista junctions (CJs) on existing cristae. We show that the Mic60-subcomplex is sufficient for CJ formation, whereas the Mic10-subcomplex controls lamellar cristae biogenesis. OPA1 stabilizes tubular CJs and, along with the F1 Fo -ATP synthase, fine-tunes the positioning of the MICOS complex and CJs. We propose a new model of cristae formation, involving the coordinated remodeling of an unstructured crista precursor into multiple lamellar cristae.
Keywords: MINFLUX; cristae biogenesis; electron microscopy; nanoscopy; super-resolution microscopy.
© 2020 The Authors. Published under the terms of the CC BY 4.0 license.
Conflict of interest statement
The authors declare that they have no conflict of interest.
Figures
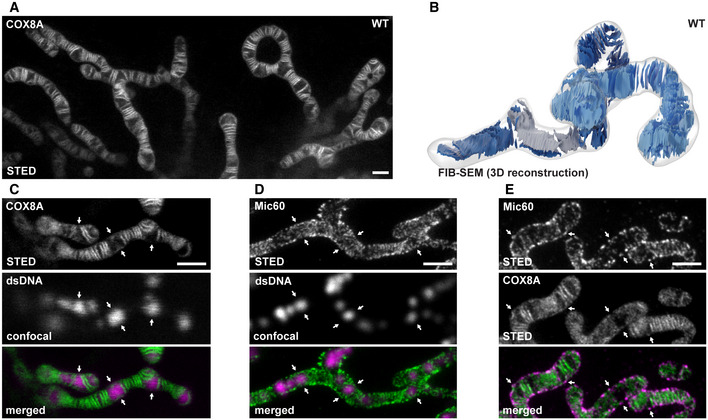
- A
Live‐cell nanoscopy of HeLa cells. COX8A‐SNAP was labeled with SNAP‐cell SiR and imaged with STED nanoscopy.
- B
3D architecture of cristae in HeLa cells visualized by FIB‐SEM. The OM and the IBM are together shown as a transparent surface. Cristae of two mitochondria are depicted in light and dark blue. A twisted crista is shown in gray.
- C
Live‐cell recording as in (A). In addition, mitochondrial DNA was stained with PicoGreen and imaged by confocal laser scanning microscopy. Arrows mark sites where nucleoids but no lamellar cristae are present.
- D
STED nanoscopy of mitochondria immunolabeled for Mic60 and dsDNA. Arrows mark sites where nucleoids are present.
- E
Dual‐color STED nanoscopy of cells labeled for COX8A‐SNAP and immunolabeled for Mic60. Arrows mark Mic60 clusters in the absence of fully developed lamellar cristae.

- A
Left: STED nanoscopy of mitochondria immunolabeled for Mic60 and dsDNA. A part of the image is also shown in Fig 1D. Right: Line profiles of the fluorescence intensities were measured at six sites exhibiting mtDNA (blue arrows) and at six sites devoid of mtDNA (white arrows), as indicated. The six line profiles of each condition were normalized and averaged, respectively.
- B
Dual‐color STED nanoscopy of cells labeled for COX8A‐SNAP and immunolabeled for Mic60. A part of the image is also shown in Fig 1E.
- C
Protein levels of mitochondrial proteins in cell lysates from WT cells and MICOS mutants. Cell lysates from the indicated cell lines were analyzed by Western blotting.
- D
BN–PAGE of isolated mitochondria. Indicated cell lines were analyzed by BN–PAGE and Western blotting.
- A
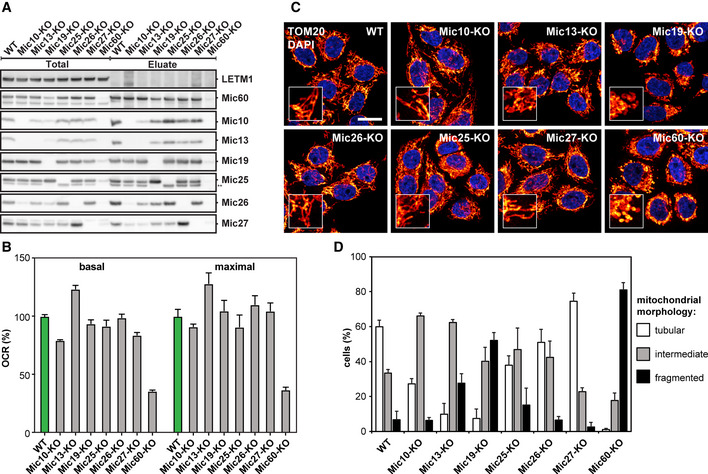
Composition of MICOS in WT cells and MICOS mutants. Mic60‐specific antibodies were used to pull‐down Mic60 and interacting proteins from insolated mitochondria. ** Unspecific band, due to the cross reaction of the anti‐Mic25 antibody with Mic19.
- B
Oxygen consumption rate (OCR) of WT cells and MICOS mutants as analyzed by Seahorse Analyzer. Basal and maximal OCR are shown relative to the WT. Error bars: SEM, n = 6.
- C
Mitochondrial networks of WT and MICOS mutant cells. Cells were immunolabeled for TOM20 and visualized by confocal microscopy. The inset shows a magnification of the respective overview image. Scale bar: 10 μm.
- D
Quantification of the mitochondrial networks as shown in (C). The evaluation was performed manually in a blinded approach based on pre‐defined morphology criteria. Average and SD of three independent biological replicates are shown (> 170 cells per sample and replicate).
- A
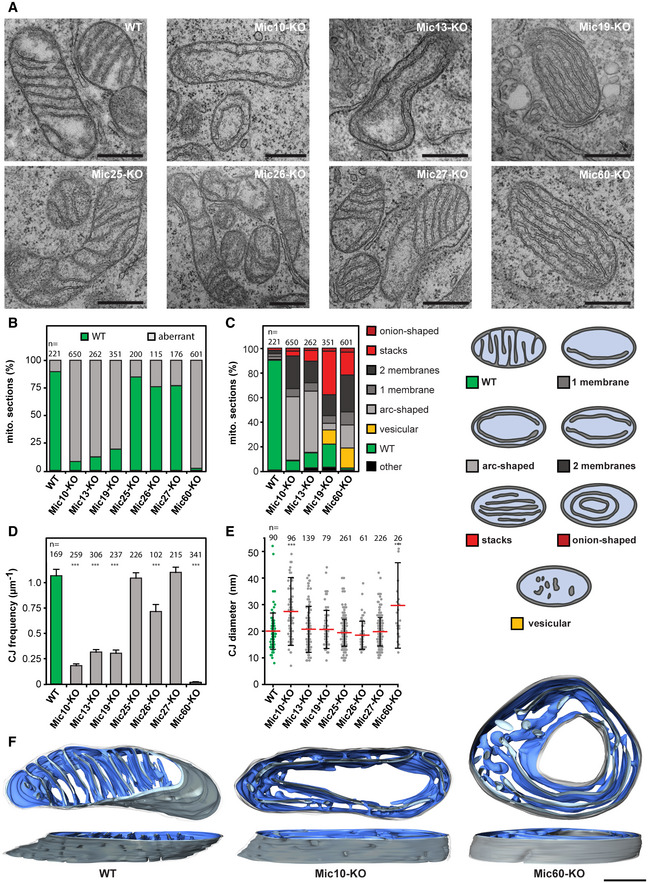
Representative TEM recordings of WT cells and MICOS‐KO mutants, as indicated. Ultra‐thin sections were taken in parallel to the growth surface of the cells.
- B
Quantification of the overall cristae morphology on TEM recordings.
- C
Quantification of detailed morphology of CMs in MICOS mutants (left). TEM recordings were assigned to eight classes (right).
- D
CJ frequency on TEM recordings. The number of CJs was manually determined and normalized to the length of the OM. Samples were compared to WT by a one‐way ANOVA test. Error bars: SEM.
- E
Diameter of CJs. CJs were manually measured on TEM recordings. Red line: Average. Error bars: SD. Samples were compared to WT by a one‐way ANOVA test.
- F
Representative ET reconstructions of mitochondria from a WT cell (left), a Mic10‐KO cell (center), and a Mic60‐KO cell (right). The OM is displayed in clear gray; the side of the IM that faces the matrix is shown in dark blue. The IM side that faces the IMS is shown in light blue.
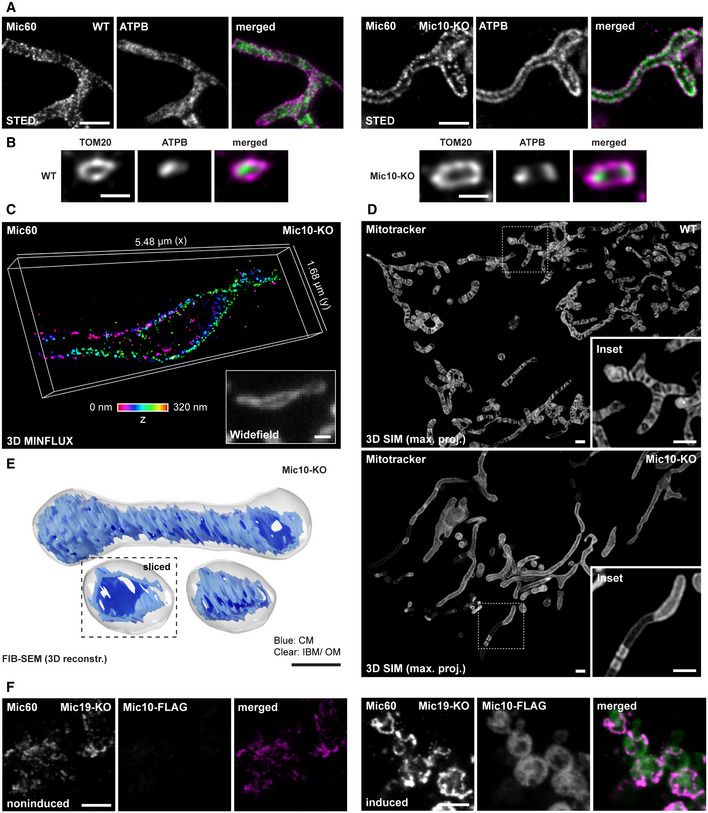
- A, B
Nanoscopy of mitochondria of WT and Mic10‐KO cells, as indicated. (A) Mitochondria were immunolabeled for Mic60 and ATPB and visualized by 2D STED nanoscopy. (B) Mitochondria were immunolabeled for TOM20 and ATPB and recorded with 3D STED nanoscopy. Image data were deconvolved. Depicted are cross sections of a mitochondrion (side view).
- C
3D MINFLUX nanoscopy. Mic10‐KO cells were immunolabeled for Mic60 using a directly labeled antibody. Colors encode depth information.
- D
3D SIM of living WT and Mic10‐KO cells. Cells were labeled with Mitotracker Green. Images show maximum intensity projections.
- E
FIB‐SEM of Mic10‐KO cells. Shown is a representative reconstructed mitochondrion. Dashed box: Orthoslice view on the smaller mitochondrion. The OM and IBM are displayed together in clear gray, the CM in is shown in blue.
- F
2D STED nanoscopy of mitochondria. Mic19‐KO cells were transfected with a plasmid for Mic10‐FLAG expression under the control of a tetracycline‐inducible promoter. Left panel: Mitochondria from noninduced cell. Right: Mitochondria from induced cell expressing Mic10‐FLAG.
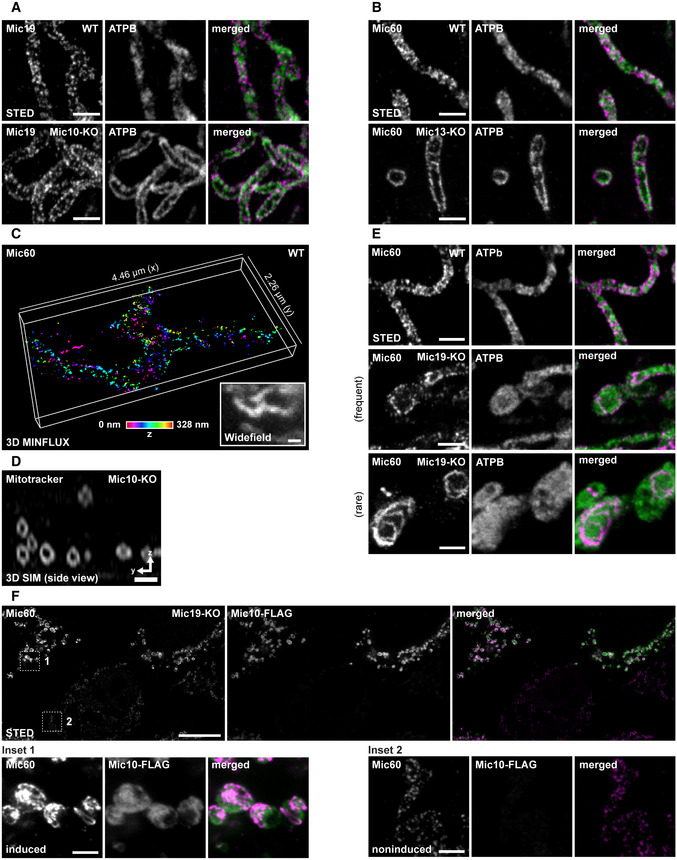
- A–C
Nanoscopy of mitochondria. (A) WT and Mic10‐KO cells were immunolabeled for Mic19 and ATPB and visualized by 2D STED nanoscopy. (B) WT and Mic13‐KO cells were immunolabeled for Mic60 and ATPB and recorded with 2D STED nanoscopy. (C) 3D MINFLUX nanoscopy of mitochondria. WT cells were immunolabeled for Mic60. Colors encode depth information.
- D
3D SIM of live cells. Mic10‐KO cells were labeled with Mitotracker Green. Images show a cross section (side view) through several mitochondria in a 3D SIM stack.
- E
STED nanoscopy of mitochondria. WT and Mic19‐KO cells were immunolabeled for Mic60 and ATPB and analyzed by STED nanoscopy.
- F
Nanoscopy of mitochondria. Mic19‐KO cells were transfected with a plasmid for Mic10‐FLAG expression under the control of a tetracycline promoter and induced with doxycycline for 24 h. Inset 1: mitochondria from a cell strongly expressing Mic10‐FLAG. Inset 2: mitochondria from a cell expressing virtually no Mic10‐FLAG.
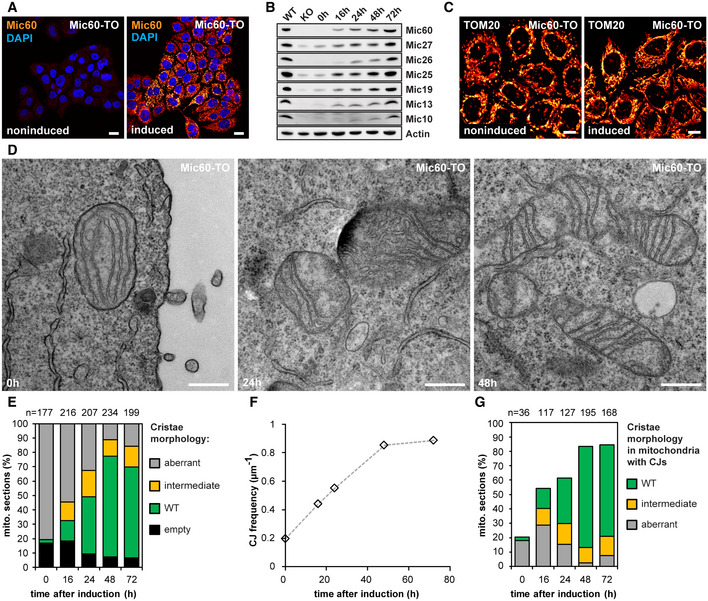
- A
Cells were immunolabeled for Mic60 and DNA and visualized by confocal fluorescence microscopy before and after induction of Mic60 expression for 48 h.
- B
Protein levels of MICOS proteins after Mic60 induction. Cell lysates were analyzed by Western blotting at the indicated time points.
- C
Recovery of mitochondrial networks upon Mic60 re‐expression. Cells were induced with doxycycline hyclate for 72 h, immunolabeled for TOM20, and visualized by confocal microscopy.
- D–G
TEM of Mic60‐TO cells before and after induction. (D) TEM recordings of Mic60‐TO cells at the indicated time points. (E) Quantification of the cristae morphology. (F) CJ frequency. The number of CJs on TEM recordings was normalized to the length of the OM. At least 90 mitochondrial sections were analyzed for each sample. (G) Quantification of the cristae morphology of Mic60‐TO cells. Only mitochondria exhibiting at least one CJ were analyzed.

- A, B
Live‐cell nanoscopy of Mic10‐TO cells. Cells expressing COX8A‐SNAP were labeled with SNAP‐cell SiR and recorded with STED nanoscopy. (A) Cristae architecture in noninduced cells. (B) Cristae architecture after Mic10 re‐expression (24 h induction with doxycycline). STED image data were deconvolved.
- C
STED nanoscopy of fixed Mic10‐TO cells. Cells were induced for 24 h and immunolabeled for Mic60 and Mic10‐FLAG. Upper row: Cell with weak Mic10 expression level. Lower row: Cell with strong Mic10 expression level.
- D–G
TEM of Mic10‐TO cells. (D) Cells induced for the indicated period of time were recorded with TEM. Arrow indicates an intermediately shaped crista. (E) Quantification of the cristae morphology. n: Number of mitochondrial sections. (F) CJ frequency in Mic10‐TO cells. Number of CJs was normalized to the length of the OM. The same sections were analyzed as in (E). (G) Diameter of CJs estimated on TEM recordings.

- A–C
Expression of Mic10‐FLAG upon induction of Mic10‐TO cells. (A) Cells were induced with doxycycline hyclate, immunolabeled for Mic10‐FLAG, stained with DAPI, and subsequently recorded by confocal fluorescence microscopy. (B) Composition of MICOS in induced Mic10‐TO cells. FLAG antibodies were used to pull down Mic10‐FLAG and interacting proteins from cell lysates. Mic60‐antibodies were used to pull down Mic60 and interacting proteins from cell lysates. Samples were analyzed by Western blotting. (C) Nanoscopy of Mic10‐TO cells. Cells were immunolabeled for Mic60. Images show 2D STED recordings of cells induced for the indicated time period. A dual‐color cutout of the same image (24 h) is shown in Fig 6C.
- D, E
Dual‐color STED nanoscopy of Mic10‐TO cells. Cells were induced for the indicated time periods and immunolabeled for Mic60 and Mic10‐FLAG or ATPB and Mic10‐FLAG, respectively. A larger single‐color overview including the same image for 0 h induction is shown in (C).

- A
FIB‐SEM of Mic10‐TO cells. Cells were induced for 0, 16, and 24 h. The representative reconstructions show mitochondria from noninduced, rescued, and intermediate cells, as indicated. The OM is shown together with the IBM in clear gray, the CM in blue.
- B
ET of Mic10‐TO cells. Mic10 expression was induced for 0 and 16 h. Shown are reconstructions of representative noninduced and almost completely rescued mitochondria. The OM is displayed in clear gray; the side of the IM that faces the matrix is shown in dark blue. The IM side that faces the IMS is shown in light blue.
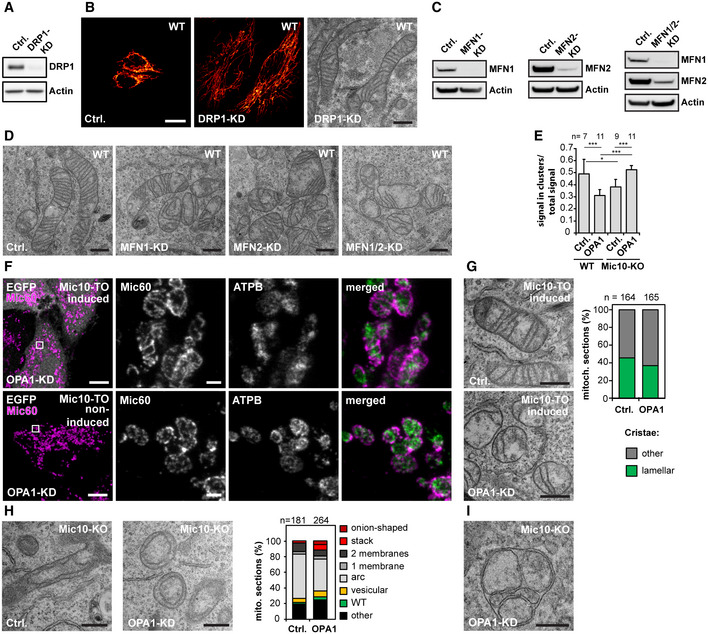
- A, B
Knockdown (KD) of DRP1 in HeLa cells. WT cells were transfected with a scrambled control (Ctrl.) or a siRNA plasmid against DRP1 for 7 days. (A) Cells were analyzed by Western blotting. (B) Ctrl. and DRP1‐KD cells were immunolabeled for TOM20 and analyzed by confocal fluorescence microscopy (left) or analyzed by TEM (right).
- C, D
KD of MFN1 and MFN2 in HeLa cells. WT cells were transfected with Ctrl. or siRNA pools against MFN1, MFN2, or both proteins together for 4 days. (C) Cells were analyzed by Western blotting. (D) Cells were analyzed by TEM.
- E
Mic60 cluster analysis of OPA1‐deficient HeLa cells. WT cells and Mic10‐KO cells were either transfected with a scrambled control (Ctrl.) or a siRNA pool against OPA1(OPA1‐KD). Cells were immunolabeled against Mic60 and recorded by 2D STED nanoscopy. Images were automatically segmented and the ratio of Mic60 signals in small distinct clusters (Mic60 assemblies ≤ 0.00225 μm2) to the total Mic60 signals was determined. Higher values indicate smaller Mic60 assemblies and lower values the formation of larger Mic60 assemblies. Bars indicate mean. Error bars indicate SD. For statistics, a one‐way ANOVA assay was performed. *P ≤ 0.05, ***P ≤ 0.001. n: Number of analyzed cells.
- F, G
Mic10 re‐expression after OPA1 depletion. Mic10‐TO cells were transfected with a scrambled control (Ctrl.) or a siRNA pool against OPA1 (OPA1‐KD) for 48 h. Afterward, Mic10‐FLAG expression was induced for 24 h. (F) Cells were immunolabeled for Mic60 and ATPB and recorded by STED nanoscopy. Left panel: Confocal overview images taken from induced cells (cytosolic reporter EGFP, upper panel) and noninduced cells (lower panel). Right: STED images from mitochondria from the areas indicated by rectangles. (G) TEM of Ctrl. and OPA1‐deficient Mic10‐TO cells after re‐expression of Mic10‐FLAG. Right: quantification of the cristae morphology. n: Number of mitochondrial sections analyzed.
- H, I
Knockdown of OPA1 in Mic10‐KO cells. (H) Left: Cells were transfected with a Ctrl. or an siRNA pool against OPA1 and analyzed by TEM. Right: Recordings were assigned to the indicated crista phenotypes. n: Number or mitochondrial sections analyzed. (I) Recording of a mitochondrion of a MIC10‐KO cell depleted of OPA1 exhibiting septa and septa junctions.

- A
Cell lysates were analyzed by Western blotting.
- B
TEM recordings from OPA1‐depleted WT and Mic60‐KO cells. Arrows point to a septum.
- C, D
Quantification of the cristae morphology of OPA1 deficient WT (C) and Mic60‐KO (D) cells. The number of CJs was normalized to the length of the OM (C). The number of septate mitochondria in Mic60‐KO cells was estimated (D).
- E, F
ET of mitochondria from OPA1‐KD cells. WT cells were transfected with a scrambled control (E) or siRNA pools against OPA1 (F) for 48 h. Reconstructions of representative mitochondria are displayed. The OM is displayed in clear gray; the side of the IM that faces the matrix is shown in dark blue. The IM side that faces the IMS is shown in light blue.
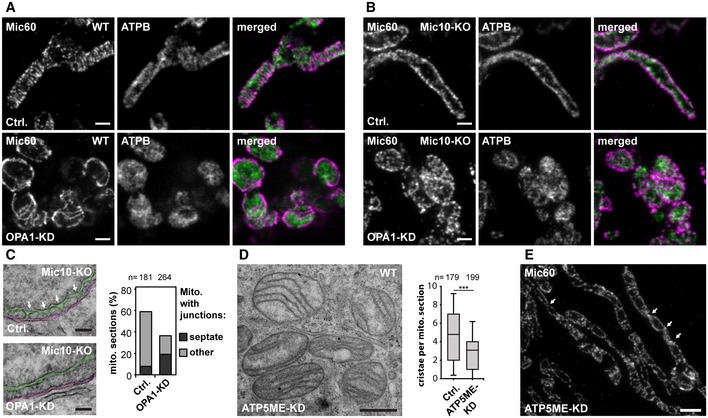
- A–C
WT and Mic10‐KO cells were transfected with a scrambled control (Ctrl.) or siRNA pools against OPA1 (OPA1‐KD) for 72 h. (A, B) STED nanoscopy of OPA1‐depleted WT (A) and Mic10‐KO (B) cells. Cells were immunolabeled for Mic60 and ATPB. (C) TEM of OPA1‐depleted Mic10‐KO cells. Left: Representative TEM recordings showing CJs marked by arrows in a control cell and a similar view for an OPA1‐KD cell. The CMs are colored in green and the OM and IBM together in magenta. Right: Quantification of mitochondria containing CJs or septa junctions. Sections that contained CJ‐like structures were analyzed. Of these, the number of sections exhibiting septa or cristae structures (other) was quantified.
- D, E
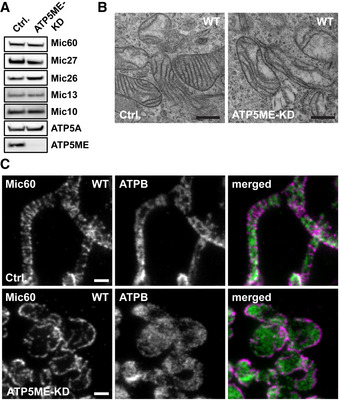
Depletion of ATP5ME in HeLa cells. Cells were transfected with a scrambled control or siRNA pools against ATP5ME for 4 days. (D) TEM recording (left) and quantification of the number of cristae per mitochondrial section (right). (E) Cells depleted of ATP5ME were immunolabeled for Mic60 and recorded with STED. The arrows point to crossing points of the opposite Mic60 distribution bands.
- A
Protein levels of ATP5ME, ATP5A, and MICOS proteins in cell lysates as analyzed by Western blotting.
- B
TEM recordings of ATP5ME‐depleted cells.
- C
STED nanoscopy of ATP5ME‐depleted cells. Cells were immunolabeled for Mic60 and ATPB.
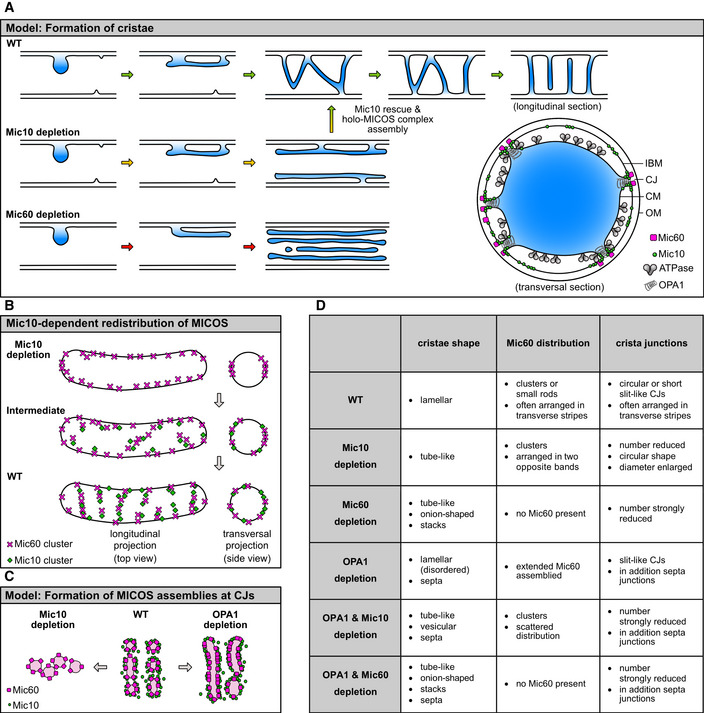
- A
Model for the formation of crista membranes (CMs) in WT, Mic10‐KO, and Mic60‐KO cells. Shown are cartoons of longitudinal cross sections of mitochondria. For details, see main text. Right lower corner: Model for the localizations of the key membrane‐shaping proteins involved in lamellar cristae formation at a lamellar crista in WT cells. Shown is a transversal cross section through a mitochondrial tubule (view on a single crista). The CM is displayed in blue.
- B
Illustration of the Mic60 redistribution upon re‐expression of Mic10 in Mic10‐depleted mitochondria.
- C
Model of the Mic10‐ and OPA1‐dependent formation of MICOS assemblies at CJs.
- D
Table summarizing the phenotypes that were observed in this study upon the depletion of key players in cristae formation.
Comment in
-
Resolving mitochondrial cristae: introducing a new model into the fold.EMBO J. 2020 Jul 15;39(14):e105714. doi: 10.15252/embj.2020105714. Epub 2020 Jun 22. EMBO J. 2020. PMID: 32567704 Free PMC article.
Similar articles
-
Multicolor 3D MINFLUX nanoscopy of mitochondrial MICOS proteins.Proc Natl Acad Sci U S A. 2020 Aug 25;117(34):20607-20614. doi: 10.1073/pnas.2009364117. Epub 2020 Aug 11. Proc Natl Acad Sci U S A. 2020. PMID: 32788360 Free PMC article.
-
Mitochondrial contact site and cristae organizing system.Curr Opin Cell Biol. 2016 Aug;41:33-42. doi: 10.1016/j.ceb.2016.03.013. Epub 2016 Apr 7. Curr Opin Cell Biol. 2016. PMID: 27062547 Review.
-
Mic10, a Core Subunit of the Mitochondrial Contact Site and Cristae Organizing System, Interacts with the Dimeric F1Fo-ATP Synthase.J Mol Biol. 2017 Apr 21;429(8):1162-1170. doi: 10.1016/j.jmb.2017.03.006. Epub 2017 Mar 15. J Mol Biol. 2017. PMID: 28315355
-
OPA1 functionally interacts with MIC60 but is dispensable for crista junction formation.FEBS Lett. 2016 Oct;590(19):3309-3322. doi: 10.1002/1873-3468.12384. Epub 2016 Sep 18. FEBS Lett. 2016. PMID: 27587279
-
Mitochondrial Cristae Morphology Reflecting Metabolism, Superoxide Formation, Redox Homeostasis, and Pathology.Antioxid Redox Signal. 2023 Oct;39(10-12):635-683. doi: 10.1089/ars.2022.0173. Epub 2023 Apr 11. Antioxid Redox Signal. 2023. PMID: 36793196 Free PMC article. Review.
Cited by
-
Nanoscopic quantification of sub-mitochondrial morphology, mitophagy and mitochondrial dynamics in living cells derived from patients with mitochondrial diseases.J Nanobiotechnology. 2021 May 13;19(1):136. doi: 10.1186/s12951-021-00882-9. J Nanobiotechnology. 2021. PMID: 33985528 Free PMC article.
-
Maintenance of complex I and its supercomplexes by NDUF-11 is essential for mitochondrial structure, function and health.J Cell Sci. 2021 Jul 1;134(13):jcs258399. doi: 10.1242/jcs.258399. Epub 2021 Jul 9. J Cell Sci. 2021. PMID: 34106255 Free PMC article.
-
Prohibitins: A Key Link between Mitochondria and Nervous System Diseases.Oxid Med Cell Longev. 2022 Jul 8;2022:7494863. doi: 10.1155/2022/7494863. eCollection 2022. Oxid Med Cell Longev. 2022. PMID: 35847581 Free PMC article. Review.
-
Pathways shaping the mitochondrial inner membrane.Open Biol. 2021 Dec;11(12):210238. doi: 10.1098/rsob.210238. Epub 2021 Dec 1. Open Biol. 2021. PMID: 34847778 Free PMC article. Review.
-
Morphological principles of neuronal mitochondria.J Comp Neurol. 2022 Apr;530(6):886-902. doi: 10.1002/cne.25254. Epub 2021 Nov 1. J Comp Neurol. 2022. PMID: 34608995 Free PMC article.
References
-
- Alexander C, Votruba M, Pesch UE, Thiselton DL, Mayer S, Moore A, Rodriguez M, Kellner U, Leo‐Kottler B, Auburger G et al (2000) OPA1, encoding a dynamin‐related GTPase, is mutated in autosomal dominant optic atrophy linked to chromosome 3q28. Nat Genet 26: 211–215 - PubMed
Publication types
MeSH terms
Substances
Grants and funding
LinkOut - more resources
Full Text Sources
Molecular Biology Databases
Research Materials
