

Evidence for transmission of COVID-19 prior to symptom onset
- PMID: 32568070
- PMCID: PMC7386904
- DOI: 10.7554/eLife.57149
Evidence for transmission of COVID-19 prior to symptom onset
Abstract
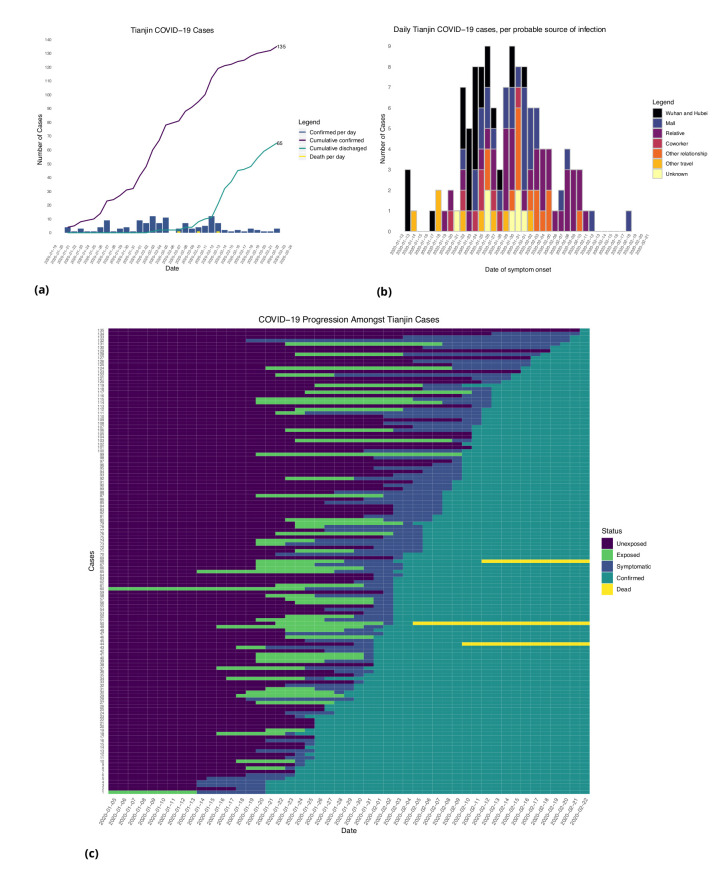
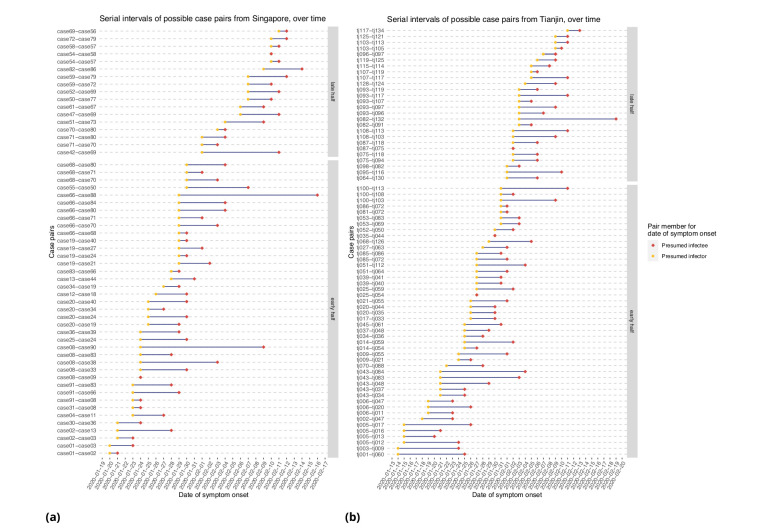
We collated contact tracing data from COVID-19 clusters in Singapore and Tianjin, China and estimated the extent of pre-symptomatic transmission by estimating incubation periods and serial intervals. The mean incubation periods accounting for intermediate cases were 4.91 days (95%CI 4.35, 5.69) and 7.54 (95%CI 6.76, 8.56) days for Singapore and Tianjin, respectively. The mean serial interval was 4.17 (95%CI 2.44, 5.89) and 4.31 (95%CI 2.91, 5.72) days (Singapore, Tianjin). The serial intervals are shorter than incubation periods, suggesting that pre-symptomatic transmission may occur in a large proportion of transmission events (0.4-0.5 in Singapore and 0.6-0.8 in Tianjin, in our analysis with intermediate cases, and more without intermediates). Given the evidence for pre-symptomatic transmission, it is vital that even individuals who appear healthy abide by public health measures to control COVID-19.
Keywords: COVID19; Sars-CoV-2; coronavirus; epidemiology; global health; incubation; serial interval; transmission.
Plain language summary
The first cases of COVID-19 were identified in Wuhan, a city in Central China, in December 2019. The virus quickly spread within the country and then across the globe. By the third week in January, the first cases were confirmed in Tianjin, a city in Northern China, and in Singapore, a city country in Southeast Asia. By late February, Tianjin had 135 cases and Singapore had 93 cases. In both cities, public health officials immediately began identifying and quarantining the contacts of infected people. The information collected in Tianjin and Singapore about COVID-19 is very useful for scientists. It makes it possible to determine the disease’s incubation period, which is how long it takes to develop symptoms after virus exposure. It can also show how many days pass between an infected person developing symptoms and a person they infect developing symptoms. This period is called the serial interval. Scientists use this information to determine whether individuals infect others before showing symptoms themselves and how often this occurs. Using data from Tianjin and Singapore, Tindale, Stockdale et al. now estimate the incubation period for COVID-19 is between five and eight days and the serial interval is about four days. About 40% to 80% of the novel coronavirus transmission occurs two to four days before an infected person has symptoms. This transmission from apparently healthy individuals means that staying home when symptomatic is not enough to control the spread of COVID-19. Instead, broad-scale social distancing measures are necessary. Understanding how COVID-19 spreads can help public health officials determine how to best contain the virus and stop the outbreak. The new data suggest that public health measures aimed at preventing asymptomatic transmission are essential. This means that even people who appear healthy need to comply with preventive measures like mask use and social distancing.
© 2020, Tindale et al.
Conflict of interest statement
LT, JS, MC, EG, WL, MS, LZ, DC No competing interests declared, JW, CC Reviewing editor, eLife
Figures


References
-
- Abbott S, Hellewell J, Munday J, Funk S, CMMID nCoV working group The transmissibility of novel coronavirus in the early stages of the 2019-20 outbreak in Wuhan: exploring initial point-source exposure sizes and durations using scenario analysis. Wellcome Open Research. 2020;5:17. doi: 10.12688/wellcomeopenres.15718.1. - DOI - PMC - PubMed
-
- Anderson RM, Fraser C, Ghani AC, Donnelly CA, Riley S, Ferguson NM, Leung GM, Lam TH, Hedley AJ. Epidemiology, transmission dynamics and control of SARS: the 2002–2003 epidemic. Philosophical Transactions of the Royal Society of London. Series B: Biological Sciences. 2004;359:1091–1105. doi: 10.1098/rstb.2004.1490. - DOI - PMC - PubMed
-
- Anderson-Bergman C. icenReg: regression models for interval censored data in R. Journal of Statistical Software. 2017;81:i12. doi: 10.18637/jss.v081.i12. - DOI
-
- Arons MM, Hatfield KM, Reddy SC, Kimball A, James A, Jacobs JR, Taylor J, Spicer K, Bardossy AC, Oakley LP, Tanwar S, Dyal JW, Harney J, Chisty Z, Bell JM, Methner M, Paul P, Carlson CM, McLaughlin HP, Thornburg N, Tong S, Tamin A, Tao Y, Uehara A, Harcourt J, Clark S, Brostrom-Smith C, Page LC, Kay M, Lewis J, Montgomery P, Stone ND, Clark TA, Honein MA, Duchin JS, Jernigan JA, Public Health–Seattle and King County and CDC COVID-19 Investigation Team Presymptomatic SARS-CoV-2 infections and transmission in a skilled nursing facility. New England Journal of Medicine. 2020;382:2081–2090. doi: 10.1056/NEJMoa2008457. - DOI - PMC - PubMed
-
- Backer JA, Klinkenberg D, Wallinga J. Incubation period of 2019 novel coronavirus (2019-nCoV) infections among travellers from Wuhan, China, 20-28 January 2020. Euro Surveillance : Bulletin Europeen Sur Les Maladies Transmissibles = European Communicable Disease Bulletin. 2019;25:2000062. doi: 10.2807/1560-7917.ES.2020.25.5.2000062. - DOI - PMC - PubMed
Publication types
MeSH terms
Grants and funding
LinkOut - more resources
Full Text Sources
Miscellaneous
