

A mechanism-based parameterisation scheme to investigate the association between transmission rate of COVID-19 and meteorological factors on plains in China
- PMID: 32569904
- PMCID: PMC7301117
- DOI: 10.1016/j.scitotenv.2020.140348
A mechanism-based parameterisation scheme to investigate the association between transmission rate of COVID-19 and meteorological factors on plains in China
Abstract
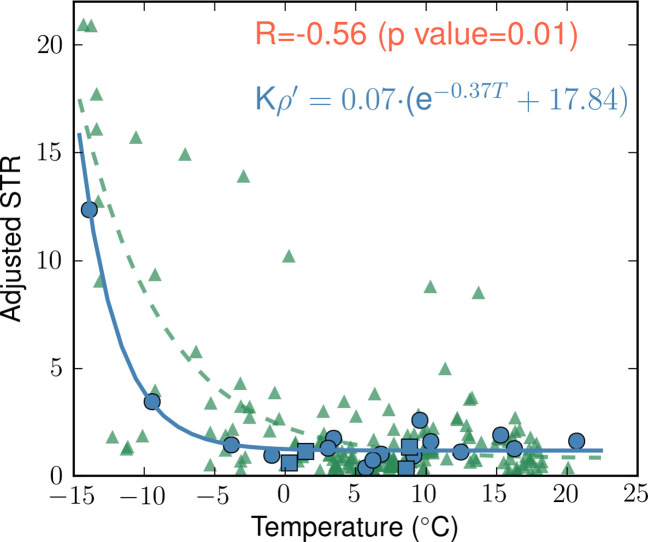
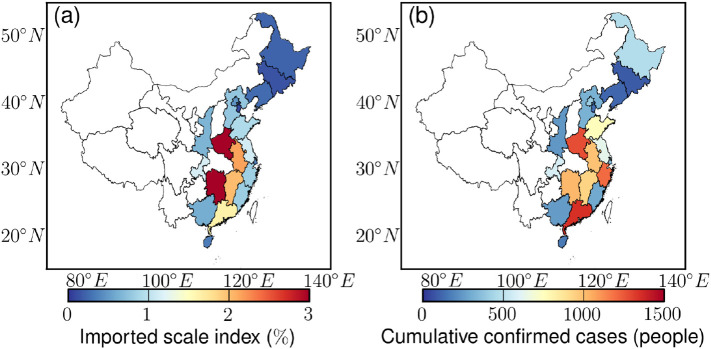
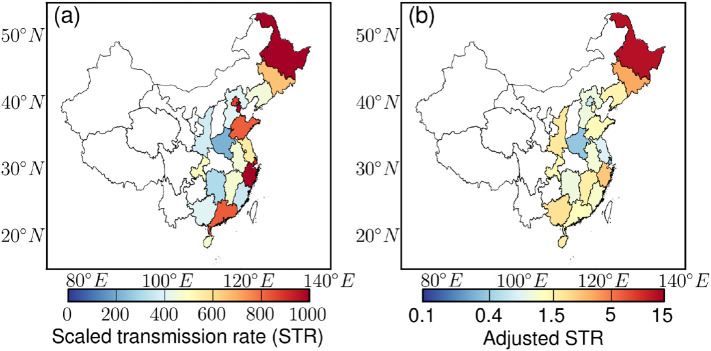
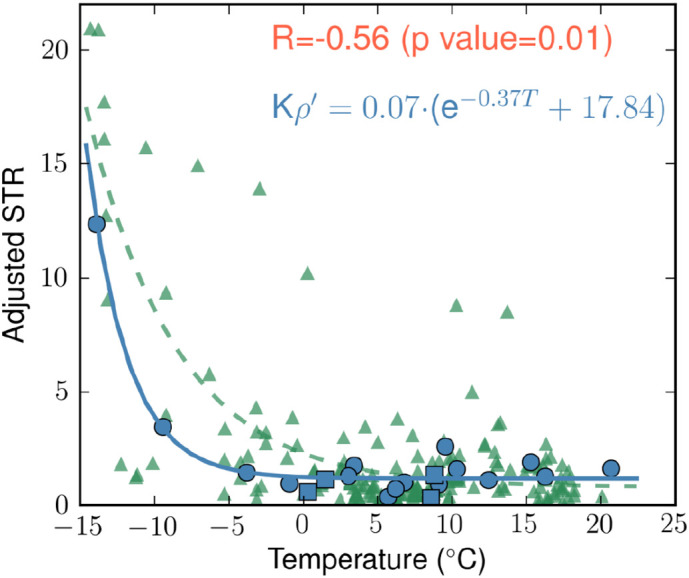
The novel coronavirus disease 2019 (COVID-19), which first emerged in Hubei province, China, has become a pandemic. However, data regarding the effects of meteorological factors on its transmission are limited and inconsistent. A mechanism-based parameterisation scheme was developed to investigate the association between the scaled transmission rate (STR) of COVID-19 and the meteorological parameters in 20 provinces/municipalities located on the plains in China. We obtained information on the scale of population migrated from Wuhan, the world epicentre of the COVID-19 outbreak, into the study provinces/municipalities using mobile-phone positioning system and big data techniques. The highest STRs were found in densely populated metropolitan areas and in cold provinces located in north-eastern China. Population density had a non-linear relationship with disease spread (linearity index, 0.9). Among various meteorological factors, only temperature was significantly associated with the STR after controlling for the effect of population density. A negative and exponential relationship was identified between the transmission rate and the temperature (correlation coefficient, -0.56; 99% confidence level). The STR increased substantially as the temperature in north-eastern China decreased below 0 °C (the STR ranged from 3.5 to 12.3 when the temperature was between -9.41 °C and -13.87 °C), whilst the STR showed less temperature dependence in the study areas with temperate weather conditions (the STR was 1.21 ± 0.57 when the temperature was above 0 °C). Therefore, a higher population density was linearly whereas a lower temperature (<0 °C) was exponentially associated with an increased transmission rate of COVID-19. These findings suggest that the mitigation of COVID-19 spread in densely populated and/or cold regions will be a great challenge.
Keywords: COVID-19; Imported scale; Meteorology; Population density; Temperature.
Copyright © 2020 Elsevier B.V. All rights reserved.
Conflict of interest statement
Declaration of competing interest The authors declare that they have no known competing financial interests or personal relationships that could have appeared to influence the work reported in this paper.
Figures
Similar articles
-
An analysis of the domestic resumption of social production and life under the COVID-19 epidemic.PLoS One. 2020 Jul 22;15(7):e0236387. doi: 10.1371/journal.pone.0236387. eCollection 2020. PLoS One. 2020. PMID: 32697812 Free PMC article.
-
Region-specific air pollutants and meteorological parameters influence COVID-19: A study from mainland China.Ecotoxicol Environ Saf. 2020 Nov;204:111035. doi: 10.1016/j.ecoenv.2020.111035. Epub 2020 Aug 5. Ecotoxicol Environ Saf. 2020. PMID: 32768746 Free PMC article.
-
Impact of meteorological factors on the COVID-19 transmission: A multi-city study in China.Sci Total Environ. 2020 Jul 15;726:138513. doi: 10.1016/j.scitotenv.2020.138513. Epub 2020 Apr 9. Sci Total Environ. 2020. PMID: 32304942 Free PMC article.
-
COVID-19-A Novel Zoonotic Disease: A Review of the Disease, the Virus, and Public Health Measures.Asia Pac J Public Health. 2020 May;32(4):145-153. doi: 10.1177/1010539520931326. Epub 2020 May 30. Asia Pac J Public Health. 2020. PMID: 32475144 Review.
-
COVID-19: The first documented coronavirus pandemic in history.Biomed J. 2020 Aug;43(4):328-333. doi: 10.1016/j.bj.2020.04.007. Epub 2020 May 5. Biomed J. 2020. PMID: 32387617 Free PMC article. Review.
Cited by
-
Is coronavirus disease (COVID-19) seasonal? A critical analysis of empirical and epidemiological studies at global and local scales.Environ Res. 2021 May;196:110972. doi: 10.1016/j.envres.2021.110972. Epub 2021 Mar 9. Environ Res. 2021. PMID: 33705770 Free PMC article. Review.
-
Health impacts of daily weather fluctuations: Empirical evidence from COVID-19 in U.S. counties.J Environ Manage. 2021 Aug 1;291:112662. doi: 10.1016/j.jenvman.2021.112662. Epub 2021 Apr 24. J Environ Manage. 2021. PMID: 33930636 Free PMC article.
-
Multi-feature SEIR model for epidemic analysis and vaccine prioritization.PLoS One. 2024 Mar 1;19(3):e0298932. doi: 10.1371/journal.pone.0298932. eCollection 2024. PLoS One. 2024. PMID: 38427619 Free PMC article.
-
Random forest regression analysis on combined role of meteorological indicators in disease dissemination in an Indian city: A case study of New Delhi.Urban Clim. 2021 Mar;36:100780. doi: 10.1016/j.uclim.2021.100780. Epub 2021 Jan 22. Urban Clim. 2021. PMID: 33520641 Free PMC article.
-
COVID-19 and the emerging research trends in environmental studies: a bibliometric evaluation.Environ Sci Pollut Res Int. 2021 Apr;28(14):16913-16924. doi: 10.1007/s11356-021-13098-z. Epub 2021 Feb 24. Environ Sci Pollut Res Int. 2021. PMID: 33625710 Free PMC article. Review.
References
MeSH terms
LinkOut - more resources
Full Text Sources
