. 2020 Jun 22;12(12):11364-11385.
doi: 10.18632/aging.103174. Epub 2020 Jun 22.

Sirt1 gene confers Adriamycin resistance in DLBCL via activating the PCG-1α mitochondrial metabolic pathway

Affiliations

Sirt1 gene confers Adriamycin resistance in DLBCL via activating the PCG-1α mitochondrial metabolic pathway

Zhen Zhou et al. Aging (Albany NY). .

Abstract

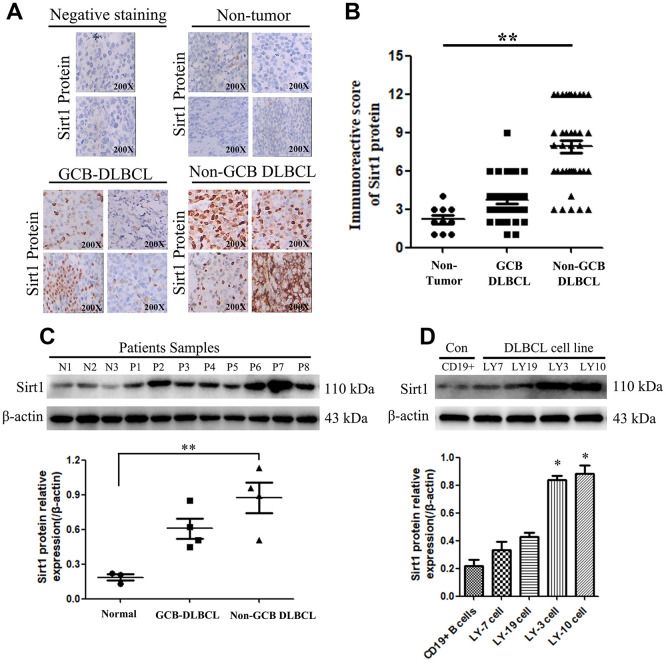
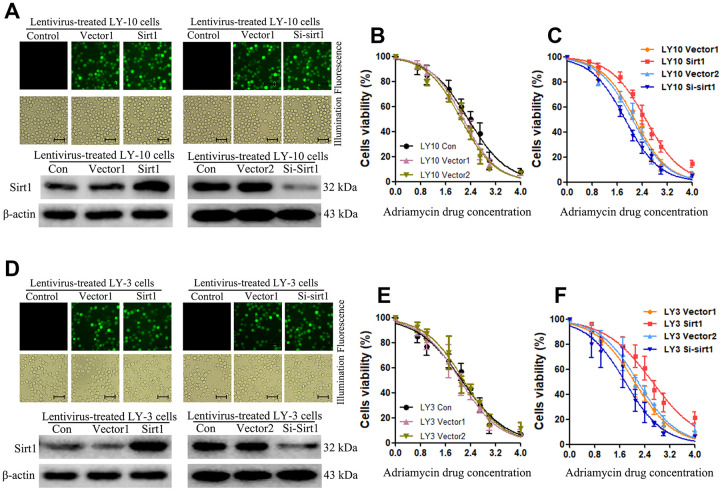
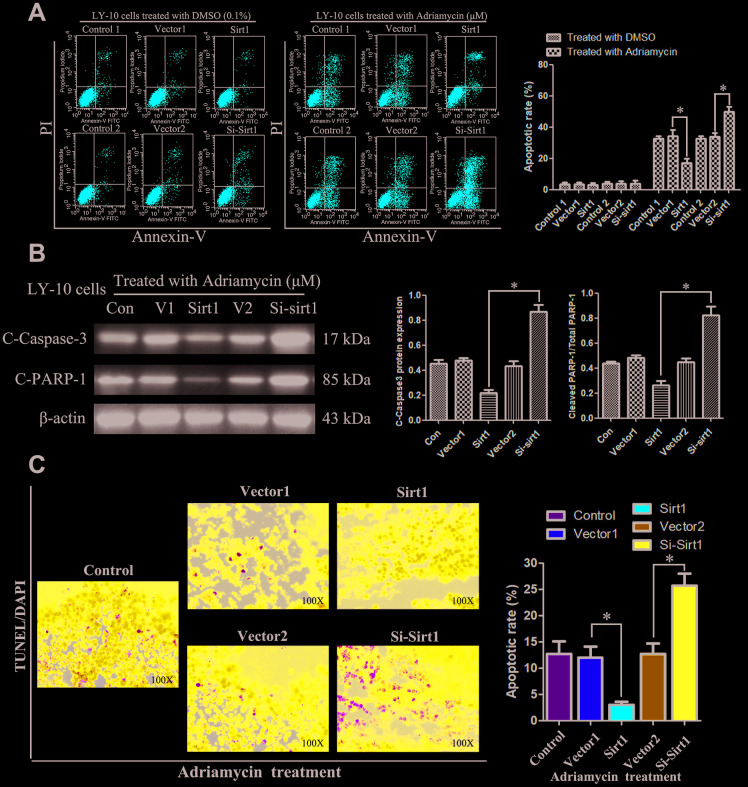
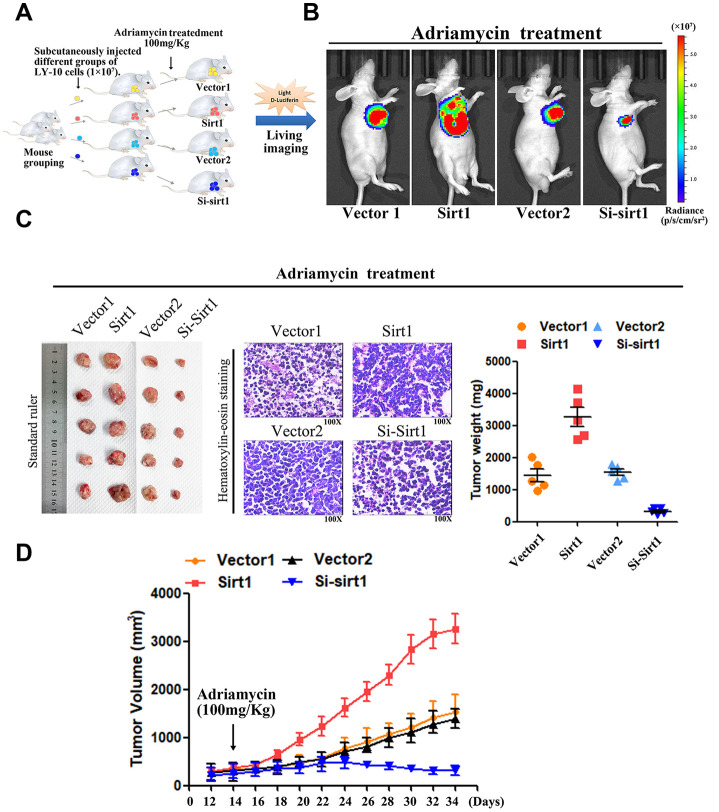
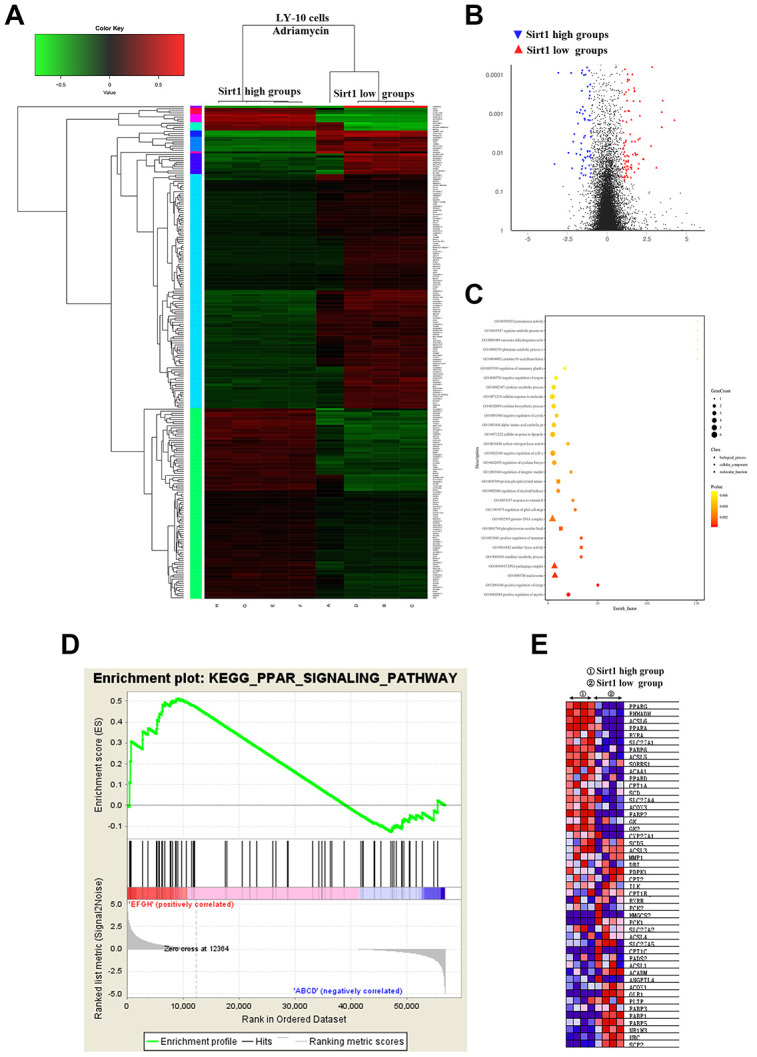
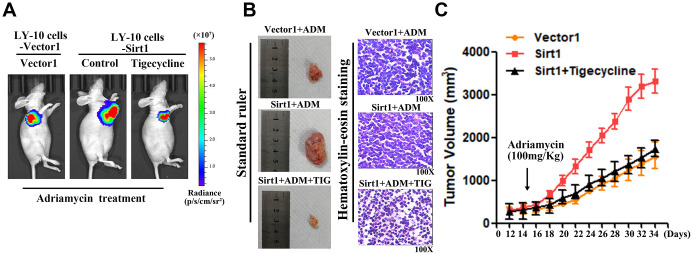
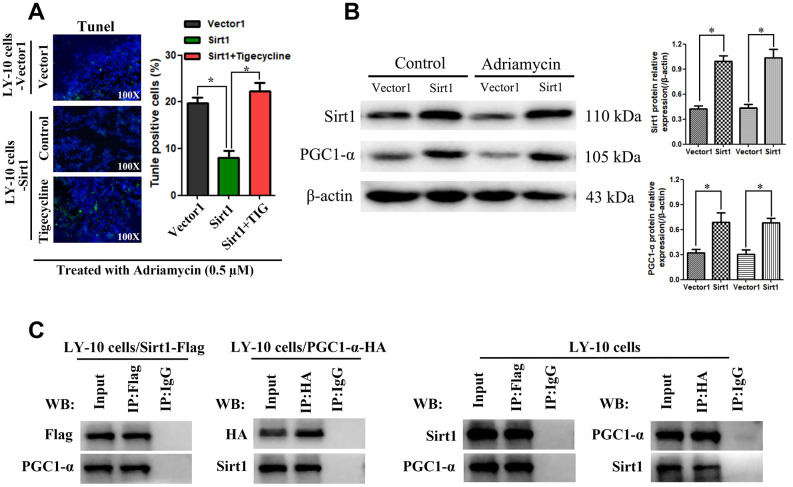
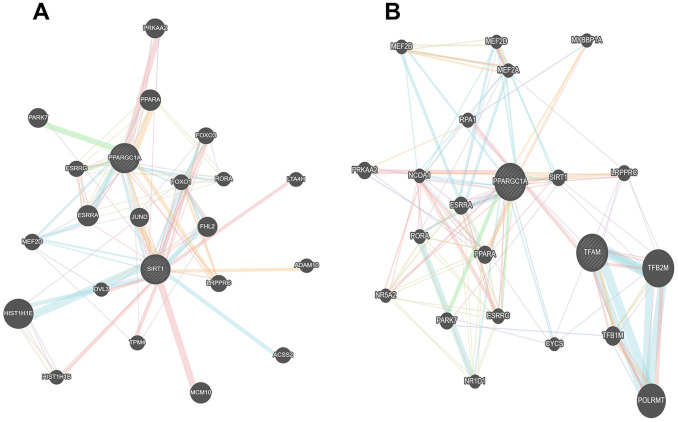
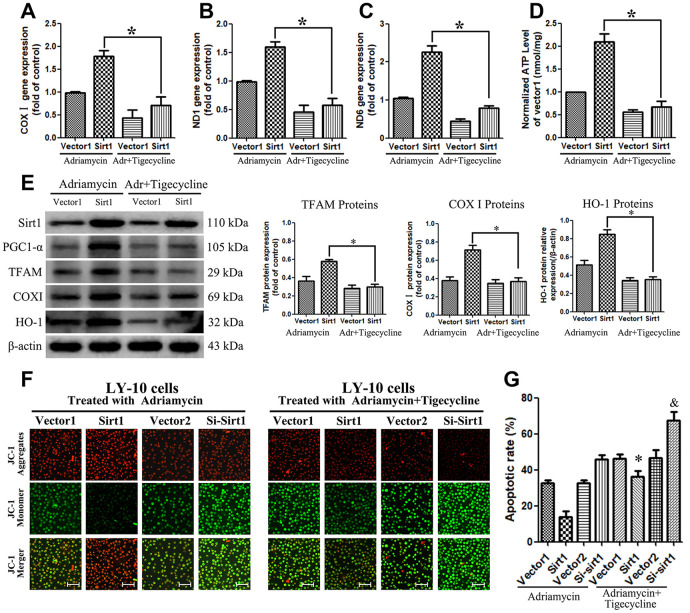
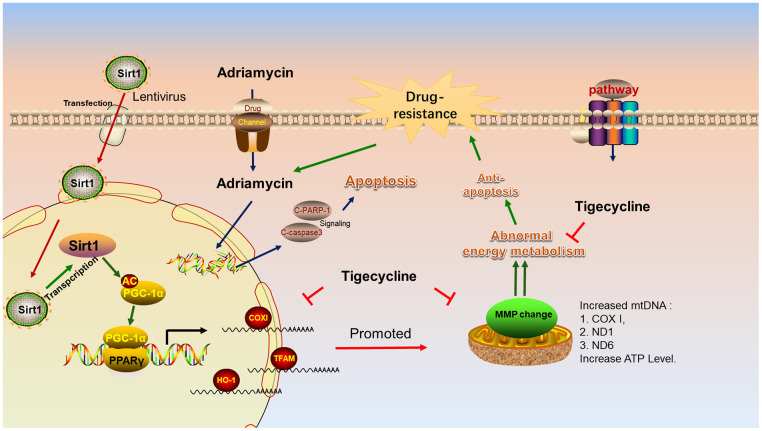
Sirt1 is closely related to cells aging, and Sirt1 also plays an important role in diffuse large B-cell lymphoma (DLBCL). However, its mechanism remains unclear. Therefore, we investigated the mechanism of Sirt1 mediated drug-resistance in DLBCL, while the recombinant lentivirus was used to regulate Sirt1 gene expression in DLBCL cell lines. Subsequently, the effect of Sirt1 on DLBCL resistance to Adriamycin was analyzed in vitro. The results show that Sirt1 overexpression confers Adriamycin resistance in DLBCL cell lines. However, inhibition of Sirt1 sensitized DLBCL cell lines to Adriamycin cytotoxicity. Additionally, tumor-bearing mice were used to verify that Sirt1 overexpression confers Adriamycin resistance in vivo after chemotherapy. In addition, we used second-generation sequencing technology and bioinformatics analysis to find that Sirt1 mediated drug-resistance is related to the Peroxisome proliferator-activated receptor (PPAR) signaling pathway, especially to PGC-1α. Interestingly, the mitochondrial energy inhibitor, tigecycline, combined with Adriamycin reversed the cellular resistance caused by Sirt1 overexpression in vivo. Moreover, western blotting and CO-IP assay reconfirmed that Sirt1-mediated drug-resistance is associated with the increased expression of PGC1-α, which induce mitochondrial biogenesis. In summary, this study confirms that Sirt1 is a potential target for DLBCL treatment.

Keywords: Adriamycin; DLBCL; PCG-1α; Sirt1; chemotherapy resistance.


Conflict of interest statement

CONFLICTS OF INTEREST: The authors declare that there are no conflicts of interest.

Figures

Figure 1
Figure 1
Sirt1 protein is overexpression in DLBCL patients, especially in Non-GCB DLBCL tissues. (A) Immunohistochemistry (IHC) staining indicates that Sirt1 protein expression is upregulated in DLBCL patients, compared with that of normal lymph nodes (non-tumor). A representative sample (GCB-DLBCL: 36; Non-GCB DLBCL: 38; Normal: 10) is shown (200 ×). (B) Scatter diagrams of Sirt1 protein expression in DLBCL patients indicated using immunoreactive scores. (C) Western blotting analysis of Sirt1 expression in three normal lymph node (non-tumor), four primary GCB-DLBC tissues (p1, p2, p3 and p4) and four primary Non-GCB DLBCL tissues (p5, p6, p7 and p8). (D) Western blotting was used to detect Sirt1 expression in CD19+ purified peripheral blood from normal B cells, GCB-DLBCL cell lines (LY7 and LY19 cells), Non-GCB DLBCL cell lines (LY3 and LY10 cells) and normal lymph nodes (non-tumor); Each sample was normalized to β-actin expression. All experiments were performed in triplicate. * indicates p<0.05 against control group.
Figure 2
Figure 2
Upregulation of Sirt1 expression confers resistance to Adriamycin-induced apoptosis of Non-GCB DLBCL cells. (A) The corresponding lentivirus was used to treat each group of LY-10 cells. Positive lentivirus mediated Sirt1 transduction (>95%) was observed under fluorescence microscopy (Scale bars: 100μm). (B, C) CCK-8 assay was used to detect cell viability. (D) The corresponding lentivirus was used to treat each group of LY-3 cells. Positive lentivirus mediated Sirt1 transduction (>95%) was observed under fluorescence microscopy (Scale bars: 100μm). (E, F) CCK-8 assay was used to detect cell viability. All experiments were performed in triplicate. * indicates p<0.05 against control group.
Figure 3
Figure 3
Silencing Sirt1 sensitizes LY-10 cells to apoptosis induced by Adriamycin in vitro. (A) LY-10 cells were treated with Adriamycin (0.5 μM) and DMSO (0.1%) for 24 hours, and the apoptotic rate was analyzed using flow cytometry. The graphs show the number of apoptotic cells in each group of cells. The apoptotic cells refer to the sum of the upper and lower right quadrant cells. Data were analyzed using Prism v5.0 (GraphPad Software, San Diego, CA, USA). (B) LY-10 cells treated with Adriamycin (0.5 μM) for 24 hours. The protein expression of cleaved-caspase3 and cleaved-PARP were detected using western blotting. The western blotting bands were quantified using Quantity One software. Each sample was normalized to the expression of β-actin. All experiments were performed in triplicate. * p<0.05. (C) LY-10 cells treated with Adriamycin (0.5 μM) for 24 hours. TUNEL staining demonstrating the expression of TUNEL-positive cells in the LY-10 cells is shown (200 ×).
Figure 4
Figure 4
Upregulation of Sirt1 conferres Adriamycin resistance of DLBCL cells in vivo. (A) LY-10 cells (1×10⁷ cells) were subcutaneously inoculated into the flanks of nude mice to establish a xenograft mouse model of DLBCL. The mice were treated twice a week with 100 mg/kg Adriamycin when the tumors were palpable (day 12). (B) After 4 weeks of treatment with Adriamycin, tumor growth was observed through live imaging of each group of mice. Representative images of tumor-bearing mouse cells treated with Adriamycin (100 mg/kg). (C) Tumors from all mice in the indicate cell together with the mean tumor weights. Hematoxylin-eosin staining method was used to observe microscopic images of tumor cells. A representative sample (Vector1: 4; Sirt1: 4; Vector2: 4; Si-sirt1: 4) is shown (200 ×). (D) Tumor volumes were measured on the days indicated. Data were analyzed using Prism v5.0 (GraphPad Software, San Diego, CA, USA). Each bar represents the mean ± SD of three independent experiments. * p<0.05.
Figure 5
Figure 5
Differences in genes and pathways analyzed using bioinformatics in the Sirt1-high and Sirt1-low group of LY-10 cells. (A) High-throughput sequencing was used to detect differences in the transcriptional levels of LY-10 cells in the Sirt1-high and Sirt1-low groups. The cluster of differentially expressed genes between the Sirt1-high and Sirt1-low groups. (B) The volcano map of transcriptome sequencing results. (C) Enrichment plots of the KEGG pathway analysis with the highest score and lowest p value for the Enrichment score. (D) The PPAR signaling pathway was analyzed using GSEA assays in the Sirt1-high and Sirt1-low groups. (E) Cytokines associated with the PPAR signaling pathway in the Sirt1-high and Sirt1-low groups.
Figure 6
Figure 6
The mitochondrial pathway is required for Sirt1-induced chemoresistance in vivo. (A) Mice were treated with Adriamycin (100 mg/kg), twice a week, and tigecycline (100 mg/kg), once a day. After 4 weeks of treatment tumor growth was observed through live imaging and representative images of the tumors in each group of mice. (B, C) Tumors from all mice in the indicate cell together with the mean tumor volumes. Hematoxylin-eosin staining method was used to observe microscopic images of tumor cells. A representative sample (Vector1: 4; Sirt1: 4; Vector2: 4; Si-sirt1: 4) is shown (200 ×). (C) Tumor volumes were measured on the days indicated. All experiments were performed in triplicate. * p<0.05, ** p<0.01.
Figure 7
Figure 7
Potential interaction mechanism of Sirt1 with PGC1-α in vitro. (A) IHC staining demonstrating the expression of TUNEL-positive cells in the indicated tissues is shown (200×). Each bar represents the mean ± SD of three independent experiments. * p<0.05. (B) LY-10 cells were treated with Adriamycin (0.5 μM) for 24 hours. The protein expression of Sirt1, PGC1-α and Ace-PGC1-α were detected using western blotting. Western blotting bands were quantified using Quantity One software. Each sample was normalized to the expression of β-actin. All experiments were performed in triplicate. * p<0.05, ** p<0.01. (C) Immunoprecipitation assay indicating that Sirt1 interacts with PGC1-α in LY-10 cells.
Figure 8
Figure 8
The association networks between Sirt1 and PGC1-α gene. (A, B) The association networks between Sirt1 and PGC1-α gene was searched for in the GeneMANIA database.
Figure 9
Figure 9
Blocking the PGC1-α-mitochondrial pathway can counteract the resistance of LY-10 cells to Adriamycin caused by the overexpression of Sirt1. (AD) LY-10 cells were treated with Adriamycin (0.5 μM) and Adriamycin (0.5 μM) + Tigecycline (50 μM) for 24 hours and the mitochondrial genes (COX I, ND1 and ND6) were detected using real-time PCR assays. Furthermore, the relative content of ATP was detected using ATP Kit assays on a microplate. (E) The protein expression of Sirt1, PGC1-α, TFAM, COX I and HO-1 were detected using western blotting. Western blotting bands were quantified using Quantity One software. All experiments were performed in triplicate. * p<0.05, ** p<0.01. (F) Changes in mitochondrial transmembrane potential in different groups of LY-10 cells. The representative images show JC-1 aggregates, JC-1 monomers and merged images of both (Scale bars: 100μm). (G) LY-10 cells were treated with Adriamycin (0.5 μM) and Adriamycin (0.5 μM) + Tigecycline (50 μM) for 24 hours, and the apoptosis rate was detected using flow cytometry. Graphs show the number of apoptotic cells in each group of cells. Data were analyzed using Prism v5.0 (GraphPad Software, San Diego, CA, USA). All experiments were performed in triplicate. * Sirt1 (Adriamycin) group compared with Sirt1 (Adriamycin+Tigecycline) group (p<0.05). & Si-Sirt1 (Adriamycin) group compared with Si-Sirt1 (Adriamycin+Tigecycline) group (p<0.01).
Figure 10
Figure 10
Schematic representation of the mechanism of Sirt1 associated Adriamycin-resistance in DLBCL cells. Mechanistic diagram of the Sirt1--PGC1-α mitochondrial pathway that mediates the chemical resistance of DLBCL cells and blocks the mitochondrial energy metabolism pathway in overcoming Sirt1-mediated drug-resistance.

References

    1. Sha C, Barrans S, Cucco F, Bentley MA, Care MA, Cummin T, Kennedy H, Thompson JS, Uddin R, Worrillow L, Chalkley R, van Hoppe M, Ahmed S, et al.. Molecular high-grade B-cell lymphoma: defining a poor-risk group that requires different approaches to therapy. J Clin Oncol. 2019; 37:202–12. 10.1200/JCO.18.01314 - DOI - PMC - PubMed
    1. Chapuy B, Stewart C, Dunford AJ, Kim J, Kamburov A, Redd RA, Lawrence MS, Roemer MG, Li AJ, Ziepert M, Staiger AM, Wala JA, Ducar MD, et al.. Molecular subtypes of diffuse large B cell lymphoma are associated with distinct pathogenic mechanisms and outcomes. Nat Med. 2018; 24:679–90. 10.1038/s41591-018-0016-8 - DOI - PMC - PubMed
    1. Arthur SE, Jiang A, Grande BM, Alcaide M, Cojocaru R, Rushton CK, Mottok A, Hilton LK, Lat PK, Zhao EY, Culibrk L, Ennishi D, Jessa S, et al.. Genome-wide discovery of somatic regulatory variants in diffuse large B-cell lymphoma. Nat Commun. 2018; 9:4001. 10.1038/s41467-018-06354-3 - DOI - PMC - PubMed
    1. Nowakowski GS, Blum KA, Kahl BS, Friedberg JW, Baizer L, Little RF, Maloney DG, Sehn LH, Williams ME, Wilson WH, Leonard JP, Smith SM. Beyond RCHOP: a blueprint for diffuse large B cell lymphoma research. J Natl Cancer Inst. 2016; 108:djw257. 10.1093/jnci/djw257 - DOI - PMC - PubMed
    1. Staiger AM, Ziepert M, Horn H, Scott DW, Barth TF, Bernd HW, Feller AC, Klapper W, Szczepanowski M, Hummel M, Stein H, Lenze D, Hansmann ML, et al., and German High-Grade Lymphoma Study Group. Clinical Impact of the Cell-of-Origin Classification and the MYC/ BCL2 Dual Expresser Status in Diffuse Large B-Cell Lymphoma Treated Within Prospective Clinical Trials of the German High-Grade Non-Hodgkin’s Lymphoma Study Group. J Clin Oncol. 2017; 35:2515–26. 10.1200/JCO.2016.70.3660 - DOI - PubMed

Publication types

MeSH terms

Substances

LinkOut - more resources