

Lung Ultrasound in COVID-19 Pneumonia: Correlations with Chest CT on Hospital admission
- PMID: 32570265
- PMCID: PMC7360505
- DOI: 10.1159/000509223
Lung Ultrasound in COVID-19 Pneumonia: Correlations with Chest CT on Hospital admission
Abstract
Background: Lung ultrasound (LUS) is an accurate, safe, and cheap tool assisting in the diagnosis of several acute respiratory diseases. The diagnostic value of LUS in the workup of coronavirus disease-19 (COVID-19) in the hospital setting is still uncertain.
Objectives: The aim of this observational study was to explore correlations of the LUS appearance of COVID-19-related pneumonia with CT findings.
Methods: Twenty-six patients (14 males, age 64 ± 16 years) urgently hospitalized for COVID-19 pneumonia, who underwent chest CT and bedside LUS on the day of admission, were enrolled in this observational study. CT images were reviewed by expert chest radiologists, who calculated a visual CT score based on extension and distribution of ground-glass opacities and consolidations. LUS was performed by clinicians with certified competency in thoracic ultrasonography, blind to CT findings, following a systematic approach recommended by ultrasound guidelines. LUS score was calculated according to presence, distribution, and severity of abnormalities.
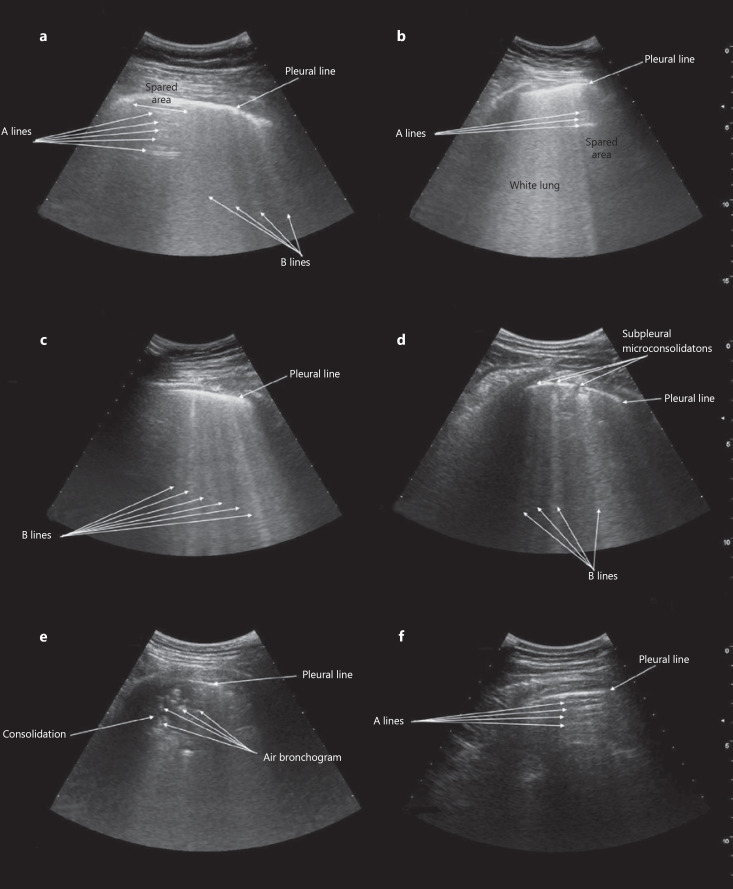
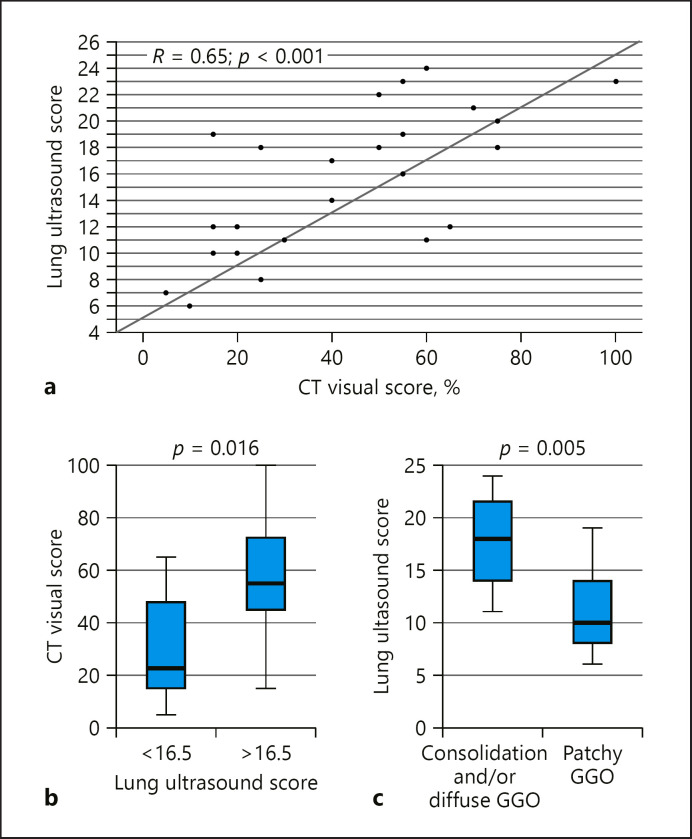
Results: All participants had CT findings suggestive of bilateral COVID-19 pneumonia, with an average visual scoring of 43 ± 24%. LUS identified 4 different possible -abnormalities, with bilateral distribution (average LUS score 15 ± 5): focal areas of nonconfluent B lines, diffuse confluent B lines, small subpleural microconsolidations with pleural line irregularities, and large parenchymal consolidations with air bronchograms. LUS score was significantly correlated with CT visual scoring (r = 0.65, p < 0.001) and oxygen saturation in room air (r = -0.66, p < 0.001).
Conclusion: When integrated with clinical data, LUS could represent a valid diagnostic aid in patients with suspect COVID-19 pneumonia, which reflects CT findings.
Keywords: Chest ultrasound; Coronavirus pneumonia; Point-of-care ultrasonography; SARS-CoV-2; Thoracic ultrasound.
© 2020 S. Karger AG, Basel.
Conflict of interest statement
The authors have no conflict of interest to declare.
Figures
Comment in
-
Lung Ultrasound in COVID-19: Not Novel, but Necessary.Respiration. 2020;99(7):545-547. doi: 10.1159/000509763. Epub 2020 Jul 13. Respiration. 2020. PMID: 32659765 Free PMC article. No abstract available.
Similar articles
-
Correlation between Chest Computed Tomography and Lung Ultrasonography in Patients with Coronavirus Disease 2019 (COVID-19).Ultrasound Med Biol. 2020 Nov;46(11):2918-2926. doi: 10.1016/j.ultrasmedbio.2020.07.003. Epub 2020 Jul 13. Ultrasound Med Biol. 2020. PMID: 32771222 Free PMC article.
-
Comparative study of lung ultrasound and chest computed tomography scan in the assessment of severity of confirmed COVID-19 pneumonia.Intensive Care Med. 2020 Sep;46(9):1707-1713. doi: 10.1007/s00134-020-06186-0. Epub 2020 Jul 29. Intensive Care Med. 2020. PMID: 32728966 Free PMC article.
-
A single-center comparative study of lung ultrasound versus chest computed tomography during the COVID-19 era.Multidiscip Respir Med. 2021 Jul 21;16(1):766. doi: 10.4081/mrm.2021.766. eCollection 2021 Jan 15. Multidiscip Respir Med. 2021. PMID: 34345428 Free PMC article.
-
Lung Ultrasound May Support Diagnosis and Monitoring of COVID-19 Pneumonia.Ultrasound Med Biol. 2020 Nov;46(11):2908-2917. doi: 10.1016/j.ultrasmedbio.2020.07.018. Epub 2020 Jul 20. Ultrasound Med Biol. 2020. PMID: 32807570 Free PMC article. Review.
-
Thoracic imaging tests for the diagnosis of COVID-19.Cochrane Database Syst Rev. 2020 Sep 30;9:CD013639. doi: 10.1002/14651858.CD013639.pub2. Cochrane Database Syst Rev. 2020. Update in: Cochrane Database Syst Rev. 2020 Nov 26;11:CD013639. doi: 10.1002/14651858.CD013639.pub3. PMID: 32997361 Updated.
Cited by
-
Impact of the COVID-19 pandemic on the selection of chest imaging modalities and reporting systems: a survey of Italian radiologists.Radiol Med. 2021 Oct;126(10):1258-1272. doi: 10.1007/s11547-021-01385-1. Epub 2021 Jul 1. Radiol Med. 2021. PMID: 34196908 Free PMC article.
-
Diaphragm Ultrasound in Different Clinical Scenarios: A Review with a Focus on Older Patients.Geriatrics (Basel). 2024 May 30;9(3):70. doi: 10.3390/geriatrics9030070. Geriatrics (Basel). 2024. PMID: 38920426 Free PMC article. Review.
-
Echocardiography, lung ultrasound, and cardiac magnetic resonance findings in COVID-19: A systematic review.Echocardiography. 2021 Aug;38(8):1365-1404. doi: 10.1111/echo.15152. Epub 2021 Jul 8. Echocardiography. 2021. PMID: 34236091 Free PMC article.
-
Comparison of lung ultrasonography findings with chest computed tomography results in coronavirus (COVID-19) pneumonia.J Med Ultrason (2001). 2021 Apr;48(2):245-252. doi: 10.1007/s10396-021-01081-7. Epub 2021 Feb 26. J Med Ultrason (2001). 2021. PMID: 33638057 Free PMC article.
-
Insights from comparison of the clinical presentation and outcomes of patients hospitalized with COVID-19 in an Italian internal medicine ward during first and third wave.Front Med (Lausanne). 2023 Feb 1;10:1112728. doi: 10.3389/fmed.2023.1112728. eCollection 2023. Front Med (Lausanne). 2023. PMID: 36817786 Free PMC article.