. 2020 Jun 18;12(6):1608.
doi: 10.3390/cancers12061608.

Low Molecular Weight Fucoidan Prevents Radiation-Induced Fibrosis and Secondary Tumors in a Zebrafish Model

Affiliations

Low Molecular Weight Fucoidan Prevents Radiation-Induced Fibrosis and Secondary Tumors in a Zebrafish Model

Szu-Yuan Wu et al. Cancers (Basel). .

Abstract

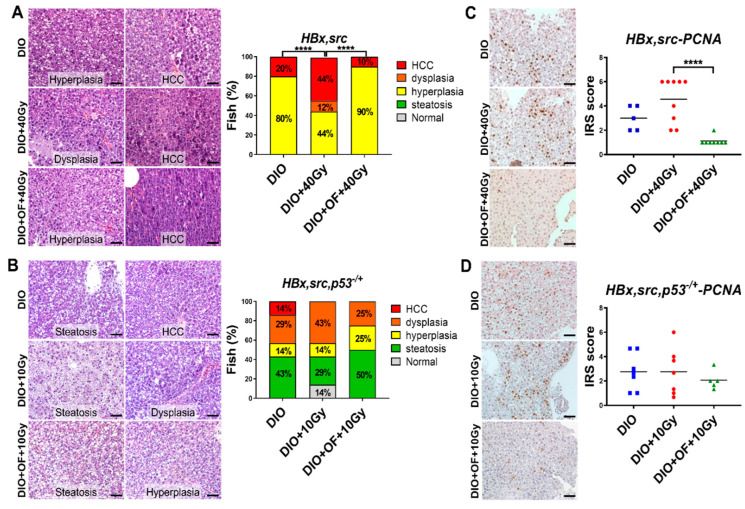
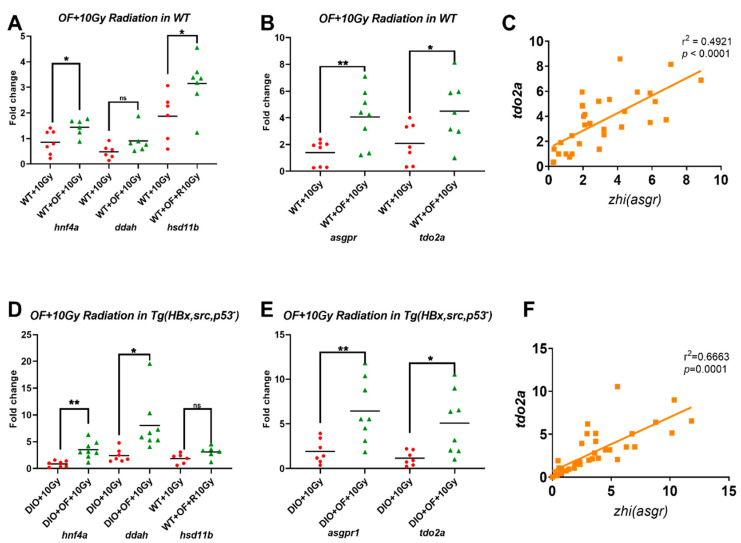
Radiotherapy often causes unwanted side effects such as radiation-induced fibrosis and second malignancies. Fucoidan, a sulfated polysaccharide extracted from brown seaweed, has many biological effects including anti-inflammation and anti-tumor. In the present study, we investigated the radioprotective effect of Oligo-Fucoidan (OF) using a zebrafish animal model. Adult zebrafish of wild-type and transgenic fish with hepatocellular carcinoma were orally fed with Oligo-Fucoidan before irradiation. Quantitative PCR, Sirius red stain, hematoxylin, and eosin stain were used for molecular and pathological analysis. Whole genomic microarrays were used to discover the global program of gene expression after Oligo-Fucoidan treatment and identified distinct classes of up- and downregulated genes/pathways during this process. Using Oligo-Fucoidan oral gavage in adult wild-type zebrafish, we found Oligo-Fucoidan pretreatment decreased irradiation-induced fibrosis in hepatocyte. Using hepatitis B virus X antigen (HBx), Src and HBx, Src, p53-/+ transgenic zebrafish liver cancer model, we found that Oligo-Fucoidan pretreatment before irradiation could lower the expression of lipogenic factors and enzymes, fibrosis, and cell cycle/proliferation markers, which eventually reduced formation of liver cancer compared to irradiation alone. Gene ontology analysis revealed that Oligo-Fucoidan pretreatment increased the expression of genes involved in oxidoreductase activity in zebrafish irradiation. Oligo-Fucoidan also decreased the expression of genes involved in transferase activity in wild-type fish without irradiation (WT), nuclear outer membrane-endoplasmic reticulum membrane network, and non-homologous end-joining (NHEJ) in hepatocellular carcinoma (HCC) transgenic fish. Rescue of those genes can prevent liver cancer formation. Conclusions: Our results provide evidence for the ability of Oligo-Fucoidan to prevent radiation-induced fibrosis and second malignancies in zebrafish.

Keywords: Oligo-Fucoidan; radiation-induced fibrosis; radiation-induced secondary malignancy; zebrafish.


Conflict of interest statement

The authors declare no conflict of interest.

Figures

Figure 1
Figure 1
Expression levels of apoptosis, fibrosis, and cell proliferation-related genes in adult wild-type zebrafish treated with Oligo-Fucoidan and radiation. (A) The expression of B-cell lymphoma 2 (bcl2)-associated agonist of cell death (bad), bcl2-associated X protein a (baxa), apoptosis-related cysteine peptidase 3a (caspase 3a), apoptosis-related cysteine peptidase 8 (caspase 8), apoptosis antigen 1 (fas), c-Jun N-terminal kinase 1 (jnk-1), mitogen-activated protein kinase 8a (p38(MAPK)) in wild-type fish treated with 40 Gy irradiation (40 Gy) or treatment of Oligo-Fucoidan before 40 Gy irradiation (OF + 40Gy). (B) The expression of collagen, type I, alpha 1a (col1a1), connective tissue growth factor a (ctgfa), heparanase (hpse) in wild-type fish treated with 40 Gy irradiation (40 Gy) or treatment of Oligo-Fucoidan before 40 Gy irradiation (OF + 40 Gy). (C) The expression of cyclin E1 (ccne1), cyclin-dependent kinase 1 (cdk1), and cyclin-dependent kinase 2 (cdk2) in wild-type fish treated with 40 Gy irradiation (40 Gy) or treatment of Oligo-Fucoidan before 40 Gy irradiation (OF + 40 Gy). (D) The expression of col1a1, ctgfa, and hpse in wild-type fish treated with 10 Gy irradiation (10 Gy) or treatment of Oligo-Fucoidan before 10 Gy irradiation (OF + 10 Gy). The data are presented as dot plots with a horizontal line for the mean and are repeated in triplicate. The statistical significance was calculated using Student’s t-test (* p < 0.05, ** p < 0.01, ns: non-significant).
Figure 2
Figure 2
Sirius red staining in adult zebrafish treated with Oligo-Fucoidan and radiation. (A) The representative images of Sirius red staining of wild-type fish without irradiation (WT), with 40 Gy irradiation (WT + 40 Gy), or treatment of Oligo-Fucoidan before 40 Gy irradiation (WT + OF + 40 Gy). The images were taken at 400× magnification, and the scale shown is for 50 µm. (B) Statistical analysis from wild-type fish treated with 40 Gy irradiation. (C) The representative images of Sirius red staining of wild-type fish without irradiation (WT), with 10 Gy irradiation (WT + 10 Gy) or treatment of Oligo-Fucoidan before 10 Gy irradiation (WT + OF + 10 Gy). The images were taken at 400× magnification, and the scale shown is for 50 µm. (D) Statistical analysis from wild-type fish treated with 10 Gy irradiation.
Figure 3
Figure 3
Expression levels of lipogenic factor and lipogenesis enzyme genes in adult zebrafish treated with Oligo-Fucoidan and radiation. (A) The expression of lipogenic factors (pparg, srebp1, and mlxlp) in HBx,src transgenic fish with diet-induced obesity plus 40 Gy irradiation (DIO + 40 Gy) or treatment of Oligo-Fucoidan before 40 Gy irradiation (DIO + OF + 40 Gy). (B) The expression of lipogenesis enzyme 1-acylglycerol-3-phosphate O-acyltransferase 4 (lysophosphatidic acid acyltransferase, delta) (agpat4, phospholipid phosphatase 1a (plpp1a)), transcript variant X1, mRNA (pap), and fatty acid synthase (fasn) in HBx,src transgenic fish with diet-induced obesity plus 40 Gy irradiation (DIO + 40 Gy) or treatment of Oligo-Fucoidan before 40 Gy irradiation (DIO + OF + 40 Gy). (C). The expression of collagen, type I, alpha 1a (col1a1), connective tissue growth factor a (ctgfa), and heparanase (hpse) in HBx,src transgenic fish with diet-induced obesity plus 40 Gy irradiation (DIO + 40Gy) or treatment of Oligo-Fucoidan before 40 Gy irradiation (DIO + OF + 40 Gy). (D). The expression of cyclin E1 (ccne1), cyclin-dependent kinase 1 (cdk1), and cyclin-dependent kinase 2 (cdk2) in HBx, src transgenic fish with diet-induced obesity plus 40 Gy irradiation (DIO + 40 Gy) or treatment of Oligo-Fucoidan before 40 Gy irradiation (DIO + OF + 40 Gy). (E). The expression of col1a1, ctgfa, and hpse in HBx, src, p53-transgenic fish with diet-induced obesity plus 10 Gy irradiation (DIO + 10 Gy) or treatment of Oligo-Fucoidan before 10 Gy irradiation (DIO + OF + 10 Gy). (F). The expression of ccne1, cdk1, and cdk2 in HBx,src,p53-transgenic fish with diet-induced obesity plus 10 Gy irradiation (DIO + 10 Gy) or treatment of Oligo-Fucoidan before 10 Gy irradiation (DIO + OF + 10 Gy). The data are presented as dot plots with a horizontal line for the mean and are repeated in triplicate. The statistical significance was calculated using Student’s t-test (* p < 0.05, ** p < 0.01, ns: non-significant).
Figure 4
Figure 4
Representative images of hepatocyte apoptosis detected on hematoxylin and eosin (H&E) stain liver specimen from WT and transgenic fish with radiation without Oligo-Fucoidan or with Oligo-Fucoidan pretreatment. The images were taken at 400× magnification, and the scale shown is for 30 µm; the box area is enlarged to show the hepatocyte apoptosis, and the blue arrows pointed to the apoptotic hepatocytes. (A–C) The hepatocyte apoptosis in wild-type fish (WT) with 10 Gy irradiation (WT + 10 Gy) or treatment of Oligo-Fucoidan before 10 Gy irradiation (WT + OF + 10 Gy). (D) Statistical analysis of hepatocyte apoptosis feature of WT fish. (E–G) The hepatocyte apoptosis in Tg (HBx, src, p53−) transgenic fish with diet-induced obesity (DIO) with 10 Gy irradiation (DIO + 10 Gy) or treatment of Oligo-Fucoidan before 10 Gy irradiation (DIO + OF + 10 Gy). (H) Statistical analysis of hepatocyte apoptosis feature of Tg (HBx, src, p53−) fish. (I–K) The hepatocyte apoptosis in Tg (HBx, src) transgenic fish with diet-induced obesity (DIO) with 10 Gy irradiation (DIO + 40 Gy) or treatment of Oligo-Fucoidan before 40 Gy irradiation (DIO + OF + 40 Gy). (L) Statistical analysis of hepatocyte apoptosis feature of Tg (HBx, src) fish. The data are presented as dot plots with a horizontal line for the mean and are repeated in triplicate. The statistical significance was calculated using Student’s t-test (* p < 0.05, ** p < 0.01).
Figure 5
Figure 5
Histopathological analysis by H&E staining of hepatocytes in adult HBx, src transgenic zebrafish treated with Oligo-Fucoidan and radiation. (A,B) Representative images for H&E stain were shown. The images were taken at 400× magnification, and the scale shown is for 30 µm. (A) Statistical analysis of H&E staining of the liver sections from HBx, src transgenic fish diet-induced obesity (DIO) with 40 Gy irradiation (DIO + 40 Gy) and oral feeding Oligo-Fucoidan (DIO + OF + 40 Gy). (B) Statistical analysis of H&E staining of the liver sections from HBx,src,p53-transgenic fish diet-induced obesity (DIO) with 10 Gy irradiation (DIO + 10 Gy) and oral feeding Oligo-Fucoidan (DIO + OF + 10 Gy). The different colors denote the different pathological features as follows: gray: normal, green: steatosis, yellow: hyperplasia, orange: dysplasia, and red: hepatocellular carcinoma (HCC). N = 4–5 for the DIO group, and N = 9–10 for the other groups. (C,D) Representative images for proliferating cell nuclear antigen (PCNA) immunohistochemistry (IHC) stain were shown. The images were taken at 400× magnification, and the scale shown is for 30 µm. (C) Statistical analysis of PCNA immunohistochemistry staining of the liver sections from HBx,src transgenic fish diet-induced obesity (DIO) with 40 Gy irradiation (DIO + 40 Gy) and oral feeding Oligo-Fucoidan (DIO + OF + 40 Gy). (D) Statistical analysis of PCNA IHC staining of the liver sections from HBx,src,p53-transgenic fish diet-induced obesity (DIO) with 10 Gy irradiation (DIO + 10 Gy) and oral feeding Oligo-Fucoidan (DIO + OF + 10 Gy). The data are presented as dot plots with a horizontal line for the mean and are repeated in triplicate. The statistical significance was calculated using Student’s t-test (**** p < 0.0001).
Figure 6
Figure 6
GeneTitan array analysis of the expression profile of wild-type zebrafish following different treatments. (A) Venn diagram of upregulation of genes in WT zebrafish irradiation and Oligo-Fucoidan pretreatment (OF + R) versus irradiation alone (R), overlapping with downregulated in irradiation (R) compare to no radiation (control). (B) The heatmap of genes that were upregulated in Oligo-Fucoidan pretreatment but downregulated by irradiation. First batch is 40 Gy (1), and second batch is 10 Gy (2). (C) Gene ontology analysis of Oligo-Fucoidan-induced genes in WT irradiation (D) Venn diagram of downregulation of genes in WT zebrafish irradiation and Oligo-Fucoidan pretreatment (OF + R) versus irradiation alone (R), overlapping with upregulated in irradiation (R) compared to no radiation (control). (E) The heatmap of genes that were downregulated in Oligo-Fucoidan pretreatment but upregulated by irradiation. First batch is 40 Gy (1), and second batch is 10 Gy (2). (F) Gene ontology analysis of Oligo-Fucoidan repressed genes in WT irradiation.
Figure 7
Figure 7
GeneTitan array analysis of the expression profile of HCC transgenic zebrafish following different treatments. (A) Venn diagram of upregulation of genes in HCC transgenic zebrafish diet-induced obesity with irradiation and Oligo-Fucoidan pretreatment (DIO + OF + R) compared to irradiation only (DIO + R), overlapping with downregulated in irradiation (DIO + R) compared to no radiation (DIO). (B) The heatmap of genes upregulated in Oligo-Fucoidan pretreatment but downregulated by irradiation. First batch is HBx, src transgenic fish with 40 Gy (1), and second batch is HBx, src, p53-transgenic fish with 10 Gy (2). (C) Gene ontology analysis of Oligo-Fucoidan induced genes in irradiated transgenic fish. (D) Venn diagram of downregulation of genes in HCC transgenic zebrafish diet-induced obesity with irradiation and Oligo-Fucoidan pretreatment (DIO + OF +R) compared to irradiation only (DIO + R), overlapping with downregulated in irradiation (DIO + R) compare to no radiation (DIO). (E) The heatmap of genes downregulated in Oligo-Fucoidan pretreatment but upregulated by irradiation. First batch is HBx, src transgenic fish with 40 Gy (1), and second batch is HBx, src, p53-transgenic fish with 10 Gy (2). (F) Gene ontology analysis of Oligo-Fucoidan repressed genes in irradiated transgenic fish.
Figure 8
Figure 8
GeneTitan array analysis of expression profiles of wild-type and HBx, src transgenic zebrafish following different treatments. (A) Venn diagram of overlapping differentially expressed genes. (B) HNF4A is the driver gene according to NetworkAnalyst (https://www.networkanalyst.ca/).
Figure 9
Figure 9
Upregulations of hnf4a, ddah1, 11b-hsd1, asgpr1, and hnf4a downstream target genes: tdo2a, in zebrafish after irradiation. (A) Gene expression profiles of hnf4a, ddah1, 11b-hsd1 and (B) zhi (asgpr1), tdo2a in WT zebrafish irradiation (WT + 10 Gy) and Oligo-Fucoidan pretreatment (WT + OF + R). (C) Positive correlations between zhi (asgpr1) and tdo2a were shown. (D) Gene expression profiles of hnf4a, ddah1, 11b-hsd1 and (E) zhi (asgpr1), tdo2a in HBx,src,p53-transgenic fish with diet-induced obesity plus 10 Gy irradiation (DIO + 10 Gy) or treatment of Oligo-Fucoidan before 10 Gy irradiation (DIO + OF + 10 Gy). (F) Positive correlations between zhi (asgpr1) and tdo2a were shown. Statistical significance was calculated by t-test (* p ≤ 0.05, ** p ≤ 0.01).

References

    1. Papp B., Plath K. Reprogramming to pluripotency: Stepwise resetting of the epigenetic landscape. Cell Res. 2011;21:486–501. doi: 10.1038/cr.2011.28. - DOI - PMC - PubMed
    1. Zhang S., Mercado-Uribe I., Xing Z., Sun B., Kuang J., Liu J. Generation of cancer stem-like cells through the formation of polyploid giant cancer cells. Oncogene. 2014;33:116–128. doi: 10.1038/onc.2013.96. - DOI - PMC - PubMed
    1. Meyn R.E., Jenkins W.T. Variation in normal and tumor tissue sensitivity of mice to ionizing radiation-induced DNA strand breaks in vivo. Cancer Res. 1983;43:5668–5673. - PubMed
    1. Valentin J. Radiation and your patient: A guide for medical practitioners. Ann. ICRP. 2001;31:5–31. doi: 10.1016/S0146-6453(02)00007-6. - DOI - PubMed
    1. Liang S.X., Zhu X.D., Xu Z.Y., Zhu J., Zhao J.D., Lu H.J., Yang Y.L., Chen L., Wang A.Y., Fu X.L., et al. Radiation-induced liver disease in three-dimensional conformal radiation therapy for primary liver carcinoma: The risk factors and hepatic radiation tolerance. Int. J. Radiat. Oncol. Biol. Phys. 2006;65:426–434. doi: 10.1016/j.ijrobp.2005.12.031. - DOI - PubMed