. 2020 Jun 18;9(6):1904.
doi: 10.3390/jcm9061904.

Global Comparison of Changes in the Number of Test-Positive Cases and Deaths by Coronavirus Infection (COVID-19) in the World

Affiliations

Global Comparison of Changes in the Number of Test-Positive Cases and Deaths by Coronavirus Infection (COVID-19) in the World

Akihiro Hisaka et al. J Clin Med. .

Abstract

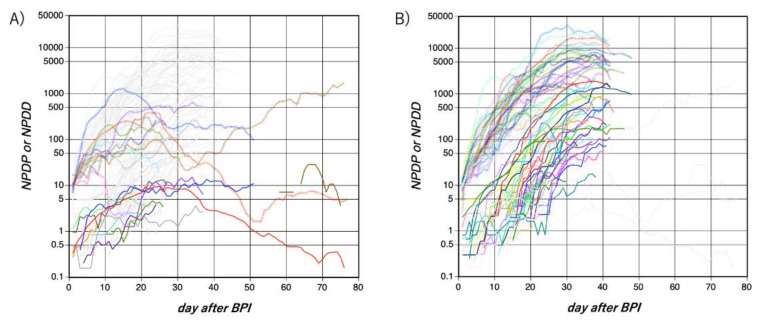
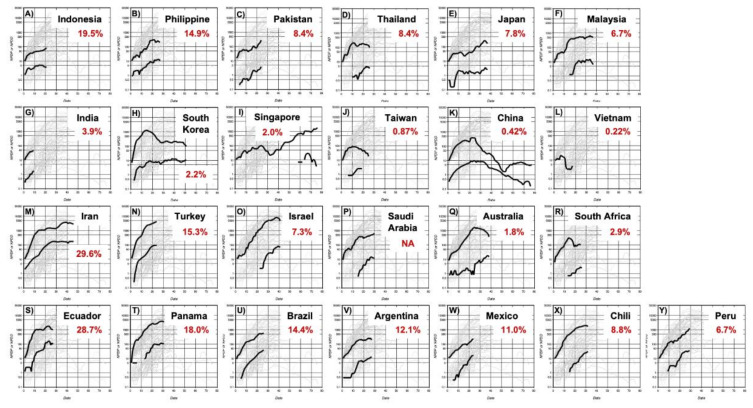
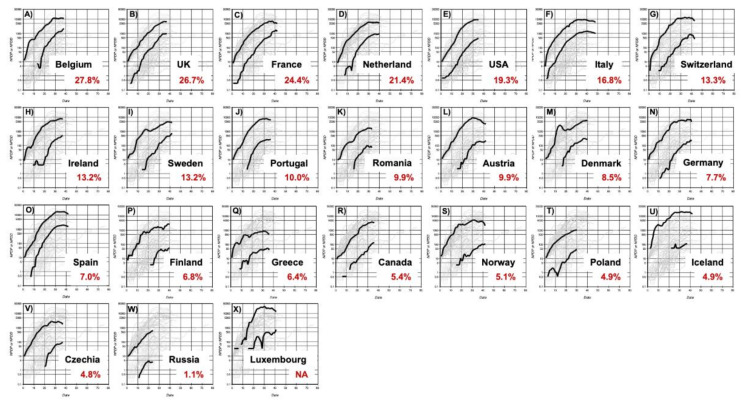
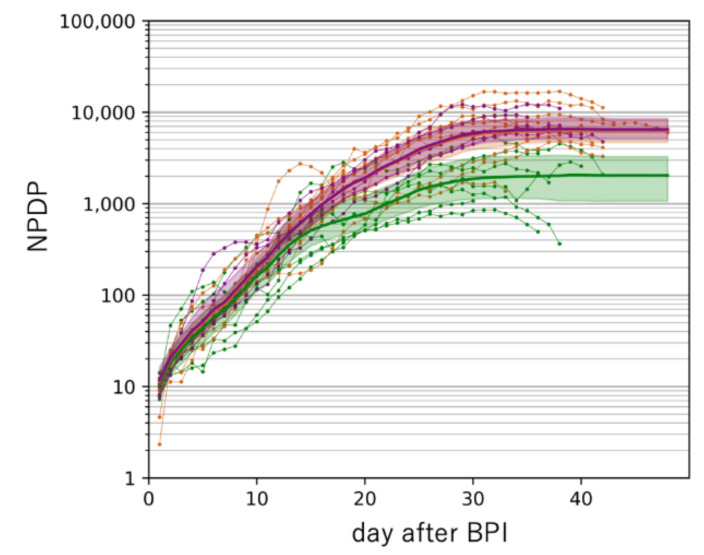
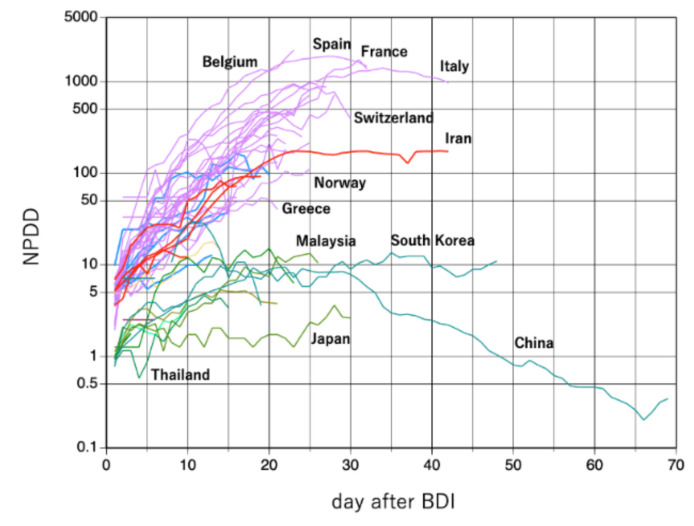
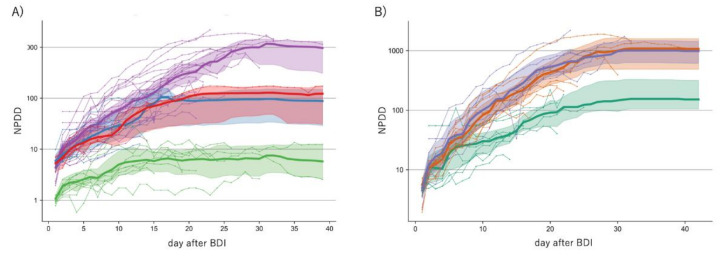
Global differences in changes in the numbers of population-adjusted daily test-positive cases (NPDP) and deaths (NPDD) by COVID-19 were analyzed for 49 countries, including developed and developing countries. The changes as a proportion of national population were compared, adjusting by the beginning of test-positive cases increase (BPI) or deaths increase (BDI). Remarkable regional differences of more than 100-fold in NPDP and NPDD were observed. The trajectories of NPDD after BDI increased exponentially within 20 days in most countries. Machine learning analysis suggested that NPDD on 30 days after BDI was the highest in developed Western countries (1180 persons per hundred million), followed by countries in the Middle East (128), Latin America (97), and Asia (7). Furthermore, in Western countries with positive rates of the PCR test of less than 7.0%, the increase in NPDP was slowing-down two weeks after BPI, and subsequent NPDD was only 15% compared with those with higher positive rates, which suggested that the situation of testing might have affected the velocity of COVID-19 spread. The causes behind remarkable differences between regions possibly include genetic factors of inhabitants because distributions of the race and of the observed infection increasing rates were in good agreement globally.

Keywords: COVID-19; PCR test; coronavirus; infection management; infectious disease; kinetic analysis; mortality.


Conflict of interest statement

The authors declare no conflict of interest.

Figures

Figure 1
Figure 1
Time courses of NPDP and NPDD after BPI by novel coronavirus diseases 2019 (COVID-19) in Asian countries (except for the Middle East. Panel (A) and non-Asian countries (Panel (B)). The upper dotted lines and lower solid lines represent NPDP and NPDD, respectively. The colors of NPDP and NPDD correspond to each country. Lines in very light gray indicate lines in non-Asian and Asian countries in Panels A and B, respectively, for comparison. Refer to Figure 2 and Figure 3 to identify each country. NPDP: number of population-adjusted daily test-positive cases. NPDD: number of population-adjusted daily deaths. BPI: beginning of the test-positive cases increase.
Figure 2
Figure 2
Time courses of NPDP and NPDD by COVID-19 after BPI in Asian countries (Panels (AL)), the Middle East (Panels (MP)), Oceania (Panel (Q)), South Africa (Panel (R)), and Latin America (Panels (SY). Numbers in red represent the positive rate of the PCR test. The countries are placed in decreasing order of the positive rate in each region. The upper and lower bold lines in each panel are NPDP and NPDD, respectively, except for Vietnam where no death has been recorded. The scales in all panels are the same as those in Figure 1. *: Positive rate in Guangdong. NA: Not available. NPDP: number of population-adjusted daily test-positive cases. NPDD: number of population-adjusted daily deaths. BPI: beginning of the test-positive cases increase.
Figure 3
Figure 3
Time courses of NPDP and NPDD after BPI by COVID-19 in countries in Europe and North America (Panels (AX)). Numbers in red represent the positive rate of the PCR test. The countries are placed in decreasing order of positive rate. The upper and lower bold lines in each panel are NPDP and NPDD, respectively. The scales in all panels are the same as those in Figure 1. NA: Not available. NPDP: number of population-adjusted daily test-positive cases. NPDD: number of population-adjusted daily deaths. BPI: beginning of the test-positive cases increase.
Figure 4
Figure 4
Estimation of the time course of NPDP after BPI in Western countries by machine learning analysis classified by the positive rate of the PCR test. Green, orange, and purple lines indicate positive rates of 0.0–6.9%, 7.0–16.9%, and 17.0–28.0%, respectively. Each colored area represents a 5–95% confidence interval of the median estimated by bootstrap analysis. The orange and purple lines and areas completely overlapped. NPDP: number of population-adjusted daily test-positive cases. BPI: beginning of the test-positive cases increase. PCR: Polymerase chain reaction.
Figure 5
Figure 5
Time courses of NPDD after BDI by COVID-19. Green, red, blue, and purple lines represent Asia, the Middle East, Latin America, and Western countries, respectively. Some noticeable countries are labeled but refer to Figure 2 and Figure 3 to identify each country. NPDD: number of population-adjusted daily deaths. BPI: beginning of the test-positive cases increase.
Figure 6
Figure 6
Estimation of the time course of NPDD after BDI by machine learning analysis classified by the global region (Panel (A)) and by the positive rate of the PCR test (Panel (B)). In Panel (A), yellow-green, red, blue, and purple lines indicate countries in Asia (excluding the Middle East), the Middle East, Latin America, and Western (Europe, Oceania, and North America), respectively. In Panel (B), only Western countries were analyzed. Green, orange, and blue lines indicate the positive rates of 0.0–6.9%, 7.0–16.9%, and 17.0–28.0%, respectively. Each colored area represents a 5–95% confidence interval of the median estimated by bootstrap analysis. NPDD: number of population-adjusted daily deaths. BPI: beginning of the test-positive cases increase.

References

    1. Ducharme J. ThWorld Health Organization Declares COVID-19 a ‘Pandemic.’ Here’s What That Means. [(accessed on 10 April 2020)];The Times. 2020 Mar 11; Available online: https://time.com/5791661/who-coronavirus-pandemic-declaration/
    1. Li Q., Guan X., Wu P., Wang X., Zhou L., Tong Y., Ren R., Leung K.S.M., Lau E.H.Y., Wong J.Y., et al. Early transmission dynamics in Wuhan, China, of novel coronavirus-infected pneumonia. N. Engl. J. Med. 2020;382:1199–1207. doi: 10.1056/NEJMoa2001316. - DOI - PMC - PubMed
    1. Daily Report by Baidu. [(accessed on 10 April 2020)]; Available online: https://voice.baidu.com/act/newpneumonia/newpneumonia/?from=osari_pc_1.
    1. COVID-19 in Africa: ‘Prepare for the Worst, but Hope for the Best’. Healio, SLACK Incorporated, Thorofare; West Deptford, NJ, USA: 2020. [(accessed on 10 April 2020)]. Available online: https://www.healio.com/infectious-disease/emerging-diseases/news/online/....
    1. Hong K.H., Lee S.W., Kim T.S., Huh H.J., Lee J., Kim S.Y., Park J.S., Kim G.J., Sung H., Roh K.H., et al. Guidelines for Laboratory Diagnosis of Coronavirus Disease 2019 (COVID-19) in Korea. Ann. Lab. Med. 2020;40:351–360. doi: 10.3343/alm.2020.40.5.351. - DOI - PMC - PubMed

LinkOut - more resources