

ZEB1/miR-200c/AGR2: A New Regulatory Loop Modulating the Epithelial-Mesenchymal Transition in Lung Adenocarcinomas
- PMID: 32570918
- PMCID: PMC7352583
- DOI: 10.3390/cancers12061614
ZEB1/miR-200c/AGR2: A New Regulatory Loop Modulating the Epithelial-Mesenchymal Transition in Lung Adenocarcinomas
Abstract
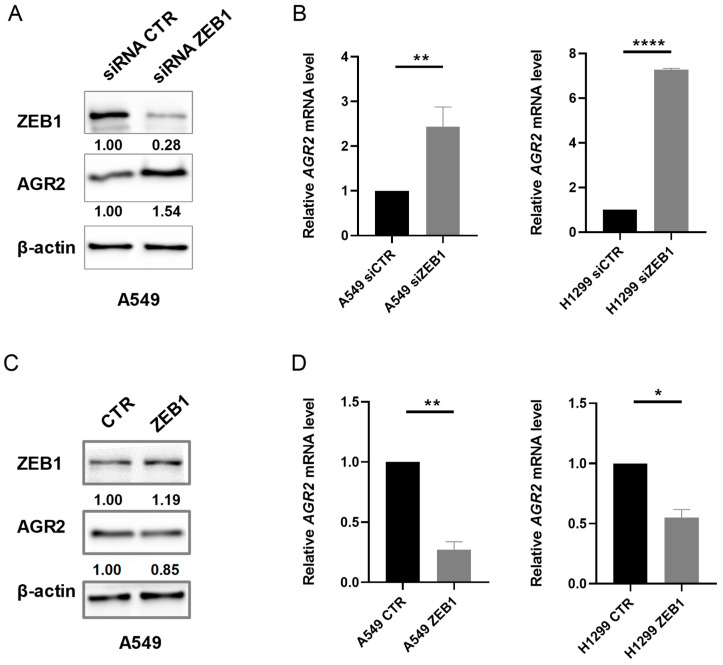
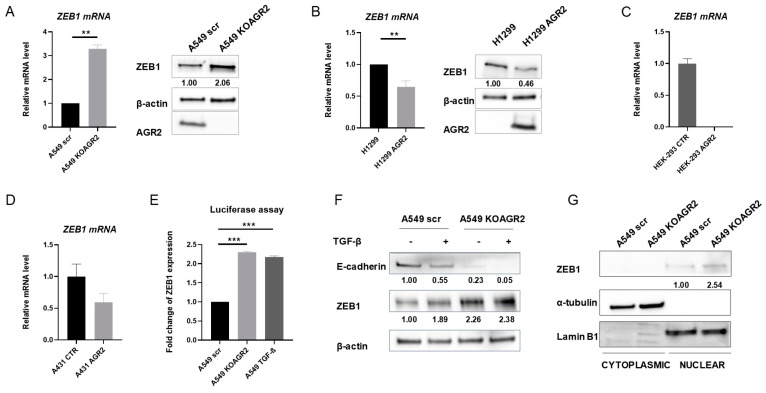
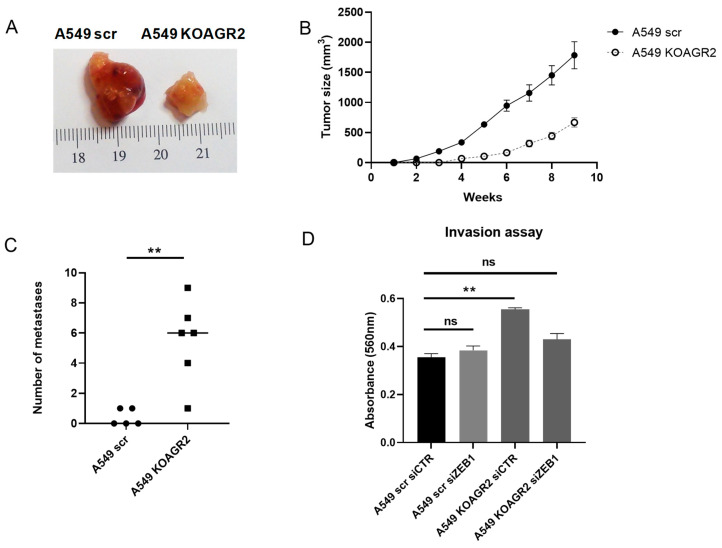
Epithelial-mesenchymal transition (EMT) is a process involved not only in morphogenesis and embryonic development, but also in cancer progression, whereby tumor cells obtain a more aggressive metastatic phenotype. Anterior gradient protein 2 (AGR2) maintains the epithelial phenotype and blocks the induction of EMT, thus playing an undeniable role in tumor progression. However, the mechanism through which AGR2 expression is regulated, not only during EMT, but also in the early stages of cancer development, remains to be elucidated. In the present study, we show an inverse correlation of AGR2 with ZEB1 (zinc finger enhancer binding protein, δEF1) that was verified by analysis of several independent clinical data sets of lung adenocarcinomas. We also identified the ZEB1 binding site within the AGR2 promoter region and confirmed AGR2 as a novel molecular target of ZEB1. The overexpression of ZEB1 decreased the promoter activity of the AGR2 gene, which resulted in reduced AGR2 protein level and the acquisition of a more invasive phenotype of these lung cancer cells. Conversely, silencing of ZEB1 led not only to increased levels of AGR2 protein, but also attenuated the invasiveness of tumor cells. The AGR2 knockout, vice versa, increased ZEB1 expression, indicating that the ZEB1/AGR2 regulatory axis may function in a double negative feedback loop. In conclusion, we revealed for the first time that ZEB1 regulates AGR2 at the transcriptional level, while AGR2 presence contributes to ZEB1 mRNA degradation. Thus, our data identify a new regulatory mechanism between AGR2 and ZEB1, two rivals in the EMT process, tightly associated with the development of metastasis.
Keywords: AGR2; EMT; ZEB1; cancer.
Conflict of interest statement
The authors declare no conflict of interest.
Figures


Similar articles
-
UBE2C, Directly Targeted by miR-548e-5p, Increases the Cellular Growth and Invasive Abilities of Cancer Cells Interacting with the EMT Marker Protein Zinc Finger E-box Binding Homeobox 1/2 in NSCLC.Theranostics. 2019 Mar 17;9(7):2036-2055. doi: 10.7150/thno.32738. eCollection 2019. Theranostics. 2019. Retraction in: Theranostics. 2020 Jul 25;10(21):9619. doi: 10.7150/thno.50254. PMID: 31037155 Free PMC article. Retracted.
-
The ZEB1/miR-200c feedback loop regulates invasion via actin interacting proteins MYLK and TKS5.Oncotarget. 2015 Sep 29;6(29):27083-96. doi: 10.18632/oncotarget.4807. Oncotarget. 2015. PMID: 26334100 Free PMC article.
-
Suppression of AGR2 in a TGF-β-induced Smad regulatory pathway mediates epithelial-mesenchymal transition.BMC Cancer. 2017 Aug 15;17(1):546. doi: 10.1186/s12885-017-3537-5. BMC Cancer. 2017. PMID: 28810836 Free PMC article.
-
miR-200c: a versatile watchdog in cancer progression, EMT, and drug resistance.J Mol Med (Berl). 2016 Jun;94(6):629-44. doi: 10.1007/s00109-016-1420-5. Epub 2016 Apr 20. J Mol Med (Berl). 2016. PMID: 27094812 Review.
-
The Curious Case of ZEB1.Discoveries (Craiova). 2018 Dec 31;6(4):e86. doi: 10.15190/d.2018.7. Discoveries (Craiova). 2018. PMID: 32309604 Free PMC article. Review.
Cited by
-
The circRNA circADAMTS6 promotes progression of ESCC and correlates with prognosis.Sci Rep. 2022 Aug 12;12(1):13757. doi: 10.1038/s41598-022-17450-2. Sci Rep. 2022. PMID: 35962061 Free PMC article.
-
Characterization of the AGR2-NPM3 axis uncovers the AGR2 involvement in PD-L1 regulation in colorectal cancer.Sci Rep. 2024 Sep 20;14(1):21926. doi: 10.1038/s41598-024-72990-z. Sci Rep. 2024. PMID: 39300184 Free PMC article.
-
AGR2: The Covert Driver and New Dawn of Hepatobiliary and Pancreatic Cancer Treatment.Biomolecules. 2024 Jun 23;14(7):743. doi: 10.3390/biom14070743. Biomolecules. 2024. PMID: 39062458 Free PMC article. Review.
-
Regulation of ZEB1 Function and Molecular Associations in Tumor Progression and Metastasis.Cancers (Basel). 2022 Apr 7;14(8):1864. doi: 10.3390/cancers14081864. Cancers (Basel). 2022. PMID: 35454770 Free PMC article. Review.
-
Integrative multi-omics and drug-response characterization of patient-derived prostate cancer primary cells.Signal Transduct Target Ther. 2023 May 1;8(1):175. doi: 10.1038/s41392-023-01393-9. Signal Transduct Target Ther. 2023. PMID: 37121942 Free PMC article.
References
-
- Kroger C., Afeyan A., Mraz J., Eaton E.N., Reinhardt F., Khodor Y.L., Thiru P., Bierie B., Ye X., Burge C.B., et al. Acquisition of a hybrid E/M state is essential for tumorigenicity of basal breast cancer cells. Proc. Natl. Acad. Sci. USA. 2019;116:7353–7362. doi: 10.1073/pnas.1812876116. - DOI - PMC - PubMed
Grants and funding
LinkOut - more resources
Full Text Sources
Miscellaneous
