. 2020 Jun 22;21(1):416.
doi: 10.1186/s12864-020-06809-2.

Gene expression predictions and networks in natural populations supports the omnigenic theory

Affiliations

Gene expression predictions and networks in natural populations supports the omnigenic theory

Aurélien Chateigner et al. BMC Genomics. .

Abstract

Background: Recent literature on the differential role of genes within networks distinguishes core from peripheral genes. If previous works have shown contrasting features between them, whether such categorization matters for phenotype prediction remains to be studied.

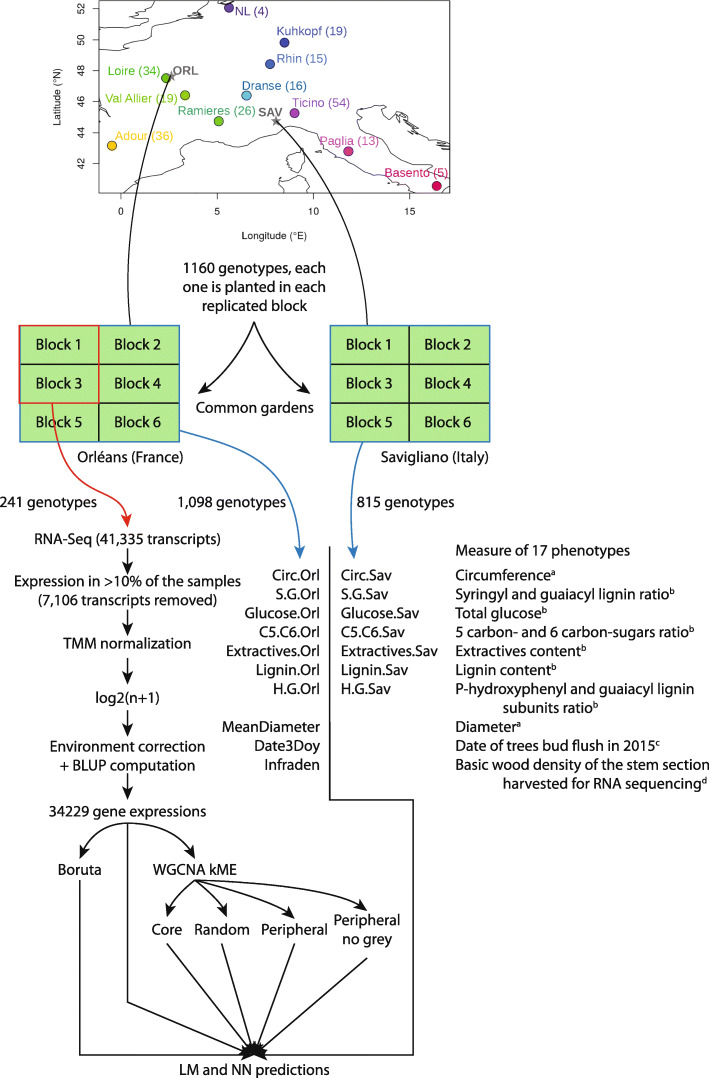
Results: We measured 17 phenotypic traits for 241 cloned genotypes from a Populus nigra collection, covering growth, phenology, chemical and physical properties. We also sequenced RNA for each genotype and built co-expression networks to define core and peripheral genes. We found that cores were more differentiated between populations than peripherals while being less variable, suggesting that they have been constrained through potentially divergent selection. We also showed that while cores were overrepresented in a subset of genes statistically selected for their capacity to predict the phenotypes (by Boruta algorithm), they did not systematically predict better than peripherals or even random genes.

Conclusion: Our work is the first attempt to assess the importance of co-expression network connectivity in phenotype prediction. While highly connected core genes appear to be important, they do not bear enough information to systematically predict better quantitative traits than other gene sets.

Keywords: Boruta; Core; Machine learning; Peripheral; Populus nigra.


Conflict of interest statement

The authors declare that they have no competing interests.

Figures

Fig. 1
Fig. 1
General sketch of the experiment. From the top to the bottom: Map of the location of the different populations sampled for this experiment, the number of individuals used for the RNA sequencing is indicated between parentheses. From these populations, genotypes were collected and planted in 2 locations (Orléans, in central France, and Savigliano, in northern Italy). At each site, we planted 6 clones of each genotype, 1 in each of the 6 blocks, and their position in each block was randomized. For all the blocks, we collected phenotypes: 10 in Orléans (circumference, S/G, glucose, C5/C6, extractives, lignin, H/G, diameter, infradensity and date of bud flush) and 7 in Savigliano (circumference, S/G, glucose, C5/C6, extractives, lignin, H/G). Only on the clones of 2 blocks in Orléans, we performed the RNA sequencing and treatment of data. The treated RNA-seq data were used with different algorithms and in different sets to predict the phenotypes measured on the same trees (in Orléans) or on the same genotype but on different trees (in Savigliano). Trait category: aGrowth, bChemical, cPhenology, dPhysical
Fig. 2
Fig. 2
WGCNA analysis of gene expression data. a: Selection of the soft threshold (green dot) based on the correlation maximization with scale-free topology (left panel) producing low mean connectivity (right panel). b: Gene expression hierarchical clustering dendrogram, based on the Spearman correlations (top panel), resulting in clusters identified by colors (first line of the bottom panel). Spearman correlations between gene expressions and traits values are represented as color bands on the other lines of the bottom panel, from highly negative correlations (dark blue) to highly positive correlations (light yellow), according to the scale displayed in panel C. c: Spearman correlation between eigengenes (the best theoretical representative of a gene expression module) of modules identified in the previous panel and traits, again on a dark blue (highly negative) to light yellow (highly positive) scale. Stars in the tiles designate correlations with a significant p-value (lower than 5%) after Bonferroni correction. D: Focus on two modules from the previous graph, representing gene expression correlation with the circumference in Savigliano against centrality in the module. These two panels represent the strongest (right panel, magenta module, R2 = 0.86) and the weakest (left panel, brown module, R2 = 0.09) correlations with the corresponding trait
Fig. 3
Fig. 3
Characteristics of several gene sets. Heritability h2, differentiation QST, gene mean expression (in counts per million, power 0.2), genetic variation coefficient CVg (power 0.05), overall gene diversity Ht and PCadaptscore (power 0.2) violin and box plots with median (black line) and interquartile range (black box) for each of the core (in blue), random (in grey), peripheral NG (in orange) and peripheral (in brown) gene sets
Fig. 4
Fig. 4
Predictions scores on test sets. Predictions scores on test sets (R2 on the y axis) for the 2 algorithms (LM Ridge, top panel; neural network, bottom panel) for each phenotypic trait (on the x axis). The color of each bar represents the gene set that has been used for the prediction. Intervals for the random set represent the 95% confidence interval of the distribution of the 100 different realizations, while the height of the bar corresponds to the median. The "+" and "-" signs above the bars indicate predictions respectively above and below the 95% confidence interval of the random set

References

    1. Mackay TFC, Stone Ea, Ayroles JF. The genetics of quantitative traits: challenges and prospects. Nat Rev Genet. 2009;10(8):565–77. - PubMed
    1. Han Y, Gao S, Muegge K, Zhang W, Zhou B. Advanced Applications of RNA Sequencing and Challenges. Bioinforma Biol Insights. 2015;9s1:28991. - PMC - PubMed
    1. Josephs EB, Wright SI, Stinchcombe JR, Schoen DJ. The Relationship between Selection, Network Connectivity, and Regulatory Variation within a Population of Capsella grandiflora. Genome Biol Evol. 2017;9(4):1099–109. - PMC - PubMed
    1. Mähler N, Wang J, Terebieniec BK, Ingvarsson PK, Street NR, Hvidsten TR. Gene co-expression network connectivity is an important determinant of selective constraint. PLOS Genet. 2017;13(4):1006402. - PMC - PubMed
    1. Langfelder P, Horvath S. WGCNA: an R package for weighted correlation network analysis. BMC Bioinformatics. 2008;9(1):559. - PMC - PubMed