. 2020 Jun 22;20(1):585.
doi: 10.1186/s12885-020-07075-x.

Immune-related genes in tumor-specific CD4+ and CD8+ T cells in colon cancer

Affiliations

Immune-related genes in tumor-specific CD4+ and CD8+ T cells in colon cancer

Xi Yang et al. BMC Cancer. .

Abstract

Background: Immune escape is an immunological mechanism underlying tumorigenesis, and T cells play an important role in this process. In this study, immune-related genes were evaluated in tumor-infiltrating CD4+ and CD8+ T cells in colon cancer.

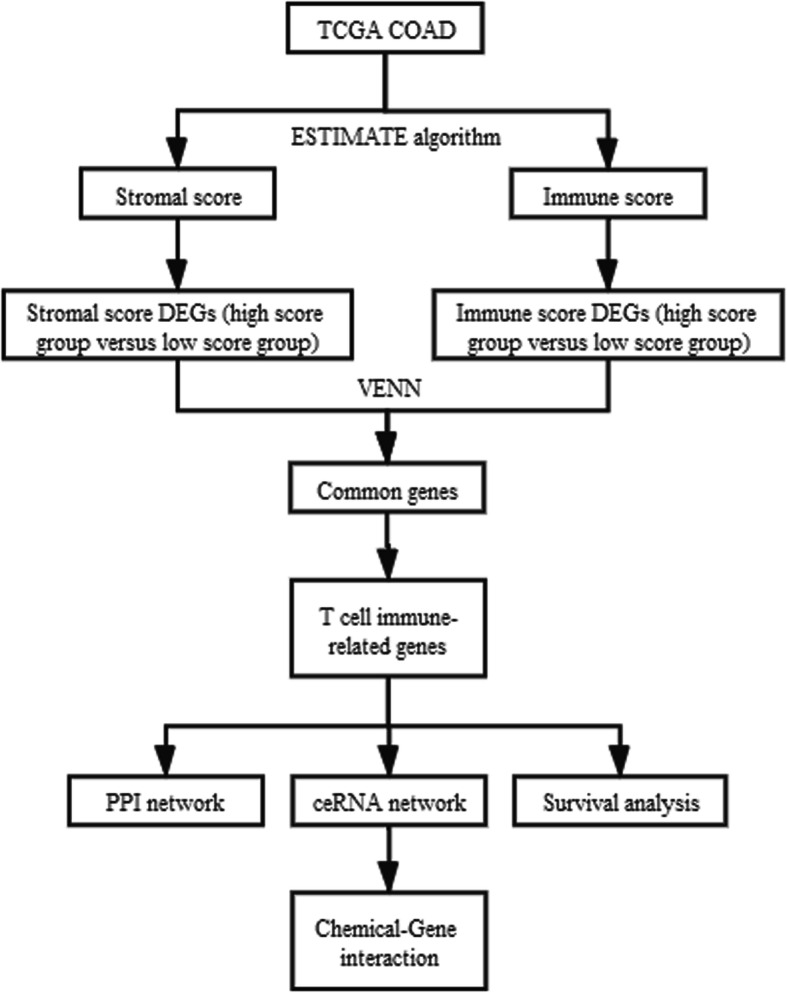
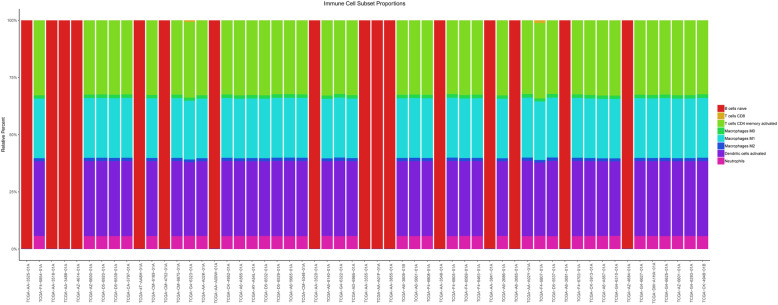
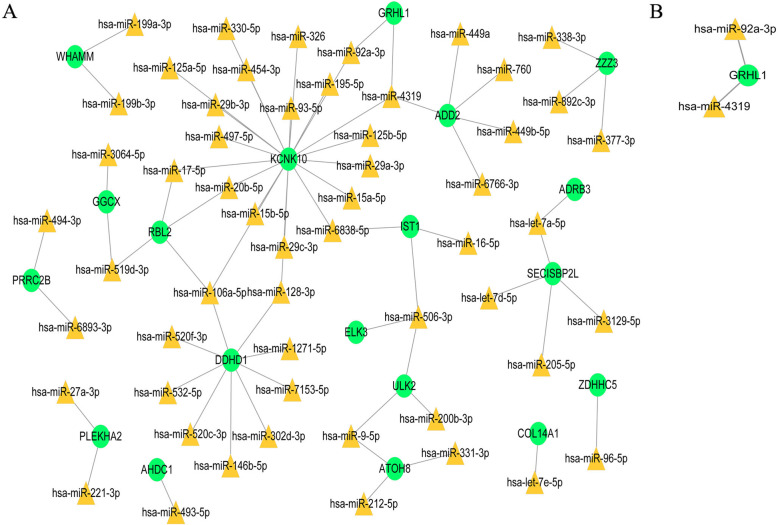
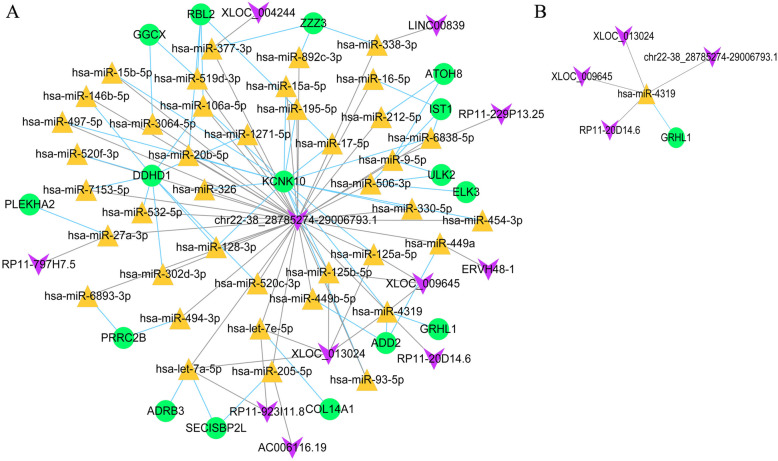
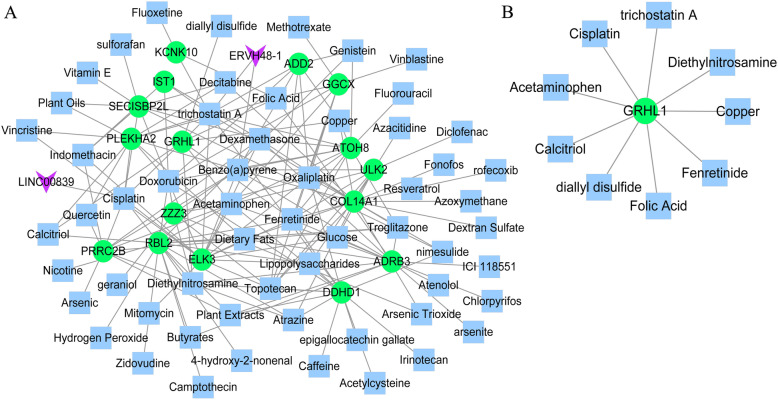
Methods: ESTIMATE was used to calculate stromal and immune scores for tumor datasets downloaded from The Cancer Genome Atlas-Colon Cancer (COAD). Differentially expressed genes (DEGs) between samples with high and low stromal and immune scores were screened, followed by a functional enrichment analysis of the overlapping DEGs. The DEGs related to CD4+ and the CD8+ T cells were then screened. Predicted miRNA-mRNA and lncRNA-miRNA pairs were used to construct a competing endogenous RNA (ceRNA) network. Furthermore, chemical-gene interactions were predicted for genes in the ceRNA network. Kaplan-Meier survival curves were also plotted.

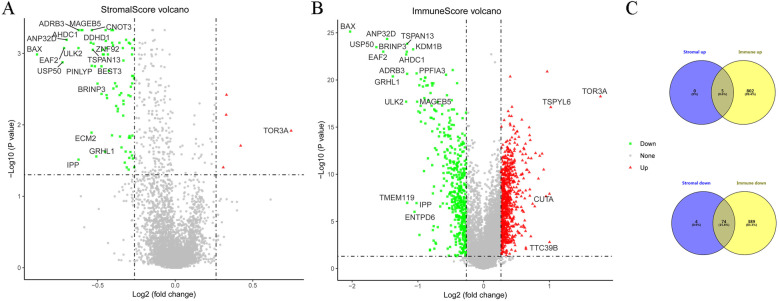
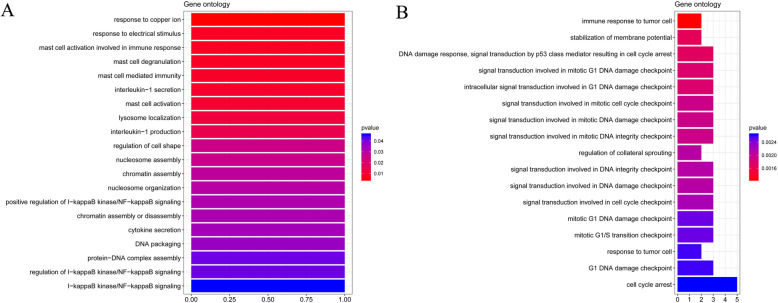
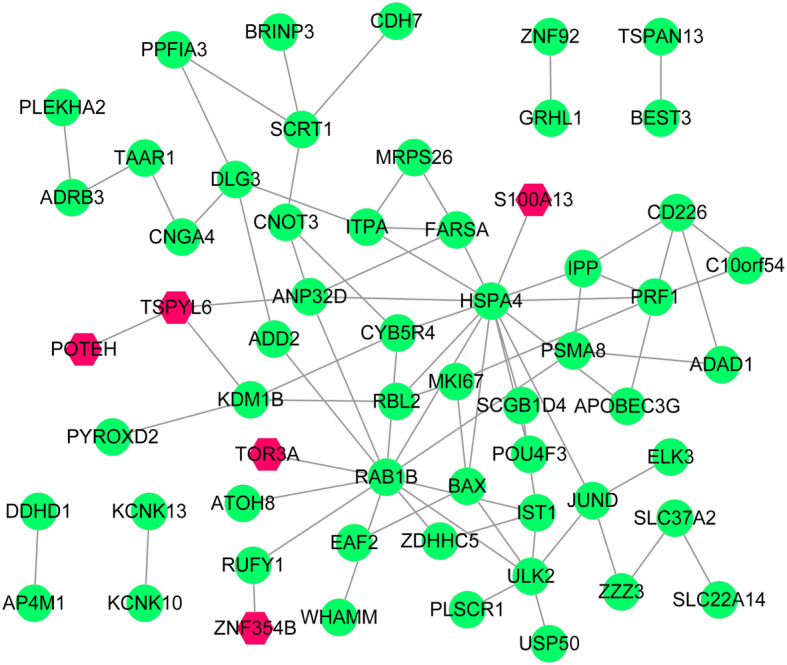
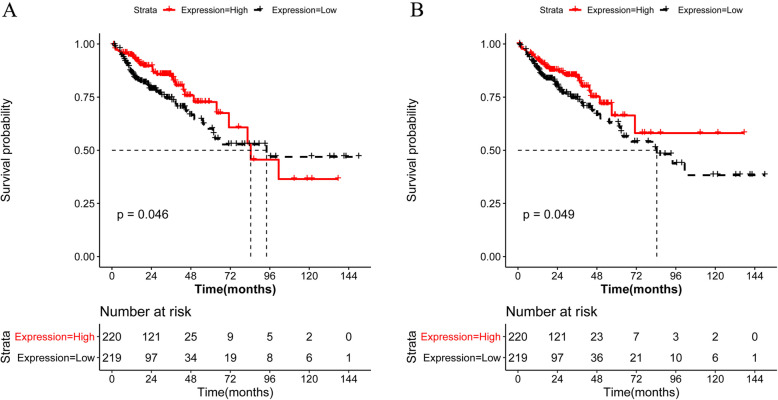
Results: In total, 83 stromal-related DEGs (5 up-regulated and 78 down-regulated) and 1270 immune-related DEGs (807 up-regulated and 293 down-regulated genes) were detected. The 79 overlapping DEGs were enriched for 39 biological process terms. Furthermore, 79 CD4+ T cell-related genes and 8 CD8+ T cell-related genes, such as ELK3, were screened. Additionally, ADAD1 and DLG3, related to CD4+ T cells, were significantly associated with the prognosis of patients with colon cancer. The chr22-38_28785274-29,006,793.1-miR-106a-5p-DDHD1 and chr22-38_28785274-29,006,793.1-miR-4319-GRHL1 axes obtained from CD4+ and CD8+ T cell-related ceRNAs were identified as candidates for further studies.

Conclusion: ELK3 is a candidate immune-related gene in colon cancer. The chr22-38_28785274-29,006,793.1-miR-106a-5p-DDHD1 and chr22-38_28785274-29,006,793.1-miR-4319-GRHL1 axes may be related to CD4+ and CD8+ T cell infiltration in colon cancer.

Keywords: CD4+ T cells; CD8+ T cells; Colon cancer; Competing endogenous RNAs; Immunity.


Conflict of interest statement

The authors declare that no conflicts of interest exist.

Figures

Fig. 1
Fig. 1
Workflow of dataset processing
Fig. 2
Fig. 2
Gene expression profiles for colon cancer tissue samples. Volcano plot showing the expression profiles of genes in groups with high or low stromal scores (a) and with high or low immune scores (b). The red and green dots in the volcano plot represent up-regulated and down-regulated genes, respectively. Venn diagram (c) showing overlapping differentially expressed genes in analyses of genes related to stromal scores and immune scores. The GDC TCGA Colon Cancer (COAD) dataset (version 07-19-2019) was downloaded from TCGA (https://xenabrowser.net/). For the analysis of the infiltrating stromal and immune cells in tumor tissues, Estimation of STromal and Immune cells in MAlignant Tumours using Expression data (ESTIMATE, version 1.0.13) implemented in R was used
Fig. 3
Fig. 3
Enrichment analysis of common differentially expressed genes. Gene ontology biological process term enrichment analysis of up-regulated genes (a) and down-regulated genes (b)
Fig. 4
Fig. 4
Infiltration of immune cells in colon cancer. Bar charts indicate the infiltration abundance of different immune cells. The abscissa axis represents the sample name. The longitudinal axis represents the relative percent of different types of infiltrating immune cells. Different colors indicate different types of infiltrating immune cells (B cells, CD4+ T cells, CD8+ T cells, Neutrphils, Macrophages and Dendritic cells)
Fig. 5
Fig. 5
Protein–protein interaction networks. Protein–protein interaction network of CD4+ T cell-related genes. Red hexagons represent up-regulated genes and green nodes represent down-regulated genes
Fig. 6
Fig. 6
MiRNA–target regulatory networks. MiRNA–target regulatory networks of CD4+ T cell-related genes (a) and CD8+ T cell-related genes (b). Green nodes represent down-regulated genes. Yellow triangles represent microRNAs
Fig. 7
Fig. 7
Competing endogenous RNAs (ceRNA) networks. eRNA networks of CD4+ T cell-related genes (a) and CD8+ T cell-related genes (b). Green nodes represent down-regulated genes. Yellow triangles represent microRNAs. Purple inverted triangles represent long non-coding RNAs
Fig. 8
Fig. 8
Chemical–gene interaction networks. Chemical–gene interactions were predicted for the genes in the competing endogenous RNA (ceRNA) networks by using the CTD database. The chemical–gene interaction network of genes in the CD4+ T cell-related ceRNA network (a) and CD8+ T cell-related ceRNA network (b). Green nodes represent down-regulated genes. Blue squares represent small chemical molecules. Purple inverted triangles represent long non-coding RNAs
Fig. 9
Fig. 9
Kaplan–Meier curves of overall survival in patients with colon cancer. After screening for differentially expressed genes associated with survival, adenosine deaminase domain containing 1 (ADAD1) and the discs large MAGUK scaffold protein 3 (DLG3) were selected from 77 CD4+ T cell-related genes. There were no survival-related differentially expressed genes among the eight CD8+ T cell-related genes. Kaplan–Meier curves of overall survival showing prognosis for ADAD1 (a) and DLG3 (b)

References

    1. Arnold M, et al. Global patterns and trends in colorectal cancer incidence and mortality. Gut. 2017;66(4):683–691. - PubMed
    1. van der Stok EP, et al. Surveillance after curative treatment for colorectal cancer. Nat Rev Clin Oncol. 2017;14(5):297. - PubMed
    1. Vasan N, Baselga J, Hyman DM. A view on drug resistance in cancer. Nature. 2019;575(7782):299–309. - PMC - PubMed
    1. Zaidi N, Jaffee EM. Immunotherapy transforms cancer treatment. J Clin Invest. 2019;129(1):46–47. - PMC - PubMed
    1. Canning C, et al. Liver immunity and tumour surveillance. Immunol Lett. 2006;107(2):83–88. - PubMed

MeSH terms

Substances