. 2020 Jul 30;13(7):dmm044768.
doi: 10.1242/dmm.044768.

A lineage-tracing tool to map the fate of hypoxic tumour cells

Affiliations

A lineage-tracing tool to map the fate of hypoxic tumour cells

Jenny A F Vermeer et al. Dis Model Mech. .

Abstract

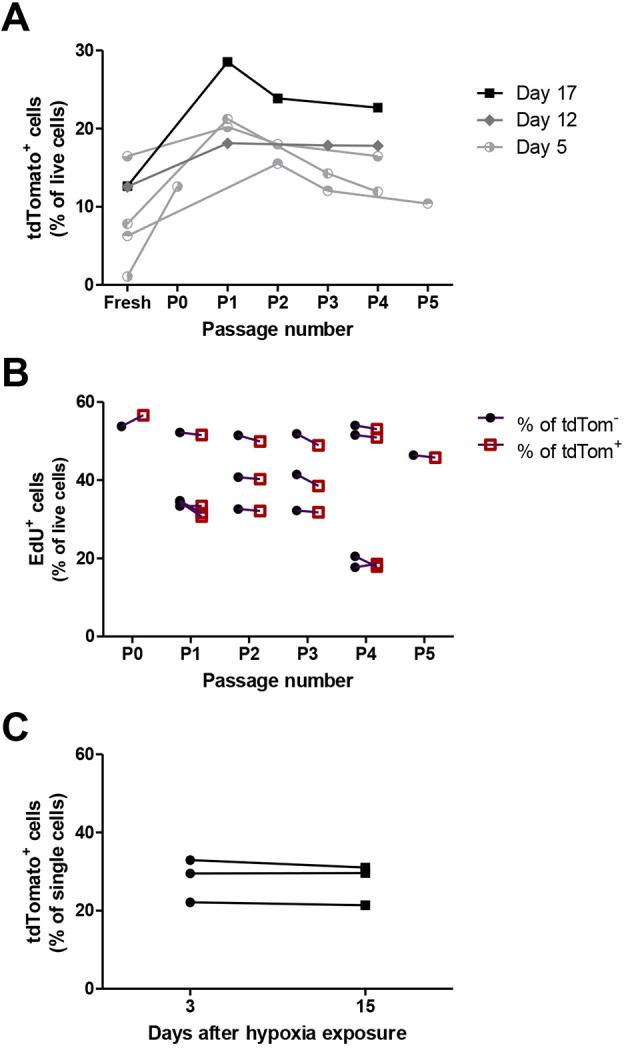
Intratumoural hypoxia is a common characteristic of malignant treatment-resistant cancers. However, hypoxia-modification strategies for the clinic remain elusive. To date, little is known on the behaviour of individual hypoxic tumour cells in their microenvironment. To explore this issue in a spatial and temporally controlled manner, we developed a genetically encoded sensor by fusing the O2-labile hypoxia-inducible factor 1α (HIF-1α) protein to eGFP and a tamoxifen-regulated Cre recombinase. Under normoxic conditions, HIF-1α is degraded but, under hypoxia, the HIF-1α-GFP-Cre-ERT2 fusion protein is stabilised and in the presence of tamoxifen activates a tdTomato reporter gene that is constitutively expressed in hypoxic progeny. We visualise the random distribution of hypoxic tumour cells from hypoxic or necrotic regions and vascularised areas using immunofluorescence and intravital microscopy. Once tdTomato expression is induced, it is stable for at least 4 weeks. Using this system, we could show in vivo that the post-hypoxic cells were more proliferative than non-labelled cells. Our results demonstrate that single-cell lineage tracing of hypoxic tumour cells can allow visualisation of their behaviour in living tumours using intravital microscopy. This tool should prove valuable for the study of dissemination and treatment response of post-hypoxic tumour cells in vivo at single-cell resolution.This article has an associated First Person interview with the joint first authors of the paper.

Keywords: Cre recombinase; HIF; Hypoxia; Intravital imaging; Lineage tracing; NSCLC tumour.


Conflict of interest statement

Competing interestsThe authors declare no competing or financial interests.

Figures

Fig. 1.
Fig. 1.
H1299-MARCer reporter (H1299-MR) cells were created. (A) Constructs used for transduction of H1299 cells. (B) Western blot analysis of HIF-1α-MARCer and endogenous HIF-1α (HIF-1α-E) after exposure of H1299-MARCer cells to hypoxia (0.2% O2) in vitro and re-oxygenation. Lamin A was used as a loading control and the HIF-stabilising agent DFO was used as a positive control. (C,D) Fluorescence-activated cell sorting (FACS) plots of eGFP and tdTomato expression after exposure to hypoxia (0.1% O2) for 24 h (C, left) and 24 h of hypoxia followed by 24 h of re-oxygenation (D, left). Representative images of MARCer stabilisation via eGFP taken after 24 h exposure to hypoxia (0.2% O2) (C, right) and after a further 24 h of re-oxygenation of tdTomato expression (D, right) are also shown. Scale bars: 200 µm. (E) Flow cytometric analysis of eGFP and tdTomato expression after exposure to increasing times of hypoxia (0.1% O2) in the presence of 4-hydroxytamoxifen (4-OHT). Time point ‘0’ is showing cells cultured under normoxia in the presence of 4-OHT for 24 h. Dots represent independent experiments carried out in duplicate and coloured bars indicate averages. ##P<0.01 indicates a difference in tdTomato expression between no hypoxia and 2 h, and ###P<0.001 shows the difference in tdTomato expression for 0 versus 4, 6, and 24 h. *P<0.05 and **P<0.01 show a difference for eGFP expression as indicated, and ***P<0.001 indicates a significantly higher eGFP expression after 24 h compared to 0, 2 and 4 h, as calculated by one-way ANOVA followed by Bonferroni's multiple comparison. (F) Flow cytometric analysis of eGFP and tdTomato expression after exposure to 24 h hypoxia (0.1% O2) followed by increasing times of re-oxygenation. It should be noted that time point ‘0’ is showing the same data presented in E as 24 h. Dots represent independent experiments carried out in duplicate and coloured bars indicate averages.
Fig. 2.
Fig. 2.
eGFP and tdTomato expression and quantification of immunofluorescent staining of H1299-MR xenografts. (A) One single administration of tamoxifen by oral gavage induced tdTomato expression in H1299-MR xenografts as measured by flow cytometry 2 days after administration. Dots represent individual mice and bars indicate averages. (B) From 5 days after administration of 10 mg tamoxifen, tdTomato expression was significantly induced. ###P<0.001 compared to no tamoxifen, ***P<0.001 as determined by one-way ANOVA and Bonferroni's multiple comparison. (C) Micrograph of EF5 staining showing a necrotic area (dashed line) surrounded by close and more distant EF5+ staining. Scale bar: 30 µm. (D) EF5 quantification showing hypoxic area as a percentage of total tumour area. (E) Distance of tdTomato+ cells to EF5+ areas normalised to all cells (Hoechst; Fig. S2C). (F) Cells inside hypoxic areas as a percentage of all cells or tdTomato+ cells. (G) CD31 staining showing vessel density as a percentage of total tumour area. (H) Distance of tdTomato+ to CD31+ areas normalised to all cells (Hoechst; Fig. S2D). For staining (D-H), one to five sections per tumour, separated by ∼1 mm, were analysed and the average was indicated by the dots, whereas the bars indicate the average of all mice in the group. TAM, tamoxifen.
Fig. 3.
Fig. 3.
Immunofluorescent staining of H1299-MR xenografts. (A) Quantification of RFP staining showing that more tdTomato+ cells can be detected after staining than when only intrinsic tdTomato was imaged by epifluorescence microscopy. Dots represent the average of one to five sections per tumour, separated by ∼1 mm. ***P<0.001 as determined by two-way ANOVA followed by Bonferroni's multiple comparison. (B) RFP staining and intrinsic tdTomato on frozen sections significantly correlate. (C) RFP staining and intrinsic tdTomato significantly correlate with tdTomato cells measured by flow cytometry. (D) Micrographs of consecutive sections showing that CD31 staining (left) and RFP staining (right) do not show a clear correlation with EF5 staining (middle). Scale bars: 500 µm (top row), 50 µm (bottom row). TAM, tamoxifen.
Fig. 4.
Fig. 4.
Post-hypoxic H1299-MR cells proliferate faster than non-hypoxic tumour cells. (A,B) EdU assay showing that tdTomato+ cells proliferated faster than the tdTomato population as measured by flow cytometry (A) and immunofluorescence (B). (C) Gating strategy of EdU incorporation in tdTomato and tdTomato+ human cells (RL1-A+). (D) EdU proliferation assay showing that tdTomato+ human cells proliferated faster than the tdTomato human cells. Dots represent individual mice and paired observations were connected with a line. n.s., non-significant; *P<0.05, **P<0.01, ***P<0.001 as determined by two-way ANOVA followed by Bonferroni's multiple comparison. TAM, tamoxifen.
Fig. 5.
Fig. 5.
Post-hypoxic tumour cells and non-hypoxic cells proliferate at similar rates ex vivo and in vitro. (A,B) Cells isolated from H1299-MR xenografts were cultured ex vivo under geneticin and blasticidin selection. Individual tumours were depicted and connected with a line. (A) tdTomato expression initially increased and stabilised after several cultured passages as measured by flow cytometry. (B) In ex vivo culture, tdTomato+ and tdTomato cells proliferate similarly, as shown by EdU incorporation measured by flow cytometry. (C) H1299-MR cells were incubated at 21% and 0.2% O2 with 200 nm 4-OHT for 24 h before being mixed in a 1:1 ratio and grown in DMEM containing 1% FBS. tdTomato expression was then analysed and proved similar after 3 and 15 days.
Fig. 6.
Fig. 6.
H1299-MR xenografts visualised using intravital microscopy. (A) 3D maximum-intensity projection (left) and one slice of the same tumour (right) imaged 4 days after administration of tamoxifen. Perfused vessels are shown in purple, eGFP+ cells in green, tdTomato+ cells in red and collagen in cyan (second harmonic generation microscopy, right panel only). Channel arithmetics was applied using MATLAB to subtract GFP bleed through into the tdTomato channel and tdTomato bleed through into the Qtracker 705 channel. Scale bars: 500 µm (B) Vessel segmentation (grey) and tdTomato+ cells shown in the colour spectrum, indicating the distance to perfused vessels (0 µm in purple to 151 µm in red). Scale bars: 500 µm (left) and 50 µm (right). (C) Perfused vessel volume as a percentage of total tumour volume in four mice followed over time. TAM, tamoxifen.

References

    1. Al Tameemi W., Dale T. P., Al-Jumaily R. M. K. and Forsyth N. R. (2019). Hypoxia-Modified Cancer Cell Metabolism. Frontiers in Cell and Developmental Biology, 7, 1-15. - PMC - PubMed
    1. Blouw B., Song H., Tihan T., Bosze J., Ferrara N., Gerber H.-P., Johnson R. S. and Bergers G. (2003). The hypoxic response of tumors is dependent on their microenvironment. Cancer Cell 4, 133-146. 10.1016/s1535-6108(03)00194-6 - DOI - PubMed
    1. Brahimi-Horn M. C., Chiche J. and Pouysségur J. (2007). Hypoxia and cancer. J. Mol. Med., 85, 1301-1307. 10.1007/s00109-007-0281-3 - DOI - PubMed
    1. Campeau E., Ruhl V. E., Rodier F., Smith C. L., Rahmberg B. L., Fuss J. O. and Kaufman P. D. (2009). A versatile viral system for expression and depletion of proteins in mammalian cells. PLoS One, 4 10.1371/journal.pone.0006529 - DOI - PMC - PubMed
    1. Conway J. R. W., Warren S. C., Herrmann D., Murphy K. J., Cazet A. S., Vennin C. and Timpson P. (2018). Intravital Imaging to Monitor Therapeutic Response in Moving Hypoxic Regions Resistant to PI3K Pathway Targeting in Pancreatic Cancer. Cell Rep. 23, 3312-3326. 10.1016/j.celrep.2018.05.038 - DOI - PMC - PubMed

Publication types

MeSH terms