. 2020 Aug 1;205(3):595-607.
doi: 10.4049/jimmunol.2000088. Epub 2020 Jun 22.

BCALM (AC099524.1) Is a Human B Lymphocyte-Specific Long Noncoding RNA That Modulates B Cell Receptor-Mediated Calcium Signaling

Affiliations

BCALM (AC099524.1) Is a Human B Lymphocyte-Specific Long Noncoding RNA That Modulates B Cell Receptor-Mediated Calcium Signaling

Sarah C Pyfrom et al. J Immunol. .

Abstract

Of the thousands of long noncoding RNAs (lncRNA) identified in lymphocytes, very few have defined functions. In this study, we report the discovery and functional elucidation of a human B cell-specific lncRNA with high levels of expression in three types of B cell cancer and normal B cells. The AC099524.1 gene is upstream of the gene encoding the B cell-specific phospholipase C γ 2 (PLCG2), a B cell-specific enzyme that stimulates intracellular Ca2+ signaling in response to BCR activation. AC099524.1 (B cell-associated lncRNA modulator of BCR-mediated Ca+ signaling [BCALM]) transcripts are localized in the cytoplasm and, as expected, CRISPR/Cas9 knockout of AC099524.1 did not affect PLCG2 mRNA or protein expression. lncRNA interactome, RNA immunoprecipitation, and coimmunoprecipitation studies identified BCALM-interacting proteins in B cells, including phospholipase D 1 (PLD1), and kinase adaptor proteins AKAP9 (AKAP450) and AKAP13 (AKAP-Lbc). These two AKAP proteins form signaling complexes containing protein kinases A and C, which phosphorylate and activate PLD1 to produce phosphatidic acid (PA). BCR stimulation of BCALM-deficient B cells resulted in decreased PLD1 phosphorylation and increased intracellular Ca+ flux relative to wild-type cells. These results suggest that BCALM promotes negative feedback that downmodulates BCR-mediated Ca+ signaling by promoting phosphorylation of PLD1 by AKAP-associated kinases, enhancing production of PA. PA activates SHP-1, which negatively regulates BCR signaling. We propose the name BCALM for B-Cell Associated LncRNA Modulator of BCR-mediated Ca+ signaling. Our findings suggest a new, to our knowledge, paradigm for lncRNA-mediated modulation of lymphocyte activation and signaling, with implications for B cell immune response and BCR-dependent cancers.


Figures

Figure 1.
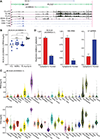
Figure 1.. LncRNA BCALM (AC099524.1) is highly and specifically expressed in B lymphocytes.
A) UCSC Genome Browser screenshot shows the genomic locus containing AC099524.1 and flanking genes. Tracks below show gene expression in representative samples of primary B cell cancers from WUSM patients (CLL412, DL135, FL313), non-malignant CD19+ B and CD4+ and CD8+ T cells, and a lung adenocarcinoma cell line (A549) (RNA-seq, normalized transcripts per million). B) Expression of BCALM in purified B cells from WUSM B cell cancer primary samples and normal B cells (RNA-seq, RPKM = reads per million per kilobase, log10). (unpaired two-tailed t-test with Welch’s correction, n.s., not significant for any comparison between B cell cancer groups; *** p < 0.001) C) Violin plots show expression of BCALM and nearby coding gene PLCG2 across 27 different cell and tissue types (RNA-seq, TPM = transcripts per million, log10, gtexportal.org). D) Subcellular localization of RNA transcripts measured by qRT-PCR following fractionation of OCI-Ly7 lymphoma cells. (Fold change relative to same transcript in cytoplasm, mean ± SD). Data are representative of at least three independent experiments (D).
Figure 2.
Figure 2.. Active regulatory elements are distributed throughout the CMIP/AC099524.1/PLCG2 locus.
A) UCSC Genome Browser screenshot shows the genomic locus containing AC099524.1 and flanking genes. Putative regulatory regions assayed by luciferase reporter in (B) are labeled A-M and blue or green bars correspond to their size and location (blue: putative enhancer, green: promoter region of AC099524.1). Purple bars show peaks of DNase I hypersensitivity and tracks below show CTCF and EP300 peaks (GM12878 B cells, ENCODE(47)). Lower tracks show histone acetylation peaks (H3K27ac, H3ac) in representative WU lymphoma and non-malignant B cell samples (ChIP-seq, normalized reads per million). B) Bar graphs show luciferase reporter activity normalized to empty vector for each of the indicated regions in (A). (mean ± SD for 2–3 experiments; unpaired two-tailed t-test with Welch’s correction, * p < 0.05; ** p < 0.01; *** p < 0.001; **** p < 0.0001).
Figure 3.
Figure 3.. Knockout of BCALM (AC099524.1) does not affect PLCG2 expression or phosphorylation.
A) Diagram depicts the locations of CRISPR/Cas9 targeting gRNAs for gene editing of AC099524.1 (red and blue triangles). B) Expression of AC099524.1 in U2932 lymphoma cell line subclones post gene editing. Measured by qRT-PCR, normalized to GAPDH, and shown relative to Wild type (WT). gRNA pairs 1/3 and 1/4 were used for gene editing and are indicated. (mean ± SD; homozygous (KO); genomic PCR in Fig. S2A–C) C) Western blots show levels of phosphorylated and total PLCG2 protein after BCR stimulation with anti-IgM in U2932 WT and KO cells. GAPDH is a loading control. D) Expression of AC099524.1 in OCI-Ly7 lymphoma cell line subclones post gene editing, as in B. (heterozygous (Het); genomic PCR in Fig. S2A–C). E) Western blots of OCI-Ly7 cells treated as in C. Representative of at least 2 independent experiments (B-E)
Figure 4.
Figure 4.. BCALM (AC099524.1) interacts with RNA binding and signaling transduction proteins.
A) Diagram of sense and anti-sense BCALM oligos used in B. B) Silver stained SDS-PAGE gel shows proteins in input whole cell lysate, sense and anti-sense BCALM pull-down, and beads alone control. Asterisks mark bands that are enriched in sense BCALM pull-down. C) Proteins identified by mass spectrometry after pull-down as in (B) and plotted by log2 fold change of sense:anti-sense BCALM for peptide number and signal intensity. D) (Left panel) Silver stain of high molecular weight gel showing bands enriched in sense AC099524.1 pull-down compared to anti-sense (asterisks). (Right panel) Table of peptides identified by mass spectrometry from the highlighted gel bands. E) Western blots confirm BCALM pull-down of proteins highlighted in C. F) Bar graph shows relative amount of BCALM transcript pulled down by RIP of the indicated proteins. (qRT-PCR, unpaired two-tailed t-test * p < 0.05; **** p < 0.0001) G) Western blots confirm immunoprecipitation of indicated proteins from RIP in F. (Representative of at least 2 independent experiments, B-G.)
Figure 5.
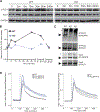
Figure 5.. Loss of BCALM (AC099524.1) decreased PLD1 phosphorylation and increased calcium flux after BCR stimulation.
A) Western blots show levels of phosphorylated and total PLD1 protein after BCR stimulation with anti-IgM in OCI-Ly7 WT and KO cells. GAPDH is a loading control. B) Line graph shows the ratio of phospho-PLD1 to total PLD1 from A. C) Western blots show co-immunoprecipitation of AKAP9 with anti-PLD1 antibody in WT but not in BCALM KO OCI-Ly7 cells. (arrowheads: IB target protein bands, asterisks: non-specific bands) D) Indo1 ratio measures the calcium flux in OCI-Ly7 WT, Het, and KO cells after addition of anti-IgM (vertical dotted line). Solid or dashed lines with intervening grey shading indicate the mean, 10th and 90th percentiles of 3 replicates. Representative of at least 2 independent experiments (A - D).
Figure 6.
Figure 6.. Model for BCALM transcript modulation of calcium flux after BCR stimulation.
A) After IgM-stimulation, BCR-associated kinases are activated and phosphorylate and activate PLCG2, which hydrolyzes PIP2 to DAG and IP3. IP3 stimulates Ca+ release from ER (endoplasmic reticulum) stores. DAG stimulates PKC, which associates with kinase-anchoring (AKAP) proteins. BCALM associates with AKAP proteins 9 and 13 and with PLD1, and thus may facilitate phosphorylation and activation of PLD1 by PKC and/or PKA. PA produced by activated PLD1 activates SHP-1, which dephosphorylates BCR-associated kinases, resulting in a downregulation of BCR signaling. B) Loss of BCALM decreased the association of PLD1 with AKAP9 and decreased PLD1 phosphorylation, the latter of which activates PLD1. Reduced PLD1 activity decreases PA production and results in less activation of SHP-1, decreasing the inhibition of BCR signaling. In sum, loss of BCALM could result in increased calcium flux via decreased feedback inhibition after BCR stimulation. (Green arrows = activation; red blunt-ended lines = inhibition; dark grey arrows = hydrolysis; pink arrows = passage through an ion channel.)

References

    1. Koues OI, Kowalewski RA, Chang L-W, Pyfrom SC, Schmidt JA, Luo H, Sandoval LE, Hughes TB, Bednarski JJ, Cashen AF, Payton JE, and Oltz EM. 2015. Enhancer sequence variants and transcription-factor deregulation synergize to construct pathogenic regulatory circuits in B-cell lymphoma. Immunity 42: 186–198. - PMC - PubMed
    1. Cyster JG, and Allen CDC. 2019. B Cell Responses: Cell Interaction Dynamics and Decisions. Cell 177: 524–540. - PMC - PubMed
    1. Huang Y, Koues OI, Zhao J, Liu R, Pyfrom SC, Payton JE, and Oltz EM. 2017. cis-Regulatory Circuits Regulating NEK6 Kinase Overexpression in Transformed B Cells Are Super-Enhancer Independent. Cell Rep. 18: 2918–2931. - PMC - PubMed
    1. Huarte M 2015. The emerging role of lncRNAs in cancer. Nat. Med. 21: 1253–1261. - PubMed
    1. Chen YG, Satpathy AT, and Chang HY. 2017. Gene regulation in the immune system by long noncoding RNAs. Nat. Immunol. 18: 962–972. - PMC - PubMed

Publication types

MeSH terms