. 2020 Jul 7;117(27):16072-16082.
doi: 10.1073/pnas.1918937117. Epub 2020 Jun 22.

Circulating immune cell phenotype dynamics reflect the strength of tumor-immune cell interactions in patients during immunotherapy

Affiliations

Circulating immune cell phenotype dynamics reflect the strength of tumor-immune cell interactions in patients during immunotherapy

Jason I Griffiths et al. Proc Natl Acad Sci U S A. .

Abstract

The extent to which immune cell phenotypes in the peripheral blood reflect within-tumor immune activity prior to and early in cancer therapy is unclear. To address this question, we studied the population dynamics of tumor and immune cells, and immune phenotypic changes, using clinical tumor and immune cell measurements and single-cell genomic analyses. These samples were serially obtained from a cohort of advanced gastrointestinal cancer patients enrolled in a trial with chemotherapy and immunotherapy. Using an ecological population model, fitted to clinical tumor burden and immune cell abundance data from each patient, we find evidence of a strong tumor-circulating immune cell interaction in responder patients but not in those patients that progress on treatment. Upon initiation of therapy, immune cell abundance increased rapidly in responsive patients, and once the peak level is reached tumor burden decreases, similar to models of predator-prey interactions; these dynamic patterns were absent in nonresponder patients. To interrogate phenotype dynamics of circulating immune cells, we performed single-cell RNA sequencing at serial time points during treatment. These data show that peripheral immune cell phenotypes were linked to the increased strength of patients' tumor-immune cell interaction, including increased cytotoxic differentiation and strong activation of interferon signaling in peripheral T cells in responder patients. Joint modeling of clinical and genomic data highlights the interactions between tumor and immune cell populations and reveals how variation in patient responsiveness can be explained by differences in peripheral immune cell signaling and differentiation soon after the initiation of immunotherapy.

Keywords: cancer; ecological models; immunotherapy; phenotypes; single-cell RNA sequencing.


Conflict of interest statement

Competing interest statement: S.S. reports clinical trial funding from Merck for this study, which did not support the research in this paper; clinical research funding from Novartis, GSK, Millennium, MedImmune, Johnson & Johnson, Gilead Sciences, Plexxikon, Onyx, Bayer, Blueprint Medicines, XuanZhu, Incyte, Toray Industries, Celgene, Hengrui Therapeutics, OncoMed, Tesaro, AADi, and Syndax outside the submitted work; equity from Salarius Pharmaceuticals, Iterion Therapeutics, Proterus Therapeutics, ConverGene, and Stingray Therapeutics outside the submitted work; and honoraria from Blend Therapeutics, Foundation Medicine, Guardant Health, Novartis, ARIAD, US Oncology, Exelixis, Genesis Biotechnology Group, LSK, Natera, Loxo Oncology, Hengrui Therapeutics, Tarveda Therapeutics, and Dracen Pharmaceuticals outside the submitted work. D.S. reports grants from Novartis, BMS, Bioverativ, and AstraZeneca outside the submitted work and personal fees from Salarius Pharmaceuticals, Iterion Therapeutics, GlycosBio, and BMS outside the submitted work.

Figures
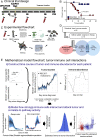
Fig. 1.
Fig. 1.
Overview of the clinical trial treatment strategy, patients’ classification, immune single-cell analysis pipeline, and tumor–immune interaction modeling. (A) Advanced GI patients received mFOLFOX6 chemotherapy at the beginning of the trial for two 14-d cycles. From cycles 3 through 12, they received both mFOLFOX6 and anti–PD-1 immunotherapy. At baseline (cycle 1 = C1), cycle 3 (C3), and cycle 5 (C5) blood was collected and PBMCs were isolated and frozen. (B) Overall survival of responders and nonresponders. (C) PBMC analyses using single-cell RNA sequencing and flow cytometry validation. (D) Flowchart of patient sample selection criteria, showing how patient samples were filtered and analyzed. (E) Mathematical modeling flowchart, depicting how (i) clinical tumor burden data were synthesized and linked to concurrent measurements of PBMC abundance and (ii) how a dynamic model of tumor–immune cell interactions, fitted to this data, allow inference of key biological processes (e.g., the ability of immune cells to kill tumor cells).
Fig. 2.
Fig. 2.
Patients’ immune cell function in attacking cancer cells and regulating tumor growth measured using a data-driven tumor–immune cell interaction model. (A) Schematic of the mathematical model describing the strength of tumor–immune cell interactions and how their abundances change within a given patient over time. Blue arrows indicate recruitment (triangle tip) and attack interactions (circle tip) between cell types. Green arrows show how immunotherapy influences these interactions and immune population growth. Red arrows indicate chemotherapy effects. Curved arrows indicate intrinsic growth and density dependence within cell types. (B) Statistically fitting the model to clinical data allows an accurate description of observed tumor burden and PBMC abundance across patients and over time. The dashed black line indicates 1:1 model–data correspondence. (C) Histogram showing that responder patients consistently have immune cells with a higher ability to attack cancer cells. (D) Comparison of the speed of growth or decline of the tumor and immune cell populations during the trial, as measured by the RGR of each component between observations. The distinct burst of immune activation in responders (Left) and subsequent tumor decline was negligible in nonresponders (Right). Solid lines show mean trajectories and shaded regions signify model uncertainty intervals. The vertical dashed line indicates the start of immunotherapy and the horizontal gray dashed line shows stable population size). (E) Tumor–immune interaction model predictions of the ability of the immune cells of responders and nonresponders to regulate the growth of the tumor during the trial.
Fig. 3.
Fig. 3.
Validated classification of immune cell types, T cells, and monocyte subtypes and identification of the major phenotypic variation within these populations. (A) UMAP of the scRNAseq data of all patient’s PBMCs across analyzed time points. Major PBMC types are labeled (RBC, red blood cells; pDC, plasmacytoid dendritic cells). (B) The agreement between our predicted clusters and public classifications of cell types annotated in two published datasets. (Top) Machine learning prediction: the distribution of immune cells in public datasets predicted to our annotation clusters by Random Forest learner using our predicted clusters as a training set. (Bottom) Shared marker genes: the number of shared genes between public datasets and our predicted clusters (SI Appendix). NKT, natural killer T cells; DCs, dendritic cells). (C) UMAP identification of CD4+ and CD8+ T cell subclusters (TFH, follicular helper) and monocyte subtypes. (D) UMAP representing phenotypic gradients of CD4+ differentiation (top of left subplot: lowest score at right and highest to the left), CD8+ cytotoxic differentiation (bottom of left subplot: lowest score toward the top right and highest at the bottom), and monocyte IFN activation.
Fig. 4.
Fig. 4.
Pathway signaling activation of multiple immune cell types in responders but not nonresponders following initiation of immunotherapy. (A) The number of molecular pathways impacted by chemotherapy and PD-1 immunotherapy and whether PD-1 immunotherapy effects are specific to responders (black bars) or common across patients. The “chemotherapy all patients” panel shows the numbers pathways changing expression between time C1 and C3 in different cell types. The “immunotherapy all patients” panel shows the numbers of pathways showing trends in expression between C3 and C5 which are common to responders and nonresponders. Finally, the “immunotherapy responders” panel shows the numbers of pathways with trends in expression that are unique to responder patients. Pathways with very differing trends in responders and nonresponders are exemplified on the right side. NK, natural killer. (B) IFN and inflammatory signaling of CD4+ and CD8+ T cells is up-regulated in responders more than nonresponders. GSEA pathway categories reflect the most enriched types of pathways for each cell type. Individual GSEA pathways exhibiting differential trends in expression between responders and nonresponders are shown (dashed lines). Overall trends of pathways within each cellular process (solid lines) and variation (shaded regions) are overlain. (C) Heat map of changes in gene expression of responder and nonresponder CD4+ and CD8+ T cells over time. IFN, cell death, NF-κB, MHC I and II, and migration signature genes are displayed as the proportion of maximum level of each gene. Genes not detected in a cell type are shaded gray. (D) Differences in inflammatory signaling, differentiation, and growth-factor production between the monocytes of responders and nonresponders showing overall trends of pathways within each cellular process (solid lines) and variation (shaded regions). Trends of pathways exhibiting differential expression patterns in responders and nonresponders are indicated by dashed lines. (E) Heat map of changes in gene expression of responder and nonresponder monocytes over time. IFN, cell death, NF-κB, TNF-α, growth-factor production, and migration signature genes are displayed as the proportion of maximum level of each gene. Statistical significance of differences between responders and nonresponders was determined for each gene and corrected for multiple comparisons. C1 = cycle 1: baseline; C3 = cycle 3: chemotherapy mFOLOFX6 regimen; C5 = cycle 5: chemotherapy + anti–PD-1 immunotherapy. One cycle = 14 d.
Fig. 5.
Fig. 5.
Peripheral blood immune cell phenotypes linked to patients’ immune cell function and immunotherapy responsiveness. Responsiveness to immunotherapy depends on circulating memory T cell differentiation and monocyte IFN activation prior to therapy. (A) Comparison of CD4+ and CD8+ T cell subtype differentiation scores (all subtypes differ with a Tukey test). EMRA, effector memory CD45RA+; CM, central memory. (B) Frequency of CD4+ and CD8+ T cells with different states of differentiation/cytotoxicity in responders and nonresponders at each treatment time point. (C) Frequency of monocytes with different IFN activation states in responders and nonresponders at each time point. (D and E) The ability of patients’ immune cells to attack cancer cells and also the tumor’s sensitivity to chemotherapy was linked to immune cell signaling and differentiation phenotypes. For each patient, the single-cell variability in immune cell phenotypes is presented as an individual violin densities. The black line indicates the relationship between a patient’s average immune cell phenotype and the strength of immune cell attack/chemotherapy sensitivity. Shaded regions show credible intervals for the predicted range of phenotypes of 95% of the immune cells, given the strength of immune cell attack/chemotherapy sensitivity.

References

    1. Loos M.et al. ., Clinical significance and regulation of the costimulatory molecule B7-H1 in pancreatic cancer. Cancer Lett. 268, 98–109 (2008). - PubMed
    1. Nomi T.et al. ., Clinical significance and therapeutic potential of the programmed death-1 ligand/programmed death-1 pathway in human pancreatic cancer. Clin. Cancer Res. 13, 2151–2157 (2007). - PubMed
    1. Ohigashi Y.et al. ., Clinical significance of programmed death-1 ligand-1 and programmed death-1 ligand-2 expression in human esophageal cancer. Clin. Cancer Res. 11, 2947–2953 (2005). - PubMed
    1. Oki E.et al. ., Protein expression of programmed death 1 ligand 1 and HER2 in gastric carcinoma. Oncology 93, 387–394 (2017). - PubMed
    1. Song M.et al. ., PTEN loss increases PD-L1 protein expression and affects the correlation between PD-L1 expression and clinical parameters in colorectal cancer. PLoS One 8, e65821 (2013). - PMC - PubMed

Publication types

Substances