. 2020 Jul 14;117(28):16587-16595.
doi: 10.1073/pnas.2009799117. Epub 2020 Jun 22.

Syrian hamsters as a small animal model for SARS-CoV-2 infection and countermeasure development

Affiliations

Syrian hamsters as a small animal model for SARS-CoV-2 infection and countermeasure development

Masaki Imai et al. Proc Natl Acad Sci U S A. .

Abstract

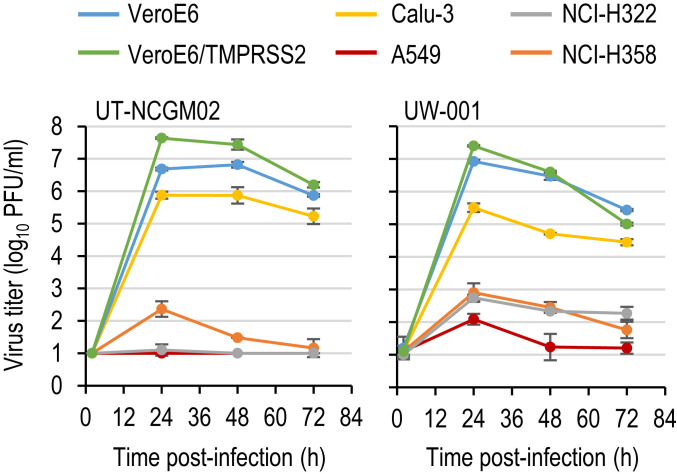
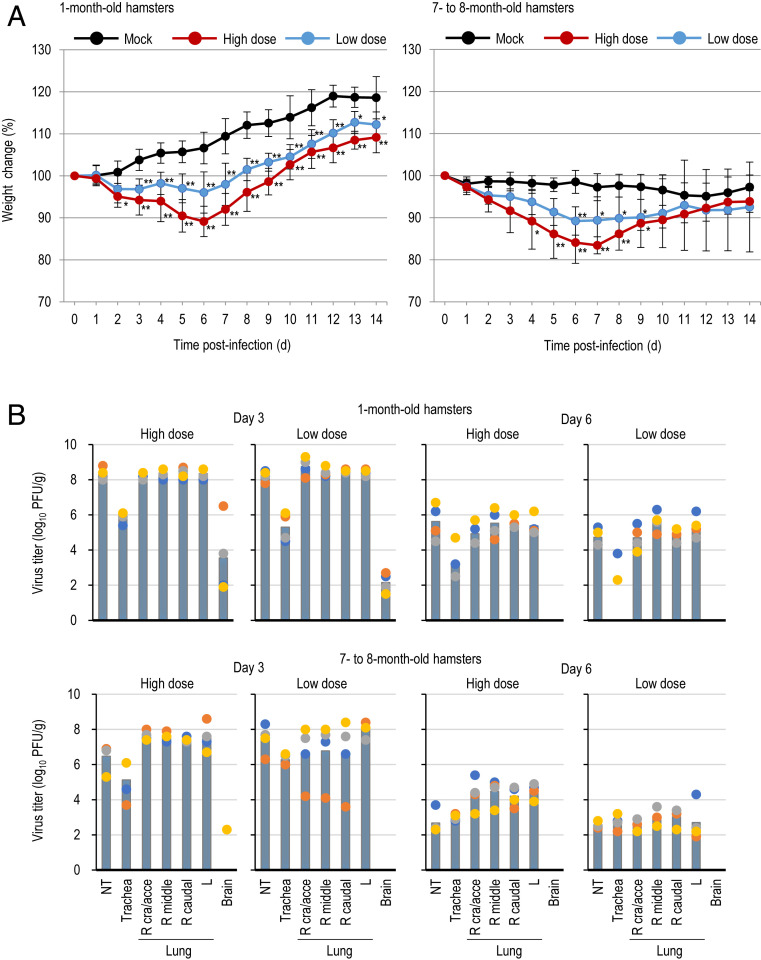
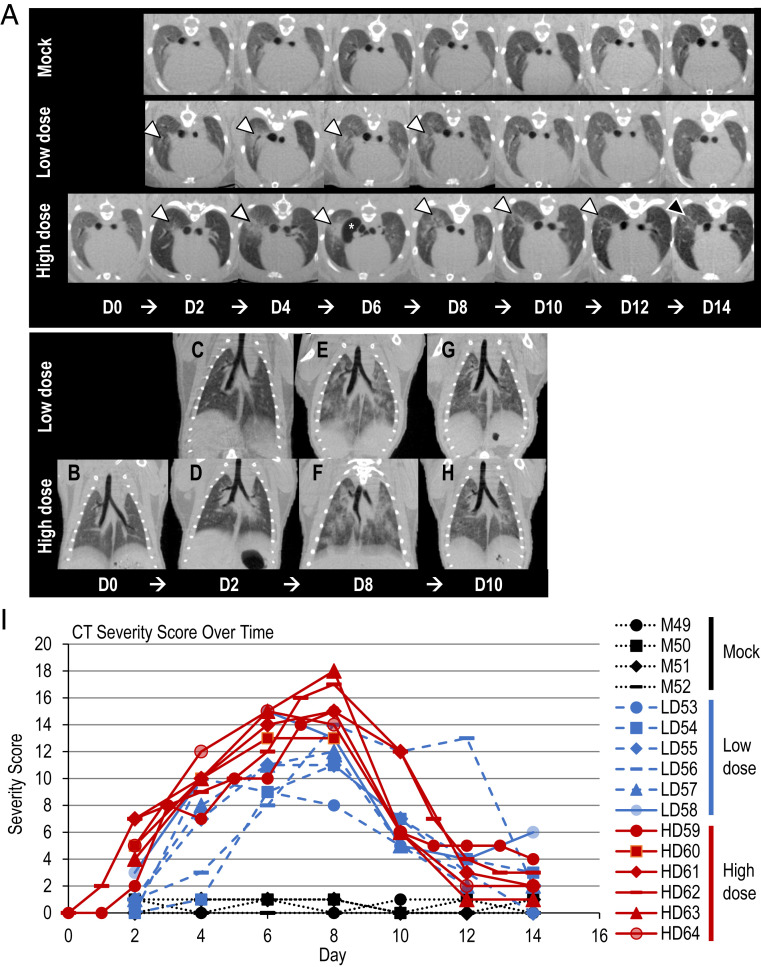
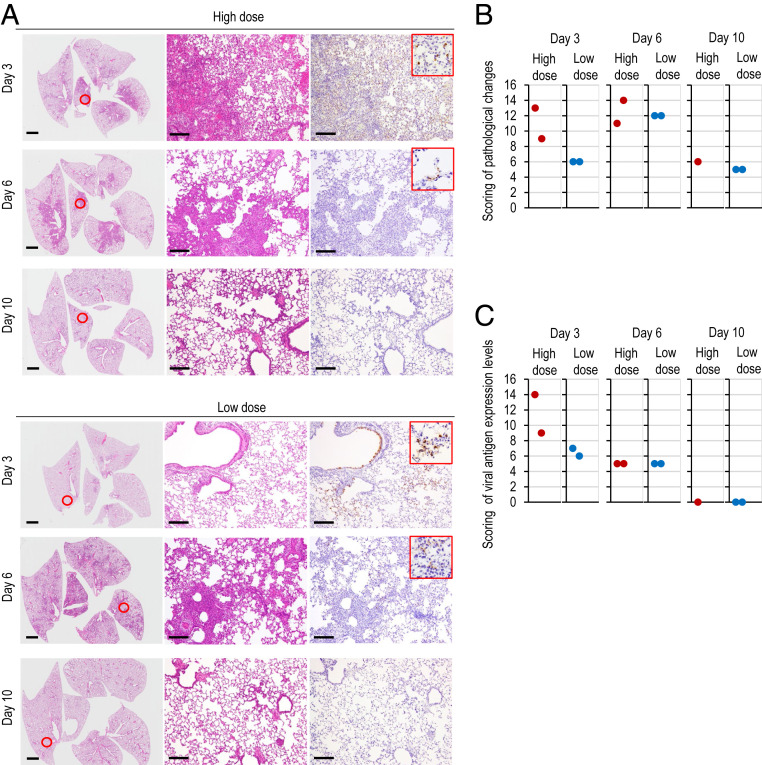
At the end of 2019, a novel coronavirus (severe acute respiratory syndrome coronavirus 2; SARS-CoV-2) was detected in Wuhan, China, that spread rapidly around the world, with severe consequences for human health and the global economy. Here, we assessed the replicative ability and pathogenesis of SARS-CoV-2 isolates in Syrian hamsters. SARS-CoV-2 isolates replicated efficiently in the lungs of hamsters, causing severe pathological lung lesions following intranasal infection. In addition, microcomputed tomographic imaging revealed severe lung injury that shared characteristics with SARS-CoV-2-infected human lung, including severe, bilateral, peripherally distributed, multilobular ground glass opacity, and regions of lung consolidation. SARS-CoV-2-infected hamsters mounted neutralizing antibody responses and were protected against subsequent rechallenge with SARS-CoV-2. Moreover, passive transfer of convalescent serum to naïve hamsters efficiently suppressed the replication of the virus in the lungs even when the serum was administrated 2 d postinfection of the serum-treated hamsters. Collectively, these findings demonstrate that this Syrian hamster model will be useful for understanding SARS-CoV-2 pathogenesis and testing vaccines and antiviral drugs.

Keywords: SARS-CoV-2; Syrian hamsters; countermeasure; infection.


Conflict of interest statement

The authors declare no competing interest.

Figures

Fig. 1.
Fig. 1.
Growth kinetics of SARS-CoV-2 isolates in cell culture. VeroE6, VeroE6/TMPRSS2, Calu-3, A549, NCI-H322, and NCI-H358 cells were infected with viruses at an MOI of 0.05. The supernatants of the infected cells were harvested at the indicated times, and virus titers were determined by means of plaque assays in VeroE6/TMPRSS2 cells. Error bars indicate SDs from three independent experiments.
Fig. 2.
Fig. 2.
TEM and STEM tomography images of SARS-CoV-2 virions in infected VeroE6/TMPRSS2 cells. VeroE6/TMPRSS2 cells were infected with UT-NCGM02 at an MOI of 1. At 22 h postinfection, the infected cells were fixed, and analyzed using thin-section TEM and STEM tomography. (A) TEM images of virions. Virions were seen within intracellular compartments (Left) and in the extracellular space adjacent to the plasma membrane (Right). Arrow heads indicate virions budding into the intracellular compartments. (Scale bar, 500 nm.) (BE) STEM tomography images of virions. Semithin sections (250 nm thick) were prepared from the same samples as those examined by using TEM (in A). Then, 3D structures of the whole virions were computationally reconstructed by using STEM tomography. (B and D) Consecutive transverse sections (0.72 nm thick at 1.4-nm intervals) of the reconstructed virions are shown from the top (top left) to the bottom (bottom left). (Scale bar, 50 nm.) (C and E) The 3D models of the RNPs (red and purple) within the virions from the top (Right) and side (Left) views. The viral envelope is colored gray.
Fig. 3.
Fig. 3.
Virus replication in infected Syrian hamsters. (A) Body weight changes in Syrian hamsters after viral infection. Syrian hamsters were inoculated with 105.6 PFU (in 110 μL) or with 103 PFU (in 110 μL) of UT-NCGM02 or PBS (mock) via a combination of the intranasal (100 μL) and ocular (10 μL) routes. Body weights of virus-infected (n = 4) and mock-infected hamsters (n = 4) were monitored daily for 14 d. Data are presented as the mean percentages of the starting weight (±SD). P values were calculated by using pairwise comparisons after a linear mixed model analysis (*P < 0.05; **P < 0.01). Asterisks next to data points indicate statistically significant differences between virus- and mock-infected animals. See Methods for more details regarding the statistical analysis. (B) Virus replication in infected Syrian hamsters. Syrian hamsters were inoculated with 105.6 PFU (in 110 μL) or with 103 PFU (in 110 μL) of UT-NCGM02 via a combination of the intranasal (100 μL) and ocular (10 μL) routes. Four Syrian hamsters per group were killed on days 3, 6, and 10 postinfection for virus titration. Virus titers in various organs were determined by means of plaque assays in VeroE6/TMPRSS2 cells. Vertical bars show the mean. The vertical bar is shown only when virus was recovered from all four hamsters. Points indicate data from individual Syrian hamsters. NT, nasal turbinate; R cra/acce, right cranial and accessory lobes; R middle, right middle lobe; R caudal, right caudal lobe; L, left lobe.
Fig. 4.
Fig. 4.
Micro-CT imaging of the lungs of infected Syrian hamsters. (A) Axial CT images of the thorax in mock-infected control, low dose-infected, and high dose-infected animals showing lung abnormalities over a 14-d period (white arrowheads). Lung abnormalities were first detected 2 d postinfection, and the most severe changes were observed 8 d postinfection in virus-infected animals. The high dose-infected animals had, overall, more severe lung abnormalities compared to the low dose-infected animals. Lung abnormalities began to improve 10 d postinfection for both low dose- and high dose-infected animals. On day 14 postinfection, the high dose-infected animals had a higher degree of residual lung abnormalities compared to the low dose-infected animals, highlighted by the black arrowhead. Pneumomediastinum is labeled by the white asterisk (*). Note that the day 0 control image was only obtained for the high dose-infected animal and is not available for the low dose-infected or mock-infected animals. (BH) Dorsal/coronal plane reconstruction CT images of the thorax in low dose-infected and high dose-infected animals showing (B) a control image, (C and D) initial lung changes, (E and F) most severe lung changes, and (G and H) the beginning of the recovery phase over time. The high dose-infected animals had more severe lung abnormalities than the low dose-infected animals. Note that the day 0 control image was only obtained for the high dose-infected animals and is not available for the low dose-infected animals. (I) CT severity score of mock-infected control and infected Syrian hamsters. CT Severity Score over time for mock-infected control, low dose-infected, and high dose-infected animals over 14 d. Low dose- and high dose-infected animals had severe lung abnormalities as demonstrated by high CT severity scores compared to mock-infected control animals. High dose-infected animals had a higher CT severity score compared to low dose-infected animals. CT abnormalities were first detected 2 d postinfection, the most severe changes peaked at 6 d to 8 d postinfection, and the recovery period began 10 d postinfection. Mild lung abnormalities, as indicated by lower CT severity scores, persisted at 14 d postinfection in most of the infected animals.
Fig. 5.
Fig. 5.
Pathological findings in infected Syrian hamsters. (A) Histopathological examination of the lungs of infected hamsters. Syrian hamsters were inoculated with 105.6 PFU (in 110 μL) or with 103 PFU (in 110 μL) of UT-NCGM02 via a combination of the intranasal (100 μL) and ocular (10 μL) routes. Syrian hamsters infected with the high or low dose were killed on days 3, 6, and 10 postinfection for pathological examinations (n = 2, except for 1 in the high-dose group on day 10). Shown are representative pathological findings in the lungs of hamsters infected with the virus on days 3, 6, and 10 postinfection (Left and Middle, hematoxylin and eosin staining; Right, immunohistochemistry for SARS-CoV-2 antigen detection). Middle and Right show enlarged views of the area circled in red in Left. (Scale bars, 2 mm [Left] and 200 μm [Middle and Right].) (B and C) Pathological severity scores in infected hamsters. To evaluate comprehensive histological changes, lung tissue sections were scored based on (B) pathological changes and (C) viral antigen detection levels. (B) Scores were determined based on the percentage of inflammation area for each section of the five lobes collected from each animal in each group by using the following scoring system: 0, no pathological change; 1, affected area (≤10%); 2, affected area (<50%, >10%); 3, affected area (≥50%); an additional point was added when pulmonary edema and/or alveolar hemorrhage was observed. The total score for the five lobes is shown for individual animals. (C) Scores were also determined based on the percentage of virus antigen-positive cells, as determined by immunohistochemistry, for each section of the five lobes collected from each animal in each group by using the following scoring system: 0, no positive cells; 1, positive cells (≤10%); 2, positive cells (<50%, >10%); 3, positive cells (≥50%). The total score for the five lobes is shown for individual animals.

References

    1. Huang C. et al. ., Clinical features of patients infected with 2019 novel coronavirus in Wuhan, China. Lancet 395, 497–506 (2020). - PMC - PubMed
    1. Zhu N. et al. .; China Novel Coronavirus Investigating and Research Team , A novel coronavirus from patients with pneumonia in China, 2019. N. Engl. J. Med. 382, 727–733 (2020). - PMC - PubMed
    1. Chan J. F. et al. ., Simulation of the clinical and pathological manifestations of coronavirus disease 2019 (COVID-19) in golden Syrian hamster model: Implications for disease pathogenesis and transmissibility. Clin. Infect. Dis., 10.1093/cid/ciaa325 (2020). - DOI - PMC - PubMed
    1. Matsuyama S. et al. ., Enhanced isolation of SARS-CoV-2 by TMPRSS2-expressing cells. Proc. Natl. Acad. Sci. U.S.A. 117, 7001–7003 (2020). - PMC - PubMed
    1. Harcourt J. et al. ., Severe acute respiratory syndrome coronavirus 2 from patient with coronavirus disease, United States. Emerg. Infect. Dis. 26, 1266–1273 (2020). - PMC - PubMed

Publication types

MeSH terms

LinkOut - more resources