. 2020 Jun 22;10(1):10036.
doi: 10.1038/s41598-020-66538-0.

Synchronization of the circadian clock by time-restricted feeding with progressive increasing calorie intake. Resemblances and differences regarding a sustained hypocaloric restriction

Affiliations

Synchronization of the circadian clock by time-restricted feeding with progressive increasing calorie intake. Resemblances and differences regarding a sustained hypocaloric restriction

Ana Cristina García-Gaytán et al. Sci Rep. .

Erratum in

Abstract

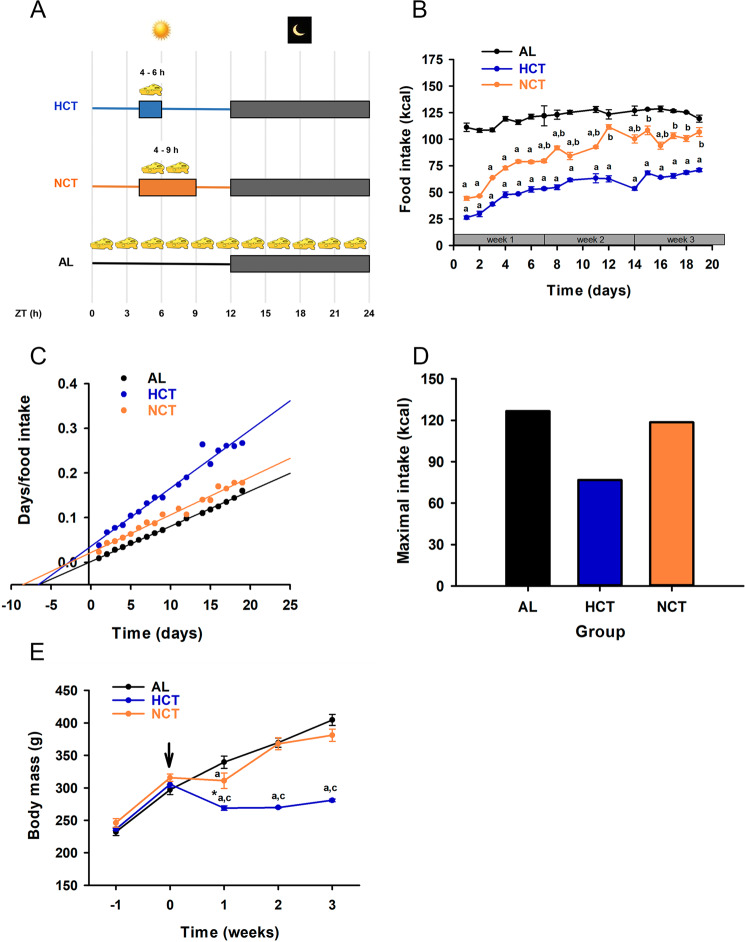
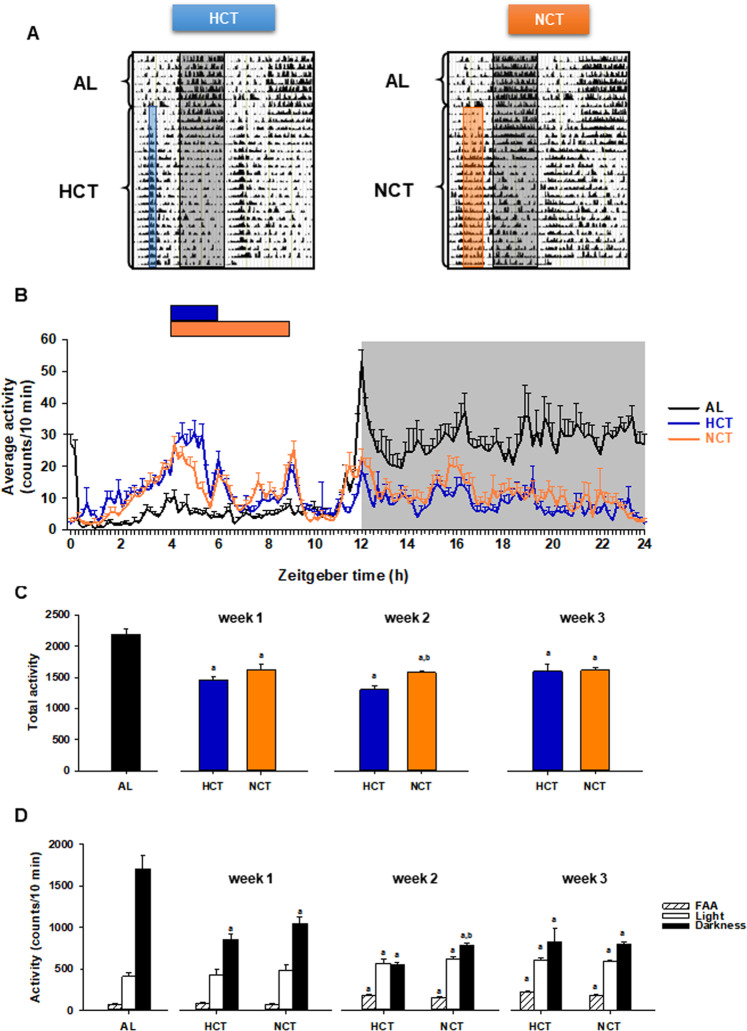
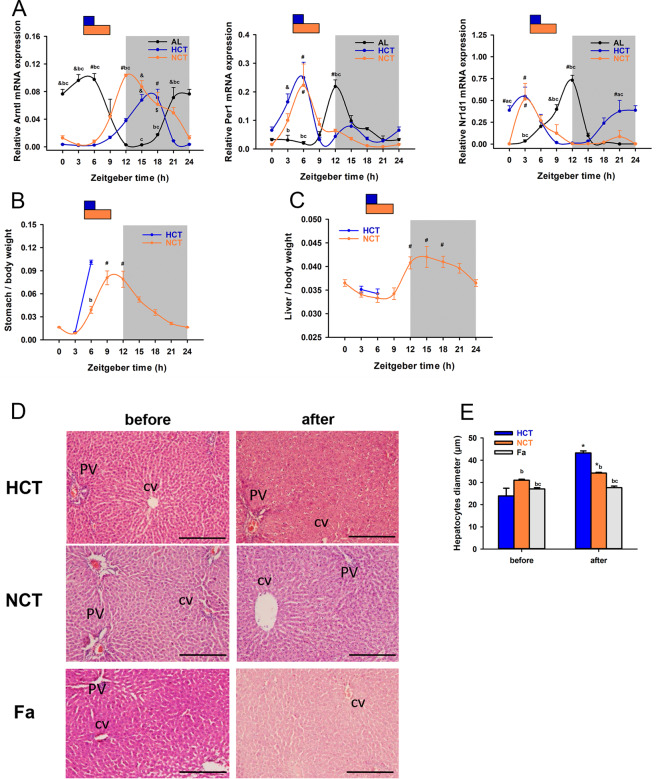
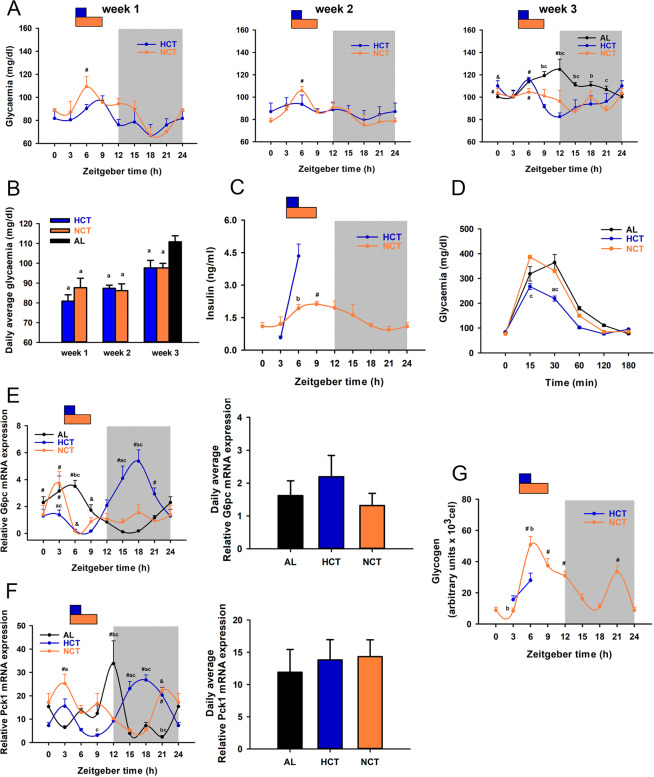
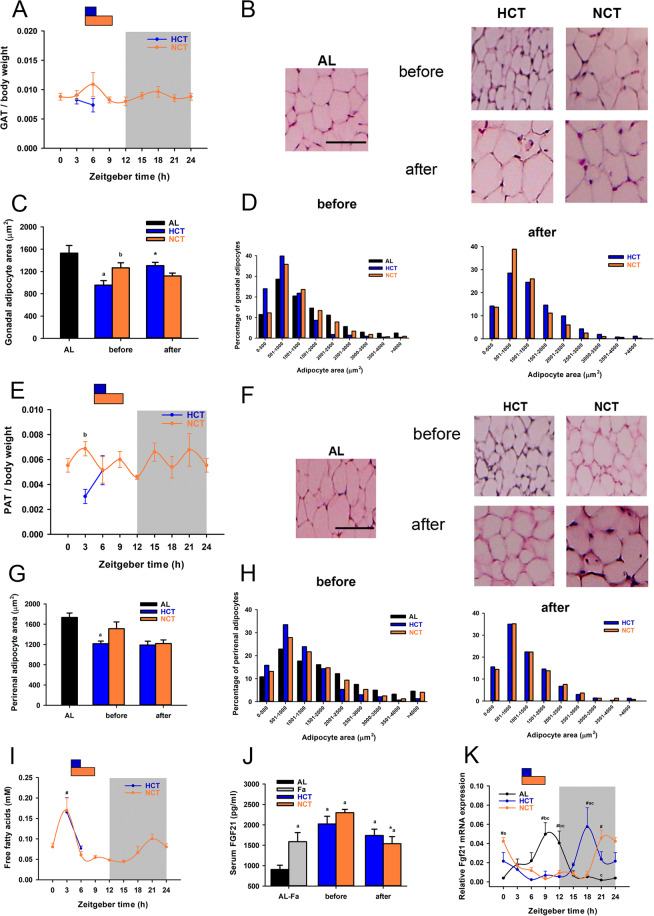
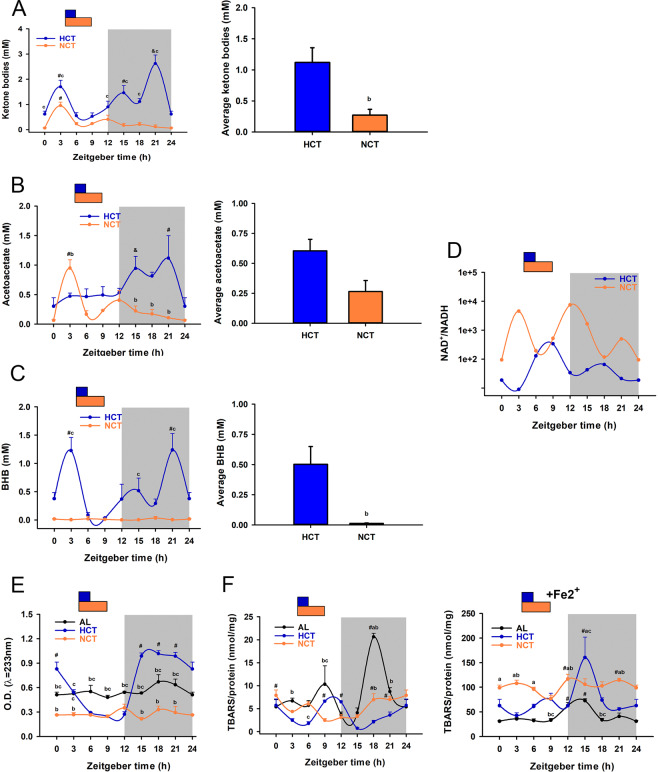
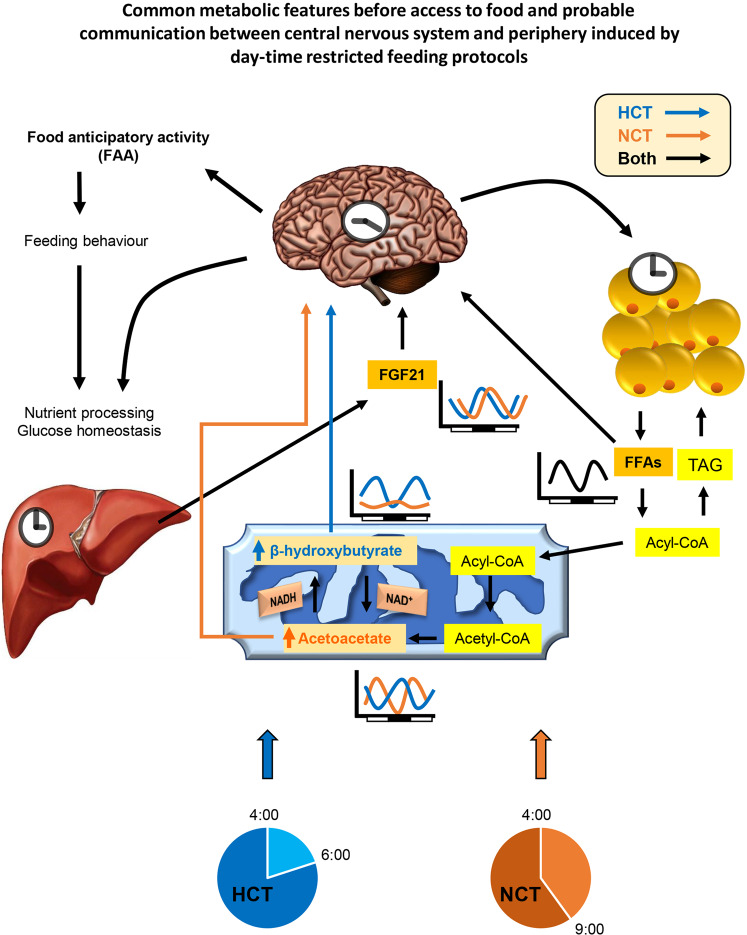
Circadian rhythms are the product of the interaction of molecular clocks and environmental signals, such as light-dark cycles and eating-fasting cycles. Several studies have demonstrated that the circadian rhythm of peripheral clocks, and behavioural and metabolic mediators are re-synchronized in rodents fed under metabolic challenges, such as hyper- or hypocaloric diets and subjected to time-restricted feeding protocols. Despite the metabolic challenge, these approaches improve the metabolic status, raising the enquiry whether removing progressively the hypocaloric challenge in a time-restricted feeding protocol leads to metabolic benefits by the synchronizing effect. To address this issue, we compared the effects of two time-restricted feeding protocols, one involved hypocaloric intake during the entire protocol (HCT) and the other implied a progressive intake accomplishing a normocaloric intake at the end of the protocol (NCT) on several behavioural, metabolic, and molecular rhythmic parameters. We observed that the food anticipatory activity (FAA) was driven and maintained in both HCT and NCT. Resynchronization of hepatic molecular clock, free fatty acids (FFAs), and FGF21 was elicited closely by HCT and NCT. We further observed that the fasting cycles involved in both protocols promoted ketone body production, preferentially beta-hydroxybutyrate in HCT, whereas acetoacetate was favoured in NCT before access to food. These findings demonstrate that time-restricted feeding does not require a sustained calorie restriction for promoting and maintaining the synchronization of the metabolic and behavioural circadian clock, and suggest that metabolic modulators, such as FFAs and FGF21, could contribute to FAA expression.


Conflict of interest statement

The authors declare no competing interests.

Figures

Figure 1
Figure 1
Characteristics of food intake and weight gain in progressive increasing to normocaloric intake (NCT) and sustained hypocaloric intake (HCT) protocols of time-restricted feeding. (A) Schematic of the experimental protocols indicating time window of food access during a 24 h day under ad libitum feeding (AL, n = 12 rats), HCT (food access for 2 h, n = 10 rats) and NCT (food access for 5 h, n = 10 rats). (B) Food intake during 3 weeks of the experiment. Each point represents the mean ± SEM. P < 0.05 a vs AL, b vs HCT. (C) Analysis of food intake curves by Hanes–Woolf method. (D) Maximal food intake according to lineal normalisation. (E) Weekly weight gain during 3 weeks of the experiment; row indicates the beginning of the protocols. P < 0.01 *vs week 0 in HCT, a vs AL, c vs NCT.
Figure 2
Figure 2
Locomotor activity under AL n = 10 rats), HCT (n = 10 rats) and NCT (n = 10 rats) protocols of  time-restricted feeding in 12:12 h light-dark cycles. (A) Representative double-plotted actograms showing the daily locomotor activity of rats. Each horizontal line represents 2 days  of recording. Both groups were kept in individual cages for 1 week under AL and then during 3 weeks under the respective time-restricted feeding protocol; food access is represented by vertical bars (blue, HCT; orange NCT) and darkness by the grey bar.(B) Activity profiles of rats over 24 h cycle. Waveforms represent the sum into 10-min bins and average of 5 days of recording under AL, HCT or NCT. Horizontal bars represent the time to food access (blue, HCT; orange NCT). Each point represents the mean ± SEM. (C) The average of the total activity under AL conditions and throughout each of the 3 weeks under the respective protocol. P ≤ 0.001 a vs AL, b vs HCT. (D) The representation of 3 h before food access (ZT1-ZT4) corresponding to spontaneous basal activity in AL condition (grey bar) and the food-anticipatory activity (FAA) in HCT and NCT (dashed bars), the rest of the light period (ZT4–ZT12) and the darkness (ZT12–ZT24) and throughout the 3 weeks of the respective protocol. Bars represent the mean ± SEM. P ≤ 0.001 a vs AL, b vs HCT.
Figure 3
Figure 3
Circadian profile of liver clock genes and metabolic organs weight under HCT and NCT at day 21 of each protocol (n = 4 rats). (A) Relative mRNA expression of Bmal1 (Arntl), Per1 (Per1) and Rev-erb-α (Nr1d1) in liver analysed by qPCR and normalised to Rps18. Food access is represented by vertical bars (blue, HCT; orange NCT) and darkness by the grey bar. Each point represents the mean ± SEM. P < 0.05 a vs AL, b vs HCT, c vs NCT. P < 0.05 # vs ZT0, 3, 6, 9, 18, 21; $ vs ZT3, 6, P < 0.01 & vs ZT0, 3, 6, 21 in NCT and HCT. P < 0.01 # vs ZT9, 12, 15, 18; & vs ZT12, 15 in AL. (B) Relative stomach weight and (C) liver weight normalised to body weight in HCT and NCT. P < 0.01 # vs ZT0, 3 in stomach weight and vs ZT3, 6, 9 in liver weight; P < 0.05 b vs HCT. (D) H&E histological sections of representative livers under HCT, NCT and single fasting for 21 h (Fa) before (ZT3) and after (ZT6 for HCT and Fa or ZT9 for NCT) feeding. Venous references are indicated as CV (central vein) and PV (portal vein) (scale bar= 500 μm). (E) Hepatocyte sizes measured in 3 fields per tissue section from 3 rats of each group. Bars represent the mean ± SEM. P < 0.01 b vs HCT, c vs NCT. P < 0.01 * vs before food access in their respective group.
Figure 4
Figure 4
Effect of HCT and NCT on glucose metabolism (n = 4 rats). (A) Daily profile of glycaemia during the 3 weeks of the respective protocol. AL daily profile is shown in the week 3. Each point represents the mean ± SEM. In week 1 and week 2, P < 0.05 # vs ZT18, 21; in week 3, P < 0.05 # vs ZT0, 3 in AL; vs ZT15, 21 in NCT; vs ZT9, 12, 15, 18 and P < 0.01 & vs ZT12 in HCT; P < 0.05 b vs HCT, c vs NCT. (B) Daily average glycaemia during the 3 weeks of each protocol. P < 0.05 a vs AL. (C) Daily profile of serum insulin concentrations under NCT and before and after food access under HCT. P < 0.05 # vs ZT21; P < 0.01 b vs HCT. (D) Glucose tolerance test. P < 0.05 a vs AL, c vs NCT. (E-F left) Daily profile of the mRNA expression of (E) glucose-6-phosphatase (G6pc). P < 0.05 a vs AL, b vs HCT, c vs NCT. P < 0.05 # vs ZT6, 9 in HCT and NCT, & vs ZT3, 18, 21 in NCT; P < 0.01 & ZT15 in AL; P < 0.01 # vs ZT9, 12, 15, 18; & vs ZT12, 15 in AL. (F) Phosphoenolpyruvate carboxykinase (Pck1). P < 0.01 a vs AL, b vs HCT, P < 0.05 c vs NCT. P < 0.05 # vs ZT0, 6, 9, 12 in HCT, P < 0.05 # vs ZT15, 18 in NCT, P < 0.01 # vs ZT0, 3, 6, 9, 15, 18, 21 in AL. (E-F right). Daily average of mRNA expression. Bars represent the mean ± SEM. (G) Content of liver glycogen evaluated by PAS staining during a 24 h period under NCT and before and after food access under HCT. P < 0.01 b vs HCT. P < 0.001 # vs ZT0, 3, 15, 18 in NCT.
Figure 5
Figure 5
Effects of HCT and NCT on the structural and functional characteristics of adipose tissue at day 21 of each protocol. Daily profile of (A) gonadal (GAT) and (E) perirenal (PAT) adipose tissue weight normalised to body weight in NCT, and before and after feeding in HCT (n = 4 rats). Each point represents the mean ± SEM. P < 0.001 b vs HCT. The representative formalin-fixed paraffin-embedded H&E staining images of (B) gonadal and (F) perirenal adipose tissue from the different groups. Scale bars = 100 μm. Adipocyte surface area in (C) gonadal and (G) perirenal adipose tissue depots before (ZT3) and after (ZT6 for HCT or ZT9 for NCT) feeding. The area measured in approximately 300 cells per rat (4 rats total) was grouped in each graph. Bars represent the mean ± SEM. P < 0.05 a vs AL, b vs HCT, * vs before feeding in the same group. Bar charts of frequency distribution of (D) gonadal and (H) perirenal adipocyte cell area from AL, HCT, and NCT rats, before and after feeding. (I) Daily profile of FFAs measured in serum under NCT and before and after feeding under HCT. P < 0.001 # vs ZT15 in NCT. (J) Serum FGF21 levels in AL, single fasting for 21 h (Fa) and before and after feeding. P < 0.01 a vs AL, P < 0.01 * vs before food access in its respective group. (K) Daily profile of relative mRNA expression of Fgf21 in liver. P < 0.05 b vs HCT, c vs NCT; # vs ZT9, 12, 15, 18, # vs ZT3, 6, 9, 12 in HCT; # vs ZT0, 15, 18, 21 in AL.
Figure 6
Figure 6
Effects of HCT and NCT on liver ketone bodies and redox status at day 21 of each protocol (n = 4 rats). Daily profile and daily average of (A) total serum ketone bodies, (B) acetoacetate and (C) β-hydroxybutyrate (BHB). (A-C left) Daily profile (A–C right) and daily average of serum ketone bodies. Each point represents the mean ± SEM. For total ketone bodies: P < 0.01 c vs NCT, # vs ZT0, 6, 15, 18, 21 in HCT, $ vs ZT0, 6, 9 in HCT; P < 0.05 & vs ZT0, 3, 6, 9, 12, 15, 18 in NCT; for acetoacetate: P < 0.01 b vs HCT, # vs ZT0, 6, 9, 15, 18, 21 in NCT; P < 0.05 # vs ZT0, 3, 6, 9 HCT, & vs ZT0 in HCT; for β-hydroxybutyrate: P < 0.01 c vs NCT, # vs ZT0, 6, 9, 12, 15, 18 in HCT. Bars represent the mean ± SEM. P < 0.05 b vs HCT. (D) Total redox state in terms of the NAD+/NADH ratio. Daily profile of lipoperoxidation in terms of (E) conjugated dienes, (F-left) TBARs and (F-right) TBARs + Fe2+. For conjugated dienes: P < 0.001 b vs HCT, c vs NCT; # vs ZT3, 6, 9, 12 in HCT. For TBARs: P < 0.05 a vs AL, b vs HCT, c vs NCT; # vs ZT9, 12, 15 in NCT, vs ZT15 in HCT, vs ZT12 in AL; for TBARs + Fe2+: P < 0.05 a vs AL, b vs HCT, c vs NCT; # vs ZT9 in NCT; vs ZT3 in HCT; vs ZT0, 3, 6, 9, 18, 21 in AL.
Figure 7
Figure 7
Schematic representation of the effects of HCT and NCT over metabolic homeostasis. Metabolic functions, peripheral clocks, and behaviour are regulated by the feeding. Ketone bodies and free fatty acids (FFAs) as energy sources and signaling molecules. FGF21 as a regulator of metabolism and circadian behaviour. Regardless of the calorie intake and lipid storage, adipose tissue in both TRF conditions performs lipolysis to induce a similar food anticipatory activity (FAA) response. Arrows colour indicates pathways induced by HCT (blue, food access ZT4-ZT6), NCT (orange, food access ZT4-ZT9) or both (black). Triacylglycerol (TAG).

References

    1. Schibler U, et al. Clock-Talk: Interactions between Central and Peripheral Circadian Oscillators in Mammals. Cold Spring Harb Symp Quant Biol. 2015;80:223–232. doi: 10.1101/sqb.2015.80.027490. - DOI - PubMed
    1. Marcheva B, et al. Disruption of the clock components CLOCK and BMAL1 leads to hypoinsulinaemia and diabetes. Nature. 2010;466:627–631. doi: 10.1038/nature09253. - DOI - PMC - PubMed
    1. Wang XS, Armstrong ME, Cairns BJ, Key TJ, Travis RC. Shift work and chronic disease: the epidemiological evidence. Occup Med (Lond) 2011;61:78–89. doi: 10.1093/occmed/kqr001. - DOI - PMC - PubMed
    1. Bass J, Lazar MA. Circadian time signatures of fitness and disease. Science. 2016;354:994–999. doi: 10.1126/science.aah4965. - DOI - PubMed
    1. Chaix A, Lin T, Le HD, Chang MW, Panda S. Time-Restricted Feeding Prevents Obesity and Metabolic Syndrome in Mice Lacking a Circadian Clock. Cell Metab. 2019;29:303–319 e304. doi: 10.1016/j.cmet.2018.08.004. - DOI - PMC - PubMed

Publication types