. 2020 Jun 22;10(1):10045.
doi: 10.1038/s41598-020-66838-5.

Visual sense of number vs. sense of magnitude in humans and machines

Affiliations

Visual sense of number vs. sense of magnitude in humans and machines

Alberto Testolin et al. Sci Rep. .

Abstract

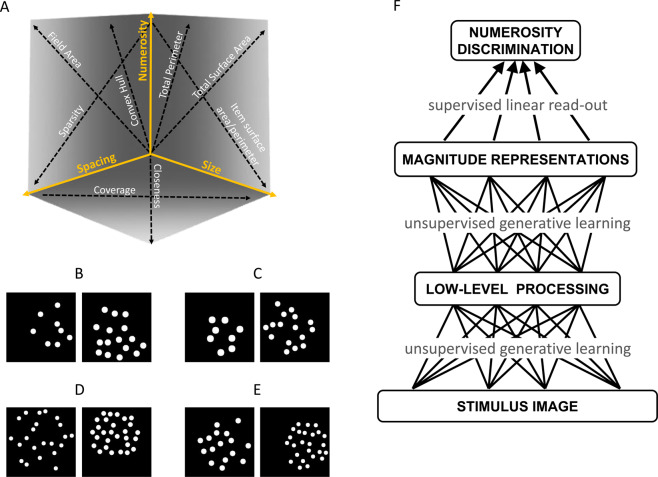
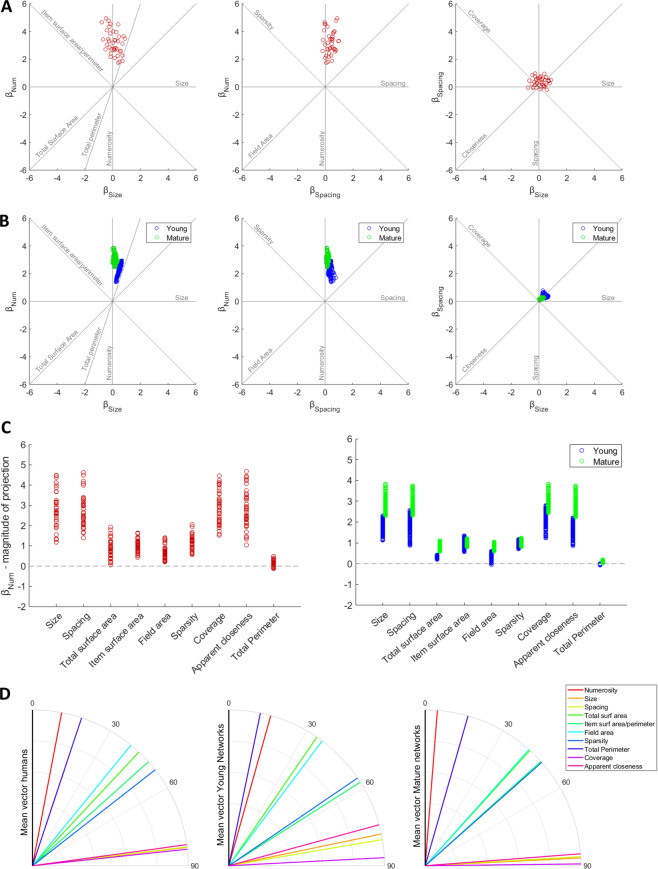
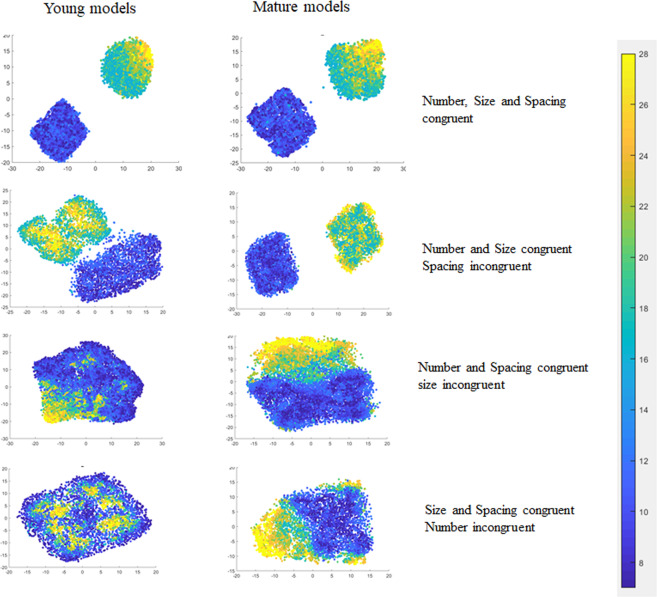
Numerosity perception is thought to be foundational to mathematical learning, but its computational bases are strongly debated. Some investigators argue that humans are endowed with a specialized system supporting numerical representations; others argue that visual numerosity is estimated using continuous magnitudes, such as density or area, which usually co-vary with number. Here we reconcile these contrasting perspectives by testing deep neural networks on the same numerosity comparison task that was administered to human participants, using a stimulus space that allows the precise measurement of the contribution of non-numerical features. Our model accurately simulates the psychophysics of numerosity perception and the associated developmental changes: discrimination is driven by numerosity, but non-numerical features also have a significant impact, especially early during development. Representational similarity analysis further highlights that both numerosity and continuous magnitudes are spontaneously encoded in deep networks even when no task has to be carried out, suggesting that numerosity is a major, salient property of our visual environment.


Conflict of interest statement

The authors declare no competing interests.

Figures

Figure 1
Figure 1
Stimulus space and model architecture. (A) The 3D stimulus space defined by the Numerosity, Size and Spacing orthogonal dimensions (adapted from). Non-numerical features are represented as arrows to indicate the direction in which they increase, and each stimulus image can be represented as a point in this space. Example of stimuli pairs are shown below, where Numerosity can be fully congruent for Size and Spacing (B), congruent for Spacing but not for Size (C), congruent for Size but not for Spacing (D), or fully incongruent for Size and Spacing (E). The model architecture is depicted in panel (F). At the initial stage, unsupervised deep learning adapts the connection weights of the first two layers (undirected edges) by capturing the statistical distribution of active pixels in the images. During task learning, a supervised linear classifier adapts the connection weights of the final layer (directed edges) in order to minimize discrimination error.
Figure 2
Figure 2
Psychophysics of numerosity comparison in humans and deep networks. Scatter plots of Numerosity, Size and Spacing coefficients for humans (A) and all deep networks (B), also showing the axes of individual features as done in. (C) Differences between the projection on the Numerosity dimension and the projections on all individual non-numerical features for humans (left) and deep networks (right). Positive values indicate that number was a better predictor of behavior than the specific feature. Negative values would indicate that the considered feature had greater impact on discrimination choice. (D) Angles between the discrimination vector and all non-numerical features (the discrimination vector is on the y axis) for humans (left) and deep networks at two different developmental stages: Young (middle) and Mature (right).
Figure 3
Figure 3
Maturation of number acuity in deep networks. (A) GLM fit for one Young (left panel) and one Mature (right panel) network, visualized as in. Black lines indicate the model fit for all data (black circles). Red color shows data and model fits for the trials with extreme Size ratio, while green color shows data and model fit for trials with great Spacing ratio. Dashed lines indicate that Size or Spacing were congruent with numerosity, while dotted lines indicate incongruent trials. (B) Left panel: Differences in Numerosity, Size and Spacing coefficients, measured separately for the Young and Mature networks. Right panel: Differences in angles between the discrimination vector and the most relevant non-numerical features, measured separately for the Young and Mature networks. (C) Comparison between angle and coefficients changes in humans (data replotted from) and deep networks. Note that angle differences for both humans and networks have been scaled by a factor of 10 for visualization purposes.
Figure 4
Figure 4
Representational similarity analysis. (A) Representational dissimilarity matrices for the best deep network architecture (distance measure: 1 – Pearson correlation) and the most relevant categorical models (distance measure: log distance between stimulus features). Each RDM was separately rank transformed and scaled into [0,1]. (B) Second-order correlation matrix showing the pairwise correlations between RDMs. (C) Relatedness between the model’s RDM and the categorical RDMs, measured as the Kendall rank correlation between dissimilarity matrices. Asterisks indicate significance in a one-sided signed rank test, thresholded at FDR < 0.01. Error bars indicate the standard error of the correlation estimate. Grey horizontal lines represent noise ceiling (i.e., the highest correlation that could be achieved considering the data variability).
Figure 5
Figure 5
Manifold projection using t-SNE. Stimuli with a small or large numerosity (respectively in the ranges 7:12 and 16:28) were first selected from the complete image data set. In the top panels, Numerosity, Size and Spacing are all congruent, which means that images with a small number of dots also have low Spacing and Size values. In the second-row panels, Numerosity and Size are congruent, but Spacing is not. In the third-row panels, Numerosity and Spacing are congruent, but Size is not. In the bottom panels, both Spacing and Size are incongruent with Numerosity. Results show that in the Mature model the representations are mostly clustered, with a distance gradient often proportional to number. In the Young model, when number is incongruent with Size the clustering almost disappears, especially when also Spacing is incongruent.

References

    1. Dehaene, S. The number sense: How the mind creates mathematics. (Oxford University Press, 2011).
    1. Piazza M. Neurocognitive start-up tools for symbolic number representations. Trends Cogn. Sci. 2010;14:542–551. - PubMed
    1. Butterworth, B. The mathematical brain. (Macmillan, 1999).
    1. Piazza M, Izard V, Pinel P, Le Bihan D, Dehaene S. Tuning curves for approximate numerosity in the human intraparietal sulcus. Neuron. 2004;44:547–555. - PubMed
    1. Agrillo C, Dadda M, Serena G, Bisazza A. Do fish count? Spontaneous discrimination of quantity in female mosquitofish. Anim. Cogn. 2008;11:495–503. - PubMed

Publication types