. 2020 Jun 22;10(1):10098.
doi: 10.1038/s41598-020-67119-x.

Cellular polyamines condense hyperphosphorylated Tau, triggering Alzheimer's disease

Affiliations

Cellular polyamines condense hyperphosphorylated Tau, triggering Alzheimer's disease

Stefan M Ivanov et al. Sci Rep. .

Abstract

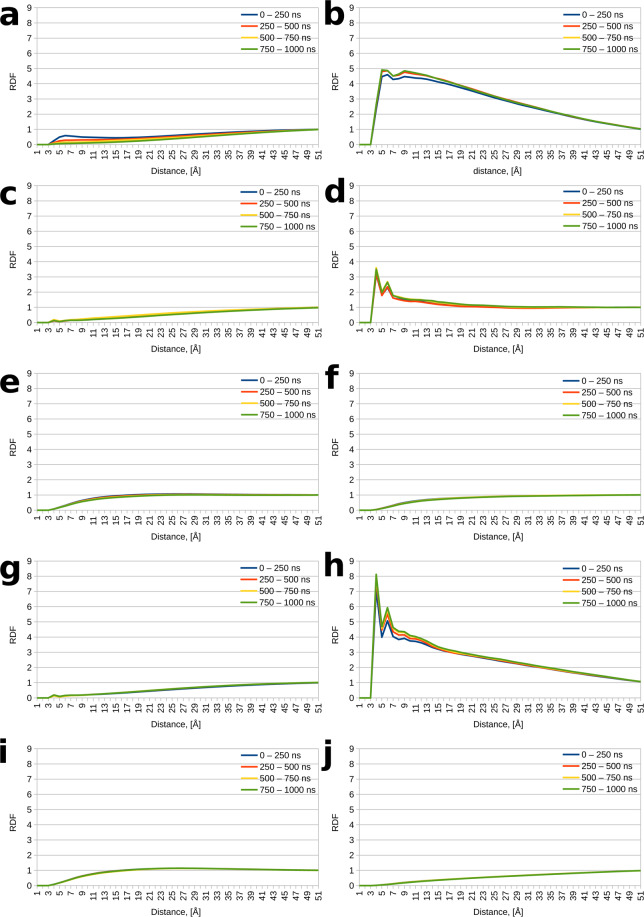
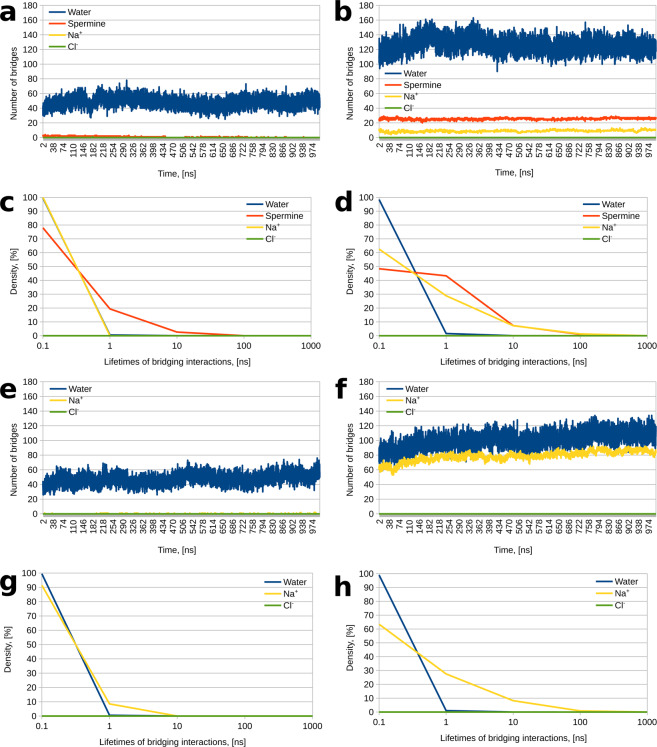
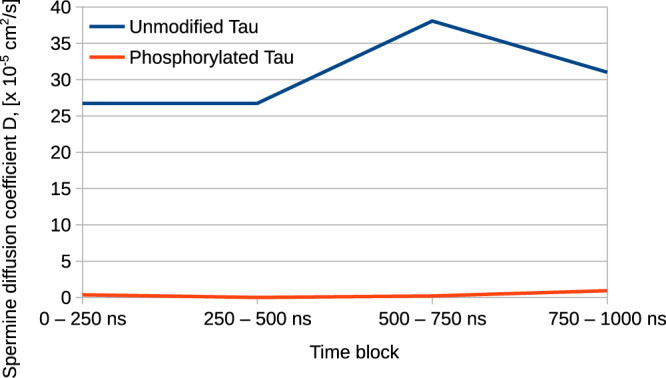
Many gaps in our understanding of Alzheimer's disease remain despite intense research efforts. One such prominent gap is the mechanism of Tau condensation and fibrillization. One viewpoint is that positively charged Tau is condensed by cytosolic polyanions. However, this hypothesis is likely based on an overestimation of the abundance and stability of cytosolic polyanions and an underestimation of crucial intracellular constituents - the cationic polyamines. Here, we propose an alternative mechanism grounded in cellular biology. We describe extensive molecular dynamics simulations and analysis on physiologically relevant model systems, which suggest that it is not positively charged, unmodified Tau that is condensed by cytosolic polyanions but negatively charged, hyperphosphorylated Tau that is condensed by cytosolic polycations. Our work has broad implications for anti-Alzheimer's research and drug development and the broader field of tauopathies in general, potentially paving the way to future etiologic therapies.


Conflict of interest statement

The authors declare no competing interests.

Figures

Figure 1
Figure 1
Radial distribution functions (RDFs) for the different moieties around the protein. (a) RDF values for spermine around unmodified Tau. (b) RDF values for spermine around phosphorylated Tau. (c) RDF values for Na+ around unmodified Tau (spermine is present in the system). (d) RDF values for Na+ around phosphorylated Tau (spermine is present in the system). (e) RDF values for Cl around unmodified Tau (spermine is present in the system). (f) RDF values for Cl around phosphorylated Tau (spermine is present in the system). (g) RDF values for Na+ around unmodified Tau (spermine is not present in the system). (h) RDF values for Na+ around phosphorylated Tau (spermine is not present in the system). (i) RDF values for Cl around unmodified Tau (spermine is not present in the system). (j) RDF values for Cl around phosphorylated Tau (spermine is not present in the system).
Figure 2
Figure 2
Number and distribution of bridging interactions. (a) Number of water-, spermine-, and ion-mediated bridging interactions as a function of time in the unmodified Tau system. (b) Number of water-, spermine-, and ion-mediated bridging interactions as a function of time in the phosphorylated Tau system. (c) Distribution of water-, spermine-, and ion-mediated bridging interactions by lifetime (i.e., the duration of the bridging interactions) in the unmodified Tau system. Note that the blue and yellow curves largely overlap and are hard to distinguish. (d) Distribution of water-, spermine-, and ion-mediated bridging interactions by lifetime (i.e., the duration of the bridging interactions) in the phosphorylated Tau system. (e) Number of water- and ion-mediated bridging interactions as a function of time in the unmodified Tau system without spermine. (f) Number of water- and ion-mediated bridging interactions as a function of time in the phosphorylated Tau system without spermine. (g) Distribution of water- and ion-mediated bridging interactions by lifetime (i.e., the duration of the bridging interactions) in the unmodified Tau system without spermine. (h) Distribution of water- and ion-mediated bridging interactions by lifetime (i.e., the duration of the bridging interactions) in the phosphorylated Tau system without spermine.
Figure 3
Figure 3
Spermine diffusivity in the Tau systems. Spermine diffusion coefficient calculated from the four time blocks (0–250, 250–500, 500–750, and 750–1000 ns) in the unmodified and phosphorylated Tau systems.
Figure 4
Figure 4
The Tau – spermine systems at the end of dynamics. (a) The unmodified Tau – spermine system at the end of dynamics. The backbone of the 8 Tau chains is shown in cartoon representation colored in gray. Na+ are shown as magenta spheres; Cl are shown as green spheres; spermine molecules are shown in ball-and-stick representation with nitrogen atoms in blue and carbon atoms in white. (b) A more zoomed-in view of the phosphorylated Tau – spermine system at the end of dynamics. Only ions within 3 Å of protein heavy atoms and making polar contacts are shown; the representation scheme for Na+ and spermine is as in. (a) The backbone of the 8 Tau chains is shown in cartoon representation colored in gray. Also shown in stick representation are protein residues making polar contacts with spermine and Na+ with oxygen atoms in red, carbon in white, nitrogen in blue, and phosphorus in orange; polar contacts are shown as yellow dotted lines.
Figure 5
Figure 5
Enthalpies of Tau – spermine interaction. (a) Computed enthalpy of interaction between unmodified Tau and spermine over the course of production dynamics. (b) Computed enthalpy of interaction between phosphorylated Tau and spermine over the course of production dynamics. Note that the Y scales are different in the two panels.
Figure 6
Figure 6
The Tau – spermine systems at the end of dynamics. (a) The unmodified Tau – spermine system at the end of dynamics. The backbone of the 8 Tau chains is shown in cartoon representation, spermine is in ball-and-stick representation. Tau and spermine are colored by per-residue energies of interaction calculated from the entire trajectory; blue indicates a favorable contribution to binding, red indicates an unfavorable contribution. Protein residues with contributions below −3 kcal/mol or above 3 kcal/mol are also shown in stick representation. Note that the frame in the image is the same as in Fig. 4a. (b) The phosphorylated Tau – spermine system at the end of dynamics. The backbone of the 8 Tau chains is shown in cartoon representation, spermine is in ball-and-stick representation. Tau and spermine are colored by per-residue energies of interaction calculated from the entire trajectory; blue indicates a favorable contribution to binding, red indicates an unfavorable contribution. Protein residues with contributions below −3 kcal/mol or above 3 kcal/mol are also shown in stick representation; polar contacts involving spermine are shown as yellow dotted lines. Note that the frame in the image is the same as in Fig. 4b.

References

    1. Gouras GK, Almeida CG, Takahashi RH. Intraneuronal Aβ accumulation and origin of plaques in Alzheimer’s disease. Neurobiol. Aging. 2005;26(9):1235–44. - PubMed
    1. Hamilton JM, et al. Accounting for functional loss in Alzheimer’s disease and dementia with Lewy bodies: Beyond cognition. Alzheimer’s Dement. 2014;10(2):171–8. - PMC - PubMed
    1. Qiu C, Kivipelto M, Von Strauss E. Epidemiology of Alzheimer’s disease: Occurrence, determinants, and strategies toward intervention. Dialogues Clin. Neurosci. 2009;11(2):111–28. - PMC - PubMed
    1. Liu K, et al. Research and development of anti-Alzheimer’s disease drugs: an update from the perspective of technology flows. Expert. Opin. Ther. Pat. 2018;28(4):341–50.. - PubMed
    1. Chen GF, et al. Amyloid beta: structure, biology and structure-based therapeutic development. Acta Pharmacol. Sin. 2017;38(9):1205–35.. - PMC - PubMed

Publication types

MeSH terms