. 2020 Jul;39(31):5338-5357.
doi: 10.1038/s41388-020-1372-7. Epub 2020 Jun 22.

Functional genomics identifies new synergistic therapies for retinoblastoma

Affiliations

Functional genomics identifies new synergistic therapies for retinoblastoma

Arthur Aubry et al. Oncogene. 2020 Jul.

Abstract

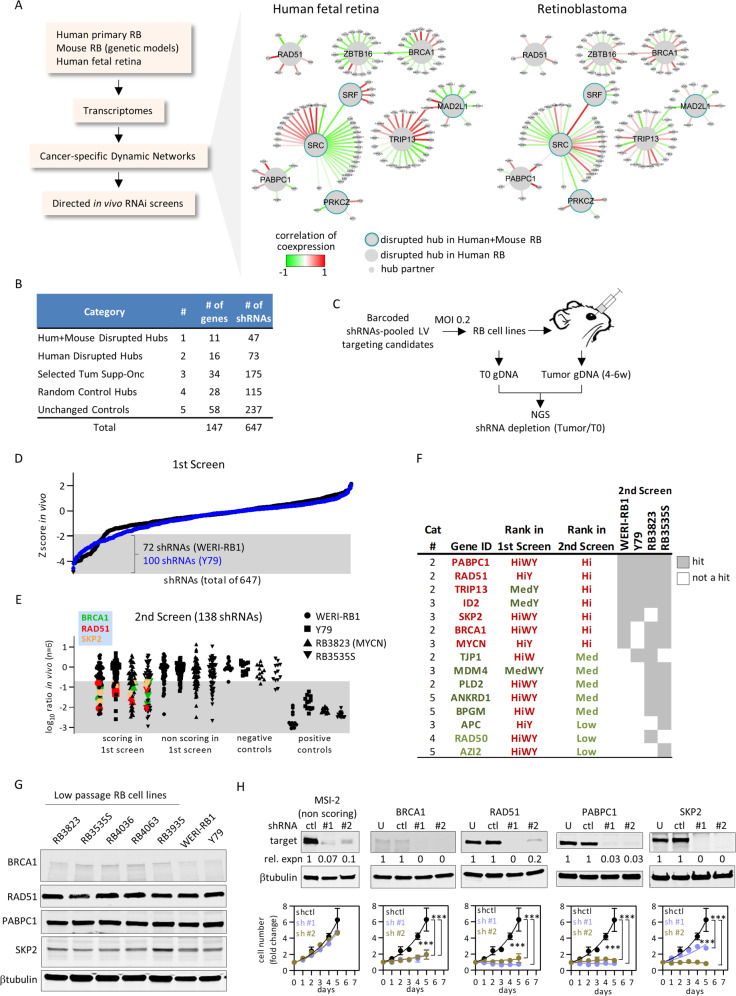
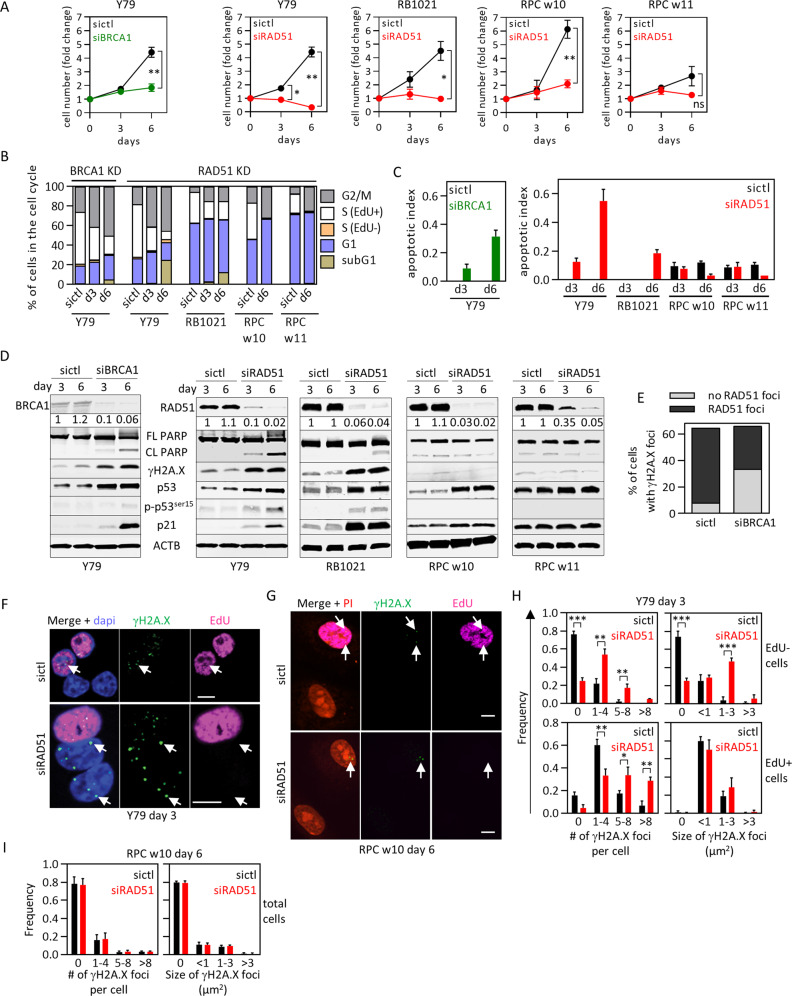
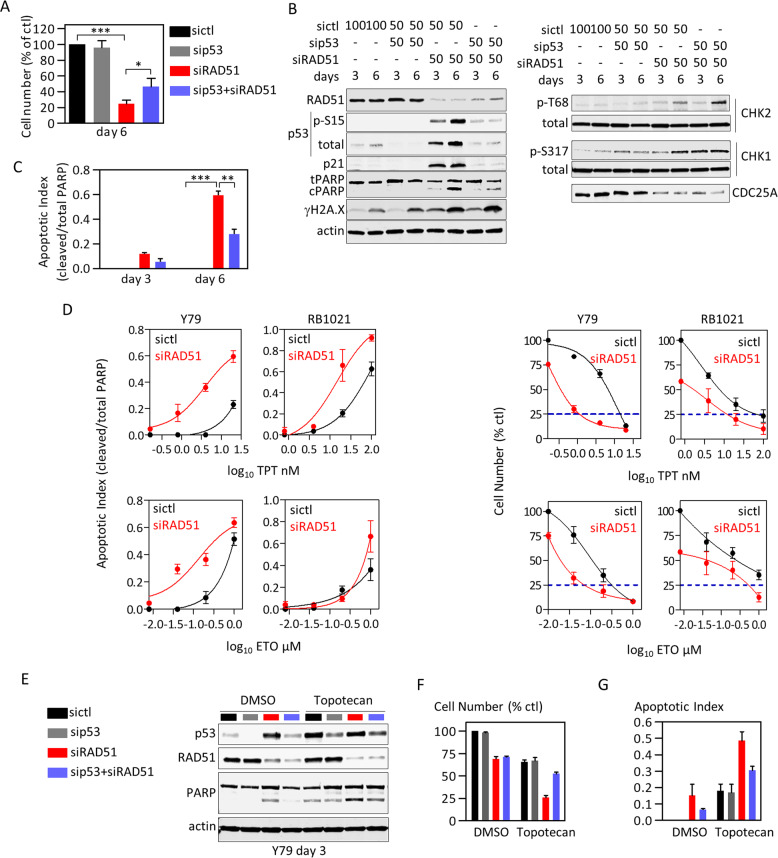
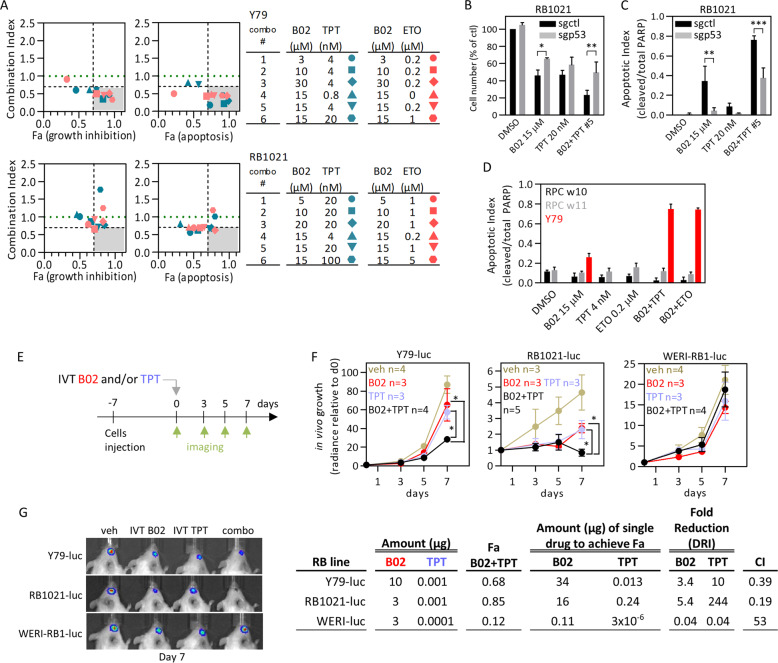
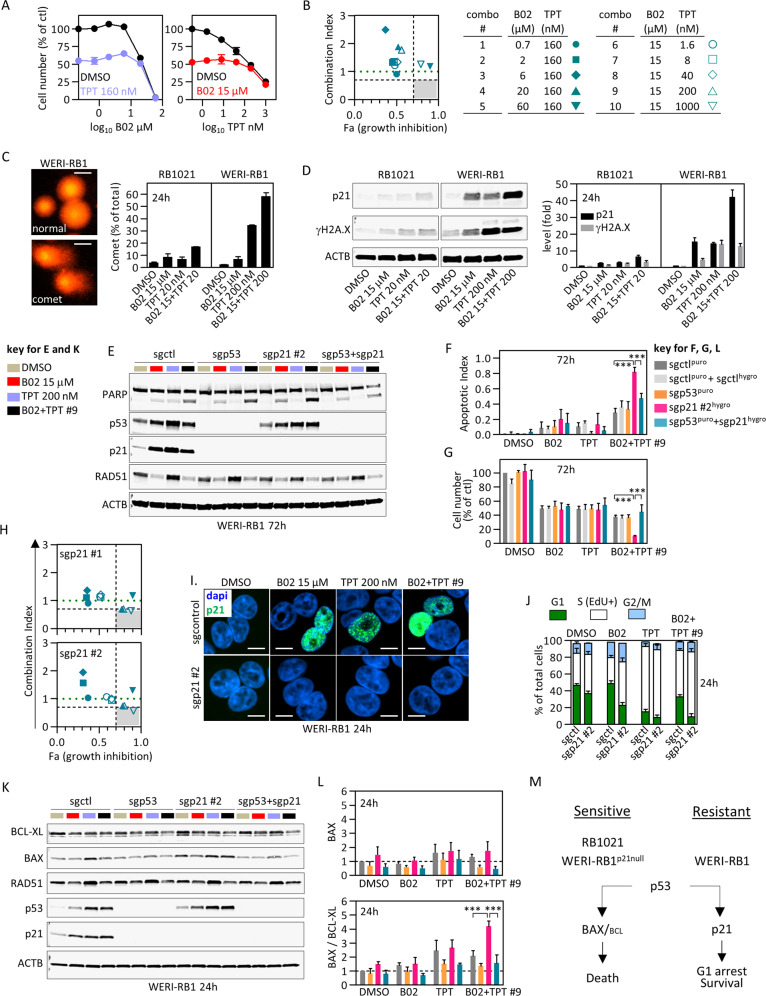
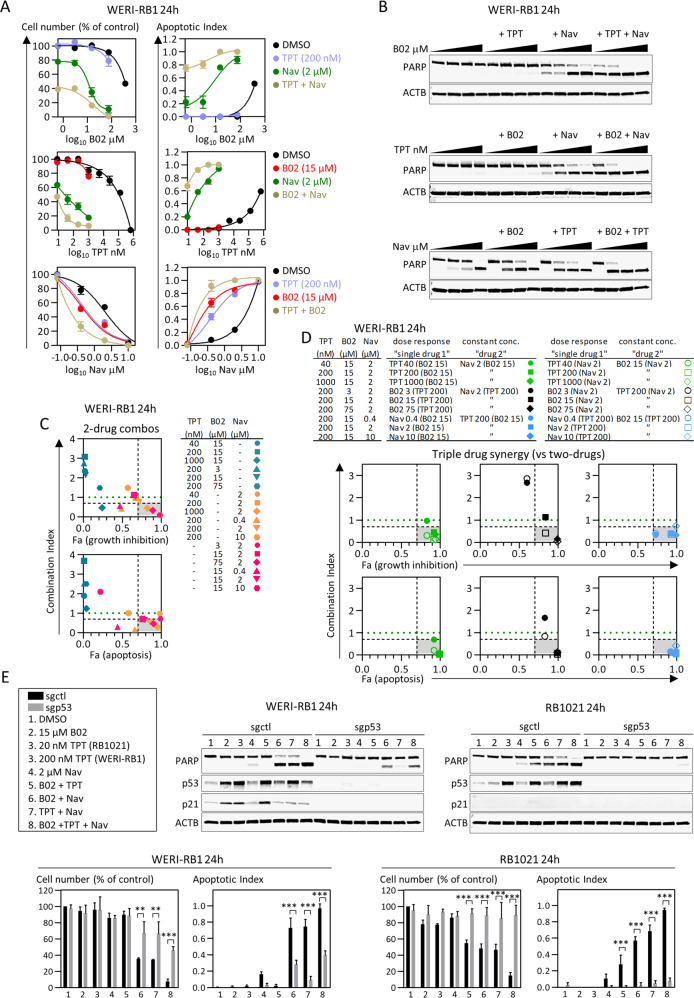
Local intravitreal or intra-arterial chemotherapy has improved therapeutic success for the pediatric cancer retinoblastoma (RB), but toxicity remains a major caveat. RB initiates primarily with RB1 loss or, rarely, MYCN amplification, but the critical downstream networks are incompletely understood. We set out to uncover perturbed molecular hubs, identify synergistic drug combinations to target these vulnerabilities, and expose and overcome drug resistance. We applied dynamic transcriptomic analysis to identify network hubs perturbed in RB versus normal fetal retina, and performed in vivo RNAi screens in RB1null and RB1wt;MYCNamp orthotopic xenografts to pinpoint essential hubs. We employed in vitro and in vivo studies to validate hits, define mechanism, develop new therapeutic modalities, and understand drug resistance. We identified BRCA1 and RAD51 as essential for RB cell survival. Their oncogenic activity was independent of BRCA1 functions in centrosome, heterochromatin, or ROS regulation, and instead linked to DNA repair. RAD51 depletion or inhibition with the small molecule inhibitor, B02, killed RB cells in a Chk1/Chk2/p53-dependent manner. B02 further synergized with clinically relevant topotecan (TPT) to engage this pathway, activating p53-BAX mediated killing of RB but not human retinal progenitor cells. Paradoxically, a B02/TPT-resistant tumor exhibited more DNA damage than sensitive RB cells. Resistance reflected dominance of the p53-p21 axis, which mediated cell cycle arrest instead of death. Deleting p21 or applying the BCL2/BCL2L1 inhibitor Navitoclax re-engaged the p53-BAX axis, and synergized with B02, TPT or both to override resistance. These data expose new synergistic therapies to trigger p53-induced killing in diverse RB subtypes.


Conflict of interest statement

The authors declare that they have no conflict of interest.

Figures

Fig. 1
Fig. 1. In vivo RNAi screens expose retinoblastoma vulnerabilities.
a Strategy to identify novel therapeutic targets in RB. Examples of disrupted hub/partners identified by DyNeMo are shown. b Sources of the 647 shRNAs targeting 147 genes for the primary in vivo dropout screen. c Design of the in vivo shRNA screens. d Primary screen data from orthotopic RB xenografts. shRNA enrichment/depletion was determined from Z-scores (full dataset in Table S1). Shaded area represents significant dropouts (Z < −1.96, p < 0.05 two tails). e Secondary screen data. In total, 138 shRNAs selected from the primary screen were tested in the indicated four orthotopic RB xenografts. The averaged log ratio tumor/T0 reads (n = 6) was plotted. Shaded area represents dropouts (full dataset in Table S1). The recurrent hits BRCA1, RAD51, and SKP2 are highlighted. f Summary of hits from the primary and secondary in vivo dropout screens. Hi: high rank; Med: medium rank; W: WERI-RB1; Y: Y79; red: high rank; dark green: medium rank; light green: low rank. g Westerns showing expression of the main hits BRCA1, RAD51, PABPC1, SKP2 in multiple RB lines. h Screen validation. Y79 cells were transduced with individual shRNAs of the indicated hits or a nonscoring control, knockdown efficiency assessed by western blot, and the effect on growth measured over 5 days by CellTiter-Glo reagent. Data were normalized to d0 and plotted (n = 3, mean ± SD, ***p < 0.001 two-way ANOVA, Sidak’s multiple comparisons test).
Fig. 2
Fig. 2. RAD51 loss kills retinoblastoma but not human fetal retinal cells.
ad The indicated RB tumor cells or RPC were treated with the indicated siRNAs for 6 days, and growth (a), cell cycle phase (b), apoptosis (c) and protein levels (d) determined. Representative flow cytometry plots used for (b) are shown in Fig. S9A–C. Graph in (c) is quantification of PARP cleavage in (d) (n = 2, mean ± range). e Quantification of nuclear RAD51 and γH2A.X foci in Y79 cells treated with siCtl or siBRCA1, detected by immunostaining at day 6 and analyzed by confocal microscopy. fi Y79 cells (f) or RPC (g) were treated with siCtl or siRAD51, labeled with EdU (magenta) and γH2A.X (green) at the indicated timepoints, and confocal images obtained. Arrows indicate γH2A.X foci. The number and size of γH2A.X foci were quantified in EdU+ (S-phase) EdU (non-S-phase) Y79 cells (h) or all RPC (i). In all cases n = 3 (unless specified otherwise). Data in (a), (h), (i) indicate mean ± SD. In (a), *p < 0.05, **p < 0.01, ***p < 0.001, ns nonsignificant, two-way ANOVA, Sidak’s multiple comparisons test. In (h) and (i), *p < 0.05, **p < 0.01, ***p < 0.001 Student t test. Scale bars are 10 μm.
Fig. 3
Fig. 3. Depleting RAD51 sensitizes RB cells to topoisomerase inhibitors by promoting p53-mediated death.
ac Y79 cells were treated with the indicated siRNAs for 3 or 6 days (nM indicated in (b)) and growth (trypan blue counts, (a)), protein levels (westerns, (b)), and apoptosis (PARP cleavage, (c)) assessed. (n = 3, mean ± SD, *p < 0.05, **p < 0.01, ***p < 0.001 ordinary one-way ANOVA, Tukey’s multiple comparisons test). d Y79 or RB1021 cells were treated with siCtl or siRAD51 plus either TPT or ETO, and dose-response curves obtained for cell number (trypan blue) or apoptosis (PARP cleavage, representative blot in Fig. S13A). (n = 3, mean ± SD). eg Y79 cells were treated with siRNAs and drugs as indicated. At day 3, cells were harvested for westerns (e), cell counts (f), or apoptosis (PARP cleavage, (g)) (n = 2, mean ± range).
Fig. 4
Fig. 4. p53-dependent and tumor-selective synergy of B02 with standard RB chemotherapy.
a Combination Index (CI) vs. effect (Fa) plots for two RB cell lines treated with the indicated two-drug combos of B02, topotecan (TPT), and etoposide (ETO). Turquoise and pink data points show B02 + TPT and B02 + ETO combos, respectively. The gray area delineates potent synergistic combos (CI < 0.7 and Fa > 0.7), and the green dotted line CI = 1; detailed growth inhibition curves, PARP westerns, and quantification curves are shown in Fig. S15A, B. b, c RB1021 cells were transduced with control or p53 sgRNA lentivirus, selected in puromycin, then drug-treated as indicated. Cell number (trypan blue, (b)) and apoptosis (PARP cleavage, (c)) were assessed on day 3 (n = 3, mean ± SD, *p < 0.05, **p < 0.01, ***p < 0.001 ordinary one-way ANOVA, Tukey’s multiple comparisons test; representative PARP western in Fig. S16A). d RPC or Y79 tumor cells were treated with the indicated single drugs or combo #5 from (a), and apoptosis quantified on day 3 (PARP cleavage, n = 2, mean ± range; representative PARP western in Fig. S16G). e Timeline to assess IVT B02 and/or TPT in three orthotopic RB xenograft models. f Based on day 7 data from Fig. S17A, B and plotted as dose response in Fig. S17C, subEC50 doses of B02 and TPT were selected (indicated in columns 2 and 3 of the table below the growth curves) and tested alone or together on the three indicated xenograft models (mean ± SD, *p < 0.05 two-way ANOVA, Sidak’s multiple comparisons test). DRI and CI are also indicated on the table. g Representative images of the radiance signals for the three RB tumors treated as indicated after 7 days are shown.
Fig. 5
Fig. 5. The p53–p21 axis underpins resistance to B02 and TPT.
a WERI-RB1 cells were treated with increasing concentrations of B02 (left) or TPT (right) together with vehicle (black) or EC50 doses of TPT (blue) or B02 (red) and cell number determined after 3 days (CellTiter-Glo, n = 2 ± range). b The combos tested in (a) are summarized and CI vs. effect (Fa) plotted. Gray area and green line as in Fig. 4a. Sensitive RB1021 or resistant WERI-RB1 cells were treated 24 h with ≈EC50 B02 and/or TPT and DNA double-stranded breaks assessed by alkaline comet assay (c) and γH2A.X westerns (d). Examples of propidium iodide-stained normal nucleoids, DNA comets, and normalized comet quantification (n = 2 ± range) are shown in (c). Scale bars are 10 μm. In (d), p21 and γH2A.X expression were also quantified (n = 2 ± range). eg Deletion of p53, p21, or both with CRISPR/Cas9 sgRNA lentiviruses was performed in WERI-RB1, and sensitivity to B02, TPT, and B02 + TPT combo #9 (from (b)) was assessed after 3 days by tracking apoptosis (representative blot in (e), quantified in (f)), and cell number (g) (n = 3, mean ± SD, ***p < 0.001 ordinary one-way ANOVA, Tukey’s multiple comparisons test). p53, p21, RAD51 levels were also assessed in (e). Additional westerns are shown in Fig. S19H. h B02/TPT synergy assay in p21-deleted cells, run as for parental cells in (a, b). The related growth inhibition curves for the two sgp21 tested are shown in Fig. S19G. i, j WT or p21-null WERI-RB1 cells were treated 24 h with single drugs or combo #9 (from (b)) and p21 localization assessed by immunostaining (i), or cell cycle phase defined by EdU and fxcycle staining followed by flow cytometry (j) (n = 2, mean ± range). Representative flow plots are shown in Fig. S19I. Scale bars are 10 μm. k The experiment in (eg) was repeated but protein levels were assessed at 24 h. l BAX and BCL-XL western blots in (k) were quantified, normalized to actin and DMSO, then levels were plotted as indicated (n = 3, mean ± SD, ***p < 0.001 ordinary one-way ANOVA, Tukey’s multiple comparisons test). m Schematic summarizing the distinct p53 response to B02/TPT in sensitive (left) or resistant (right) contexts.
Fig. 6
Fig. 6. Synergistic drug combinations to kill B02/TPT-resistant RB.
a WERI-RB1 were treated with increasing concentrations of B02 (top), TPT (middle), or Navitoclax (Nav, bottom), and with vehicle (black), or with EC50 doses of TPT (blue, two-drug combos), B02 (red, two-drug combos), or Nav (green, two-drug combos), or pairs of EC50 drugs (brown, three-drug combos), and cell number (a, left graphs) and apoptosis (a, right graphs) defined after 3 days (n = 2 ± range). b Representative PARP western used to quantify apoptosis in (a). The two-drug (c) or three-drug (d) combos from (a) are summarized in the tables, and CI vs. effect (Fa) graphed (gray areas and green lines as in Fig. 4a). e The indicated RB cell lines were transduced with control or p53-targeting sgRNA lentivirus, selected in puromycin, then 7 × 105 cells were seeded and treated as indicated. At 24 h, cell number (trypan blue) and apoptosis (PARP) were quantified (n = 3, mean ± SD, **p < 0.01, ***p < 0.001 ordinary one-way ANOVA, Tukey’s multiple comparisons test). Representative PARP, p53, and p21 western blots are shown.

References

    1. Dimaras H, Corson TW, Cobrinik D, White A, Zhao J, Munier FL, et al. Retinoblastoma. Nat Rev Dis Prim. 2015;1:15021.. - PMC - PubMed
    1. Corson TW, Gallie BL. One hit, two hits, three hits, more? Genomic changes in the development of retinoblastoma. Genes Chromosom Cancer. 2007;46:617–34. - PubMed
    1. Rushlow DE, Mol BM, Kennett JY, Yee S, Pajovic S, Thériault BL, et al. Characterisation of retinoblastomas without RB1 mutations: genomic, gene expression, and clinical studies. Lancet Oncol. 2013;14:327–34. - PubMed
    1. Munier FL, Gaillard M-C, Balmer A, Soliman S, Podilsky G, Moulin AP, et al. Intravitreal chemotherapy for vitreous disease in retinoblastoma revisited: from prohibition to conditional indications. Br J Ophthalmol. 2012;96:1078–83. - PubMed
    1. Francis JH, Abramson DH, Gaillard M-C, Marr BP, Beck-Popovic M, Munier FL. The classification of vitreous seeds in retinoblastoma and response to intravitreal melphalan. Ophthalmology. 2015;122:1173–9. - PubMed

Publication types

Grants and funding