. 2020 Jul;21(7):756-765.
doi: 10.1038/s41590-020-0698-1. Epub 2020 Jun 22.

Serum amyloid A is a soluble pattern recognition receptor that drives type 2 immunity

Affiliations

Serum amyloid A is a soluble pattern recognition receptor that drives type 2 immunity

Ursula Smole et al. Nat Immunol. 2020 Jul.

Abstract

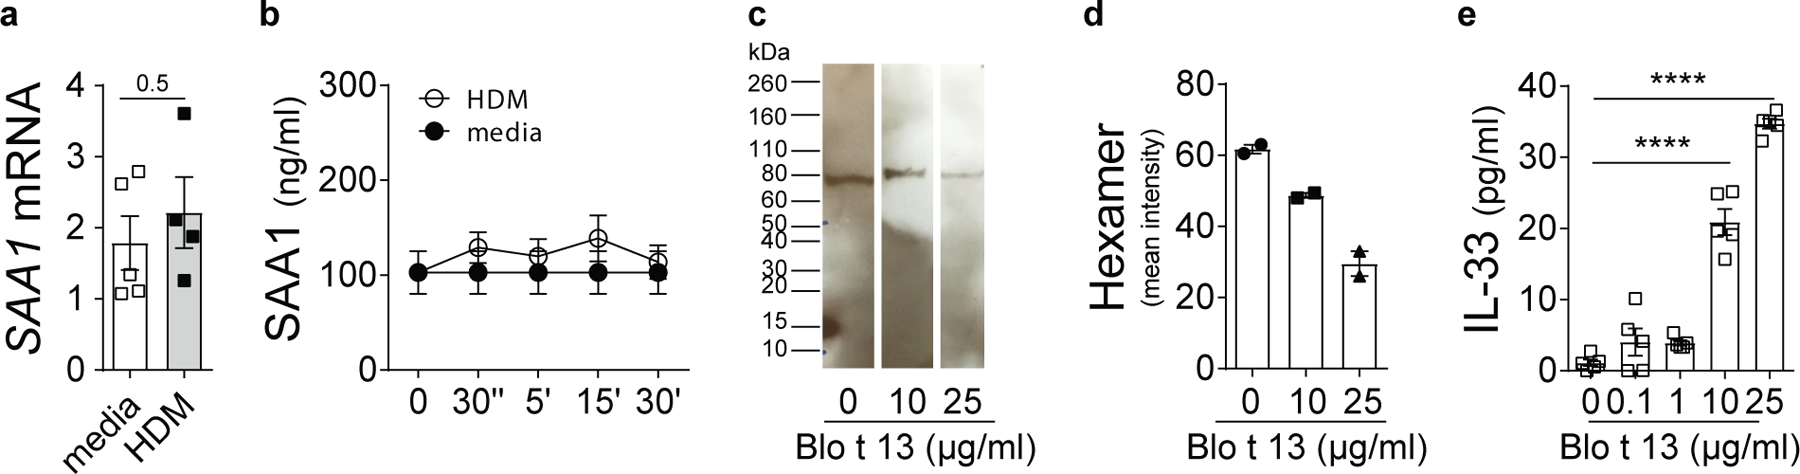
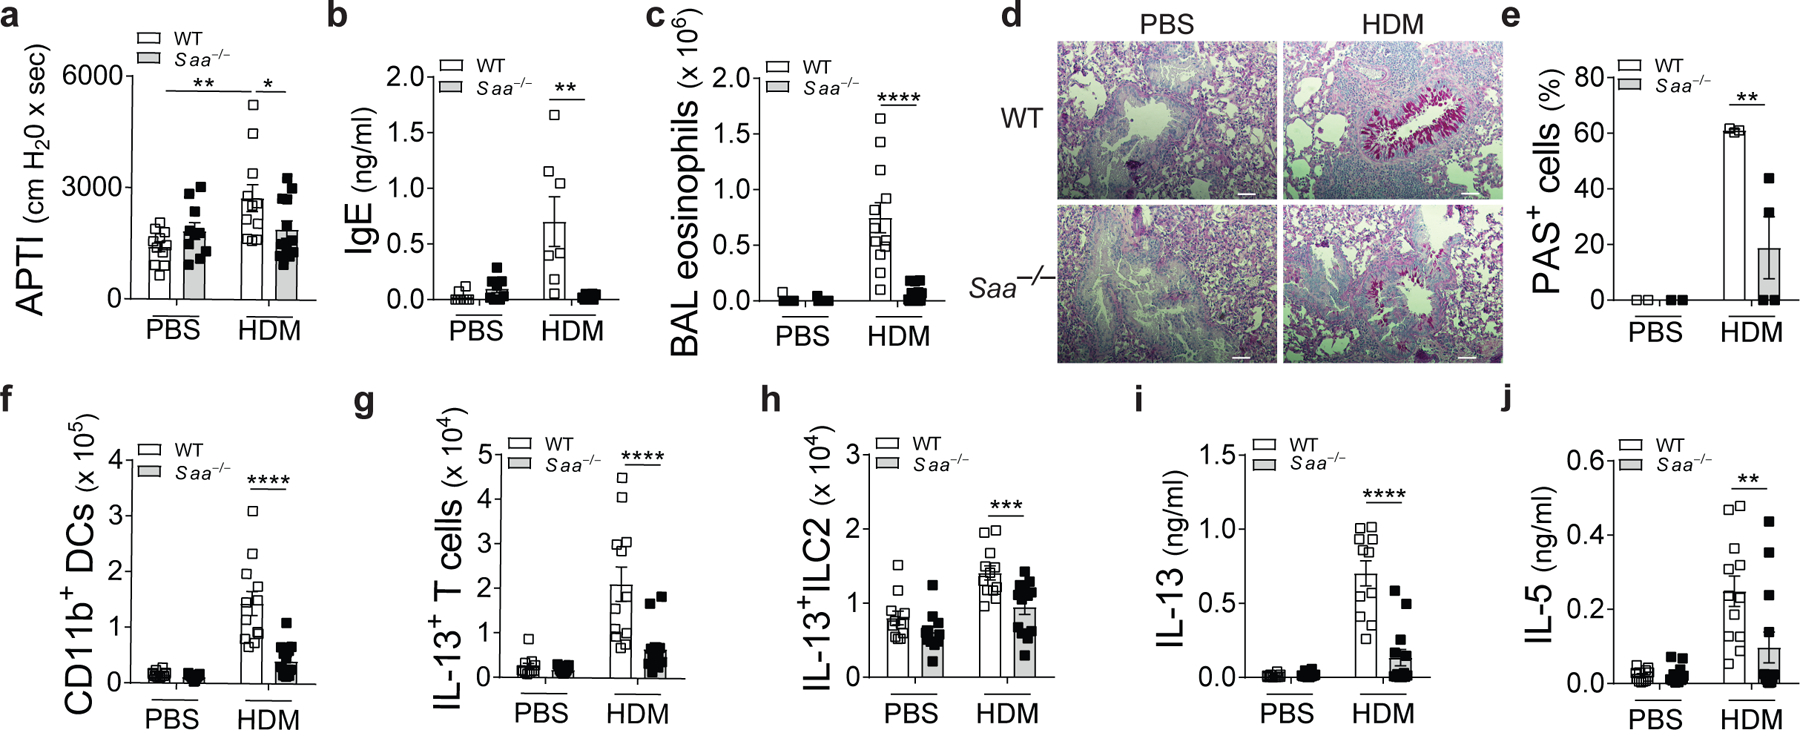
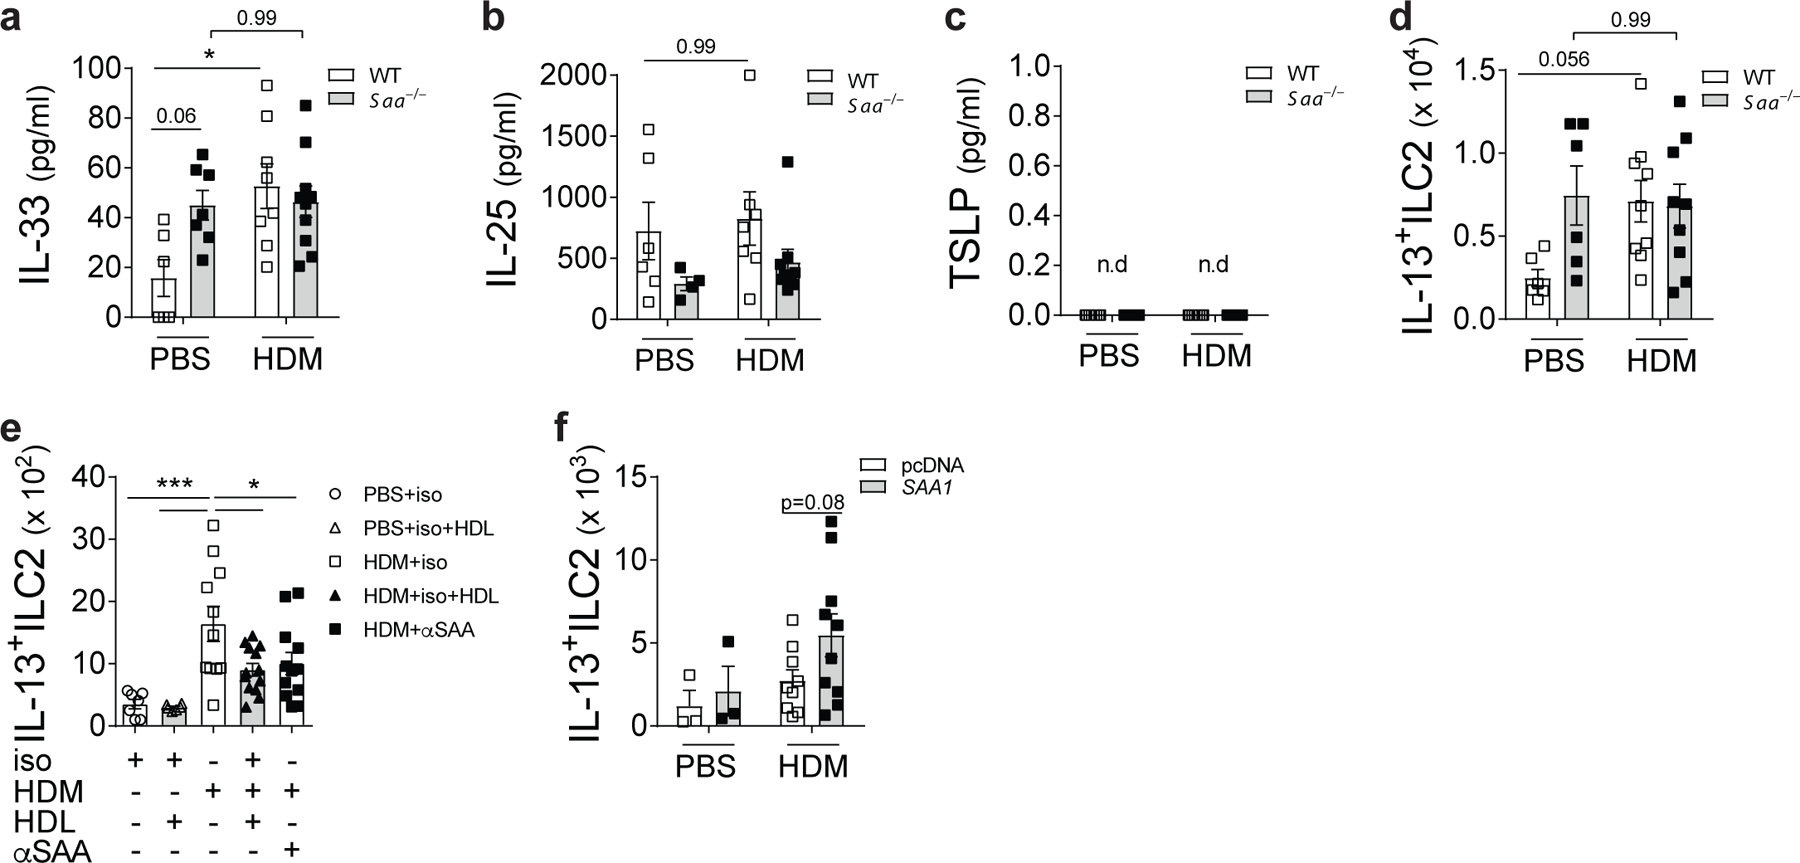
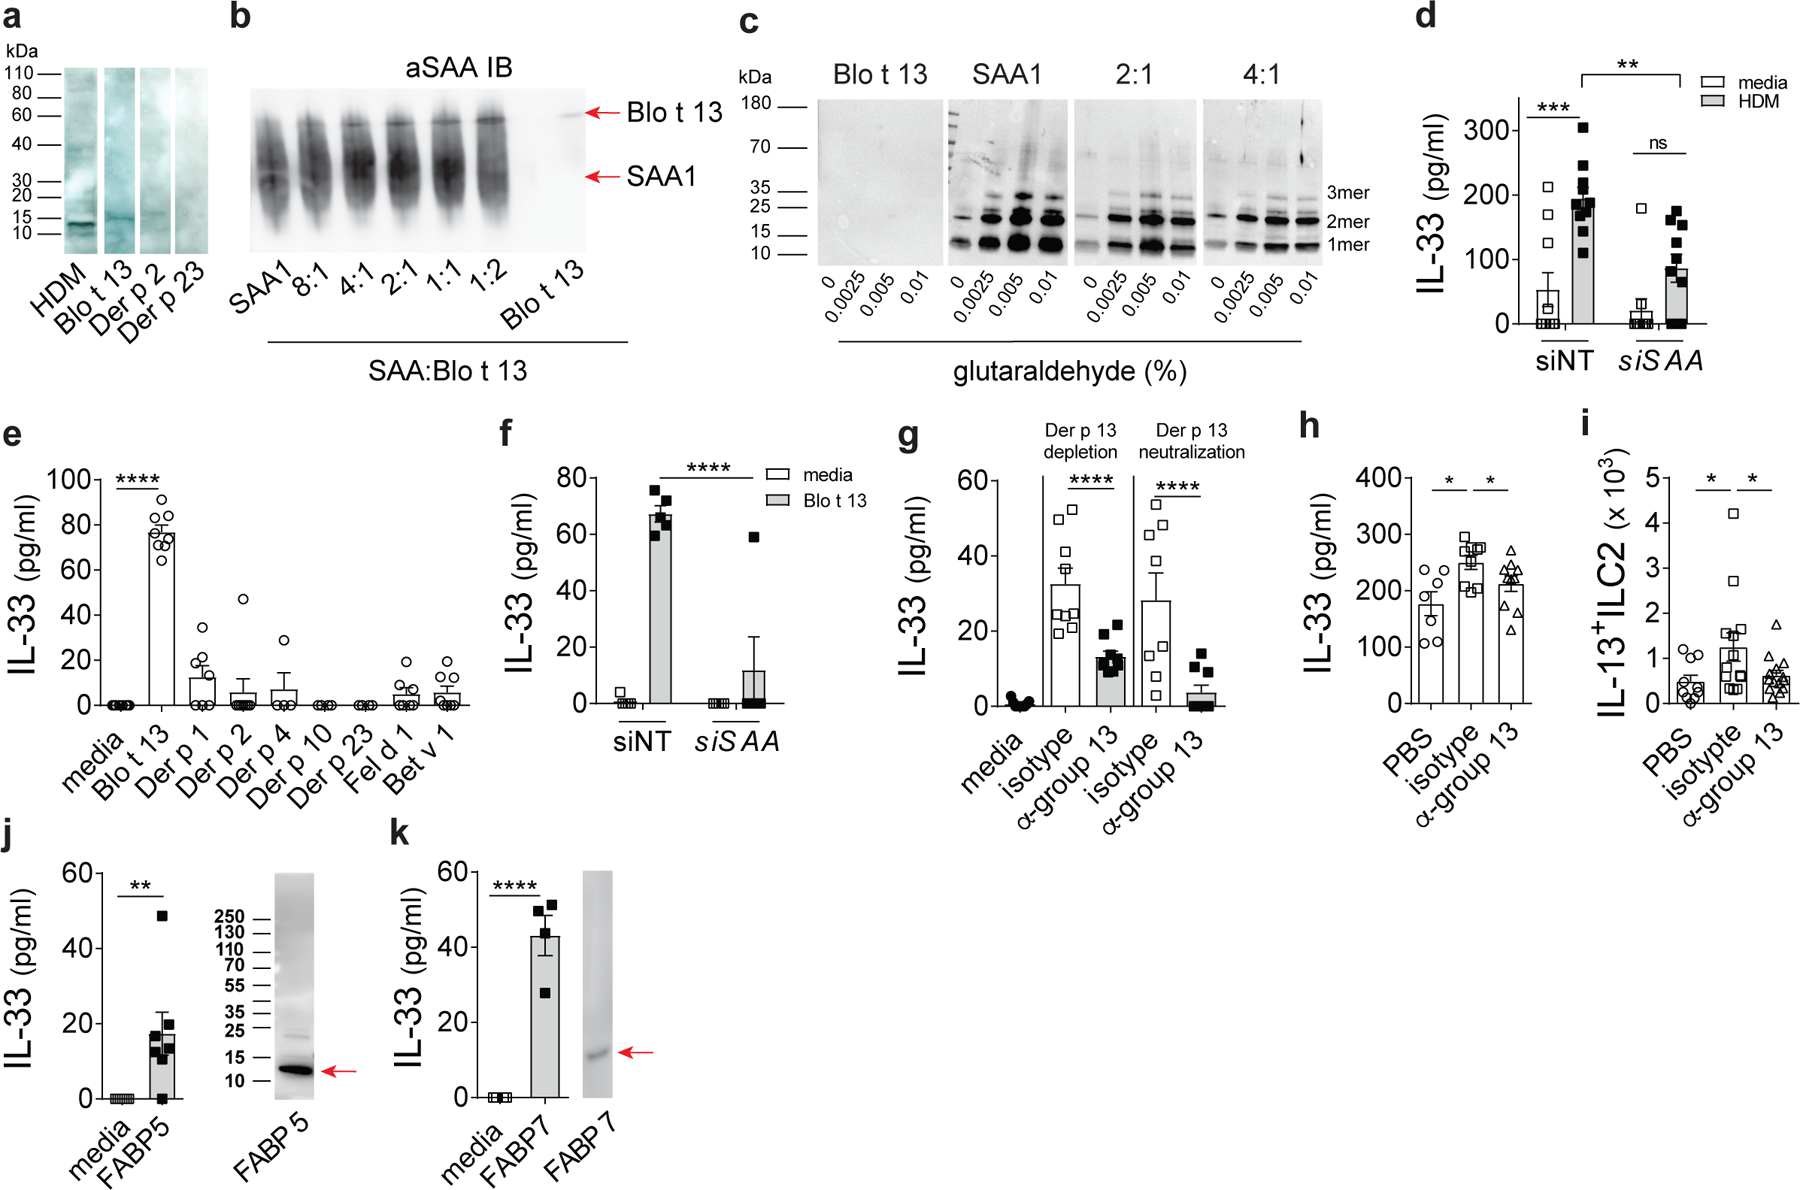
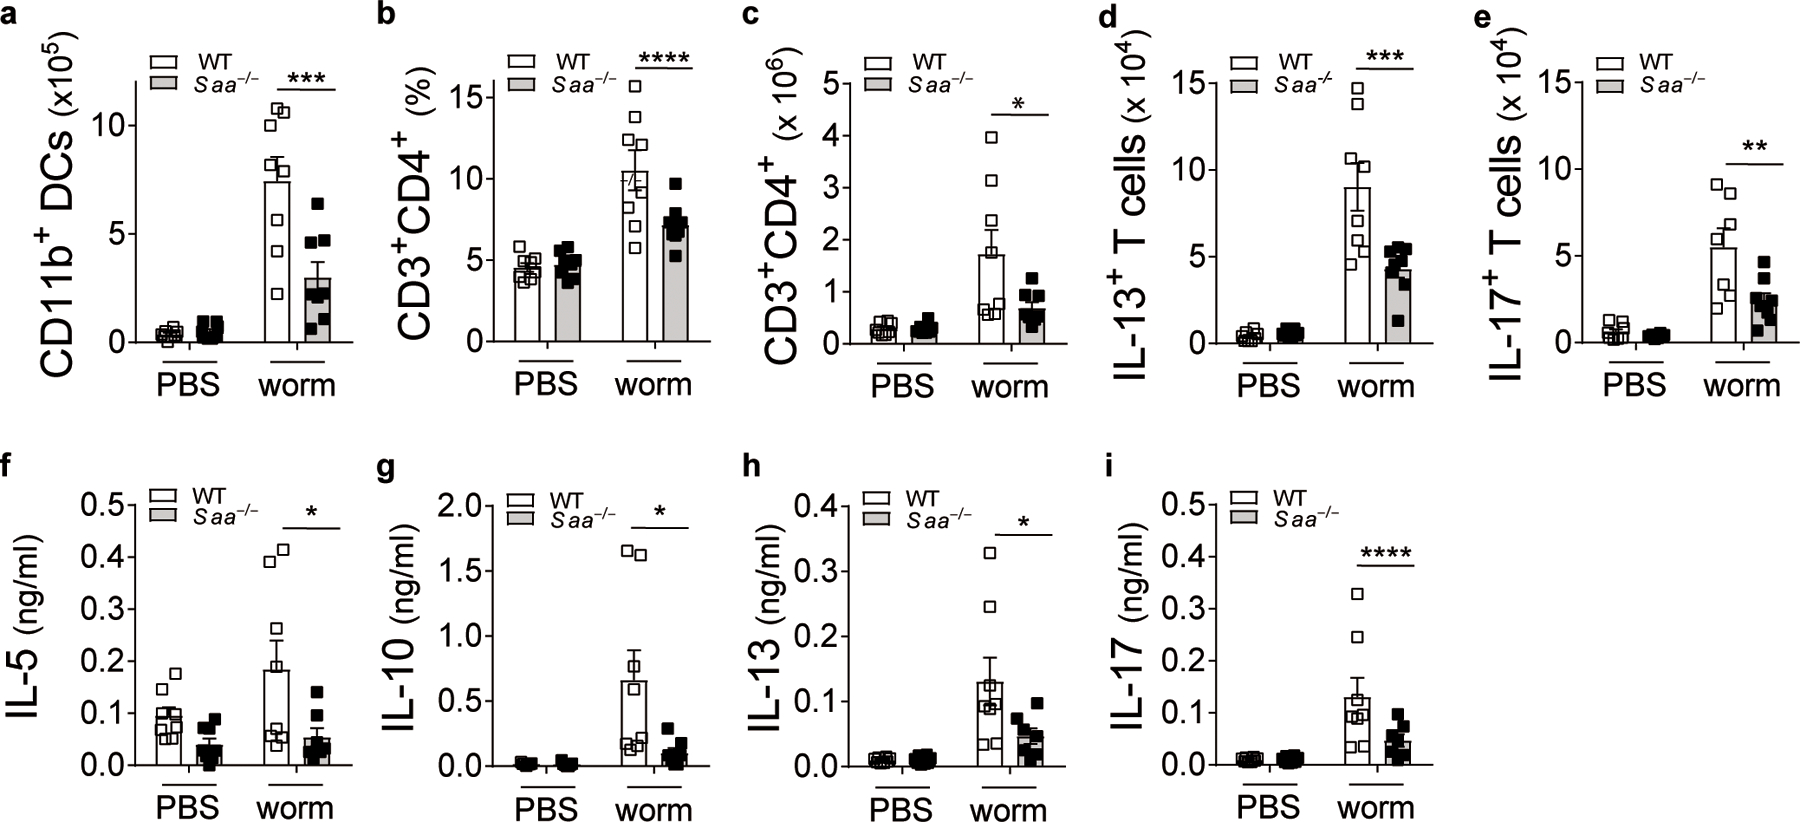
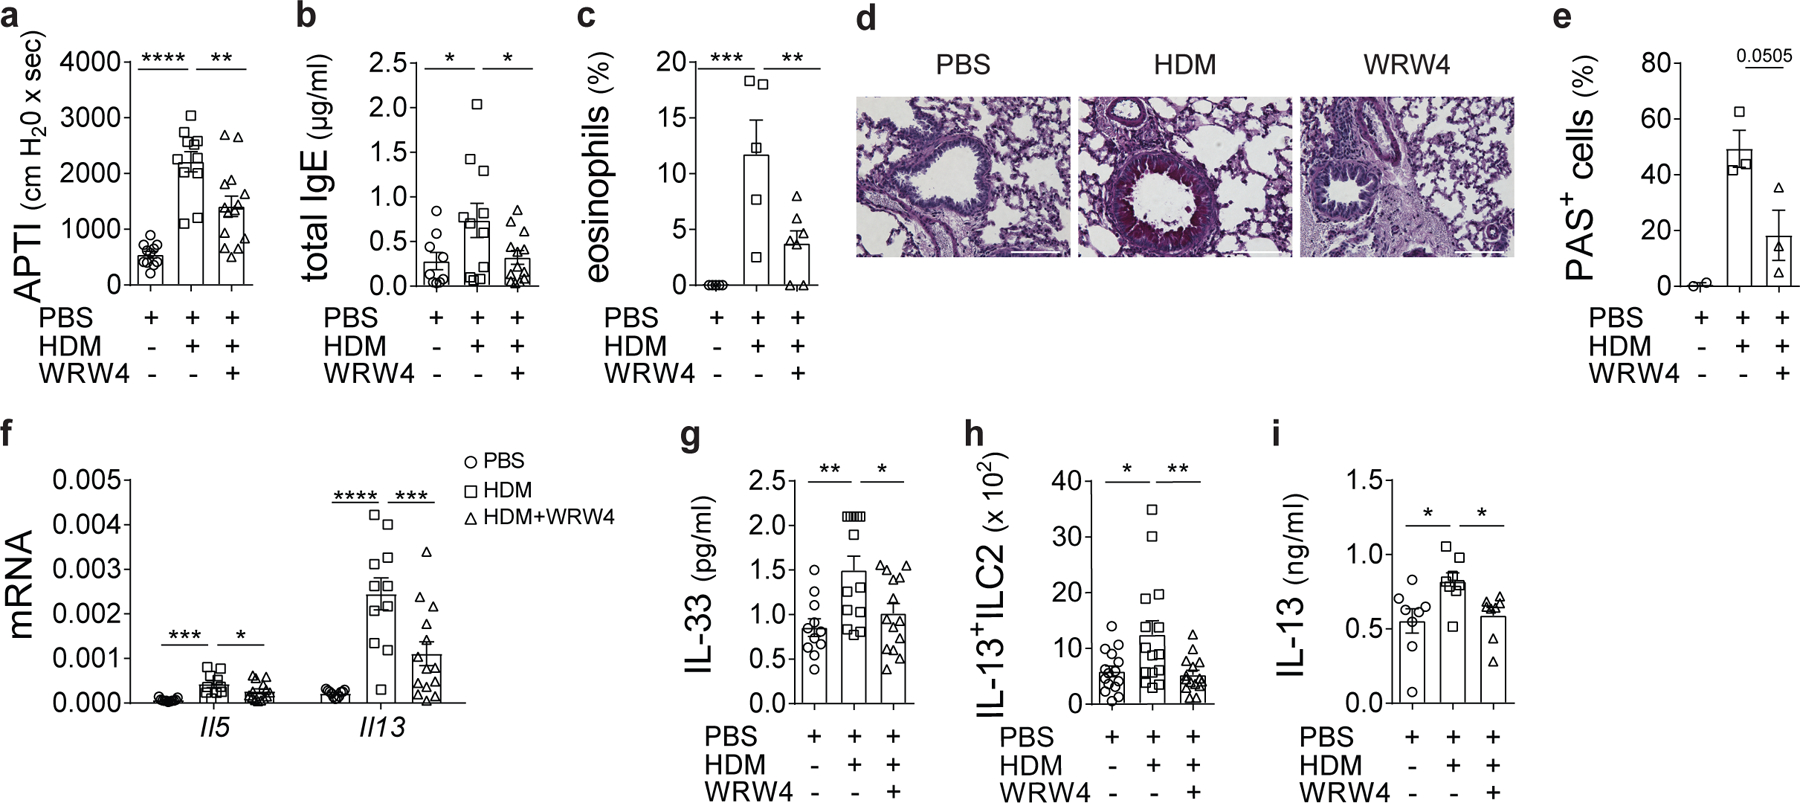
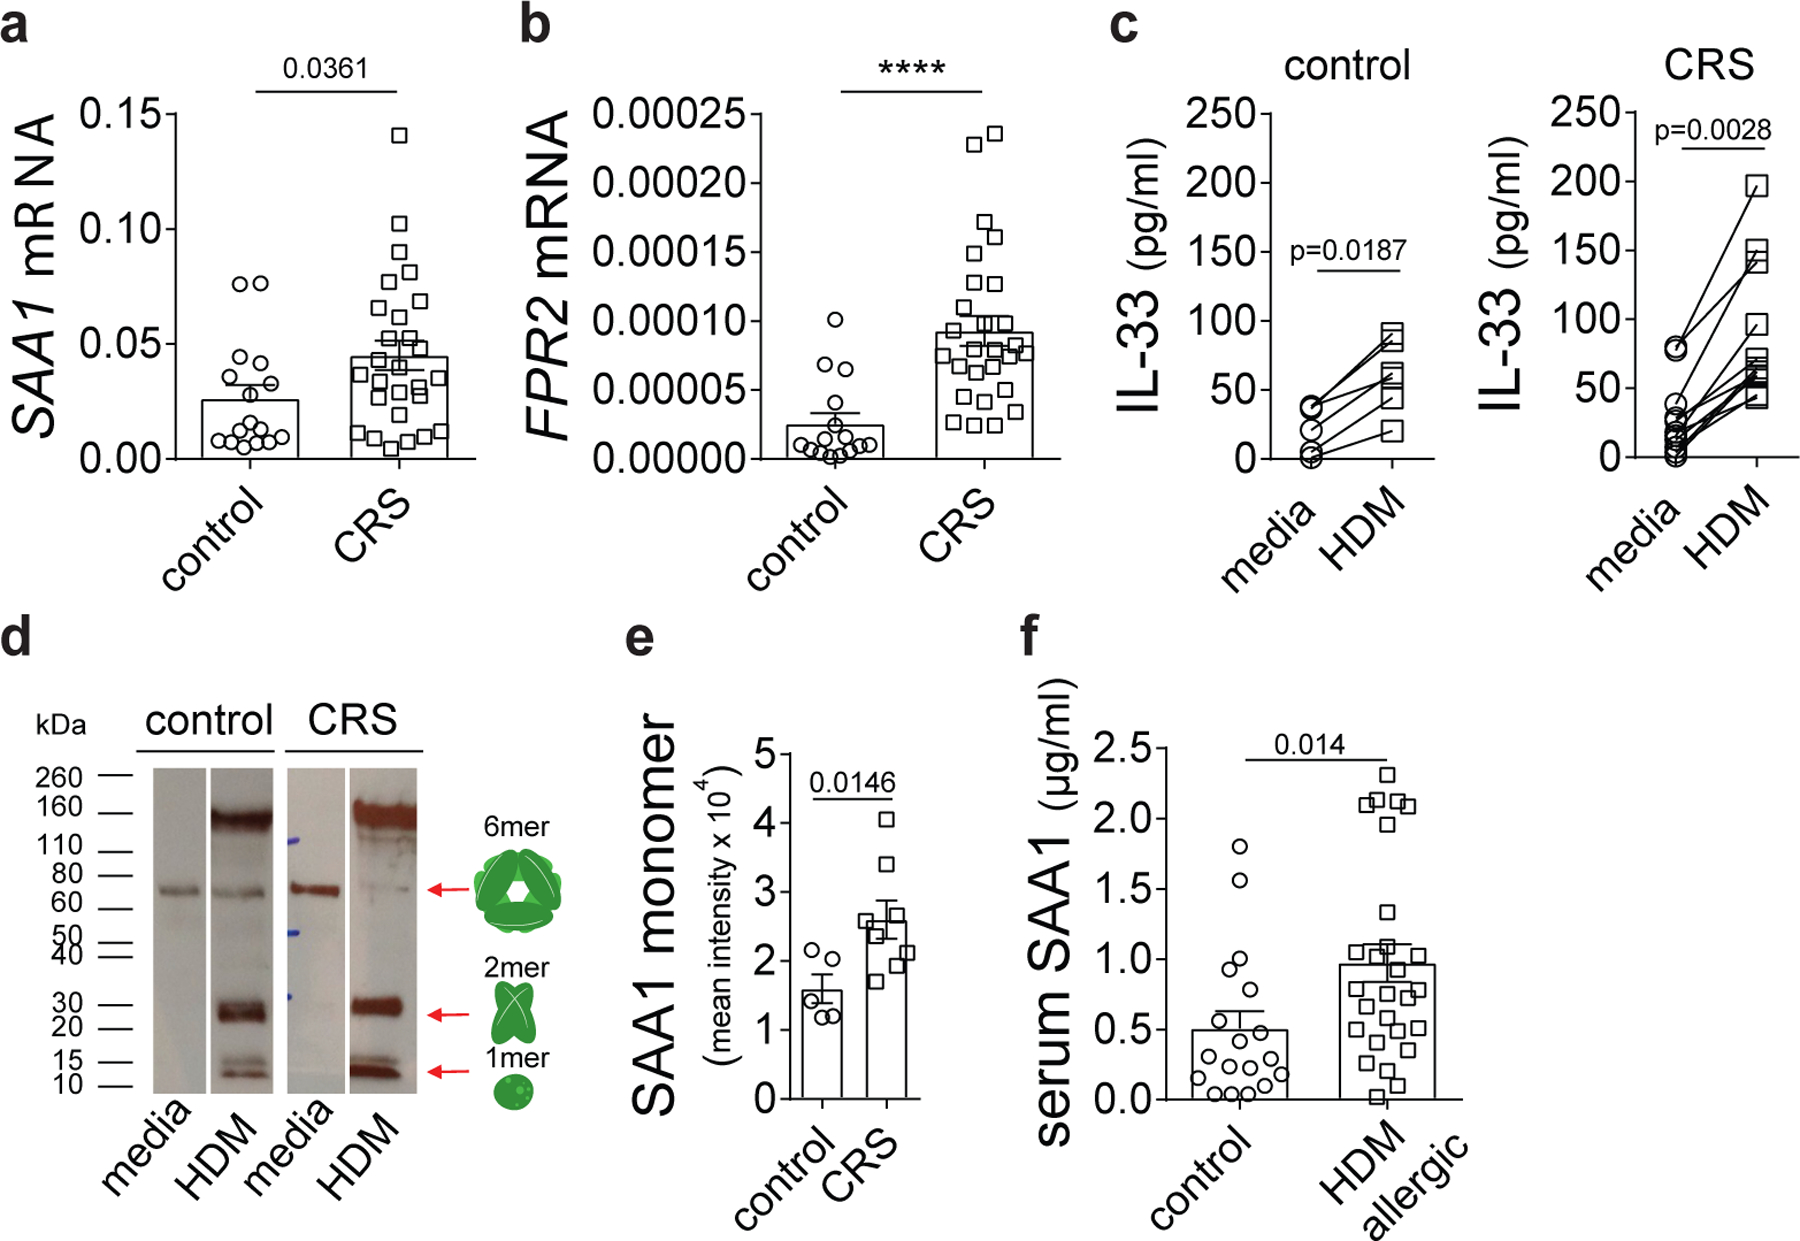
The molecular basis for the propensity of a small number of environmental proteins to provoke allergic responses is largely unknown. Herein, we report that mite group 13 allergens of the fatty acid-binding protein (FABP) family are sensed by an evolutionarily conserved acute-phase protein, serum amyloid A1 (SAA1), that promotes pulmonary type 2 immunity. Mechanistically, SAA1 interacted directly with allergenic mite FABPs (Der p 13 and Blo t 13). The interaction between mite FABPs and SAA1 activated the SAA1-binding receptor, formyl peptide receptor 2 (FPR2), which drove the epithelial release of the type-2-promoting cytokine interleukin (IL)-33 in a SAA1-dependent manner. Importantly, the SAA1-FPR2-IL-33 axis was upregulated in nasal epithelial cells from patients with chronic rhinosinusitis. These findings identify an unrecognized role for SAA1 as a soluble pattern recognition receptor for conserved FABPs found in common mite allergens that initiate type 2 immunity at mucosal surfaces.


Conflict of interest statement

Competing Interests Statement: The authors have no competing interests to declare.

Figures

Extended Data Fig. 1:
Extended Data Fig. 1:. Experimental design.
(a) Model of allergen-induced airway hyperresponsiveness (AHR) for wild-type (WT) and Saa–/– mice (both C57BL/6 background). Mice were sensitized i.t. on day 0 (1 μg) and i.n. on days 7–11 with 10 μg of HDM extract. Airway measurements were performed 72 h after the last allergen challenge (used in Fig. 1a-j and Extended Data Fig. 2 and 3). (b) For SAA1 antibody blockade, we used an established mouse model of allergen-induced AHR sensitizing WT BALB/cJ mice i.t. on day 0 and 14 with 100 µg of HDM extract + isotype control, or HDM + αSAAab. Airway measurements and tissue harvests were performed 72 h after the last allergen challenge (used in Extended Data Fig. 4). (c) In short-term exposure protocols WT and Saa–/– mice (both C57BL/6 background) received a single HDM challenge (100 μg) were sacrificed 16 h later (used in Fig. 2a-d). (d) In short-term exposure protocols BALB/cJ mice received a single HDM challenge (100 μg)+ isotype control, HDM challenge + HDL (200μg) and isotype control, or HDM + αSAAab and were sacrificed 24 h later (used in Fig. 2e). Contol mice received either PBS + isotype or PBS + HDL and isotype control. (e) For overexpression of SAA1 in vivo, mice were injected 20 µg of DNA complexed to polyethylenimine at day 0, exposed to PBS or HDM 48 h later and ILC2s as well as BAL cytokines measurements were performed on day 3 (used Fig. 2f). (f) WT and Saa–/– mice were sensitized i.t. on day 0 (1 μg) and i.n. on days 7–11 with 10 μg with extracts from the parasitic worm Schistosoma mansoni (a Puerto Rican isolate). Tissues were harvested 72 h after the last allergen challenge (used in Fig. 4). (g) For FPR2 blockade (WRW4, 2 mg/kg), WT BALB/cJ mice were sensitized and challenged i.t. on day 0 and 14 with 100 μg of HDM extract. Airway measurements were performed 72 h after the last allergen challenge (used in Fig. 7a-f). (h) In short term exposure experiments, BALB/cJ mice received a single HDM challenge (100 μg) or HDM + WRW4 and were sacrificed 24 h later (used in Fig. 7g and i). (i) Model of Alternaria alternata (Alt a )-induced airway inflammation for WT and Saa–/– mice. Mice were sensitized i.t. on day 0 (1 μg) and i.n. on days 7–11 with 10 µg of Alt a extract. Tissues were harvested 72 h after the last allergen challenge (used in Extended Data Fig. 9f-j).
Extended Data Fig. 2:
Extended Data Fig. 2:. Reduced recruitment of CD11b+ DCs in Saa–/– mice after allergen exposure.
Allergic phenotype in WT and Saa–/– mice sensitized and challenged with PBS or HDM was analyzed seventy-two hours after the last challenge. (a) Lung cell gating strategy used in Fig. 1, Fig. 4, Extended Data Fig. 6 and Extended Data Fig 9. Frequency of dendritic cell (DC) populations (b-d), monocytes (e-f) and granulocytes (g-h) in the lungs of WT and Saa–/– mice used in figure 1. Data represent means ± SEM of pooled data from 2 independent experiments containing n=11 WT PBS, n=12 WT HDM, n=11 Saa–/– PBS and n=13 Saa–/– HDM animals per group. P values were calculated with a two-tailed test using one-way analysis of variance (ANOVA) with Dunett’s post hoc analysis that compares WT HDM to counterparts. **P = 0.0039, ****P ≤ 0.0001.
Extended Data Fig. 3:
Extended Data Fig. 3:. Reduced migration of CD3+CD4+ T cells to the lungs of Saa–/– mice after allergen exposure.
Allergic phenotype in WT and Saa–/– mice sensitized and challenged with PBS or HDM was analyzed seventy-two hours after the last challenge. (a) ILC and T cell gating strategy (used in Fig. 1g and h, Fig. 4b-e, Extended Data Figure 6d and e and Extended Data Fig. 9h-j). (b) Total lung cell counts (**P = 0.0094), (c) frequency and (d) numbers of CD3+CD4+ T cells (**P = 0.0014) and (e) frequency and numbers of (f) ICOS+ST2+ ILCs in the lungs of WT and Saa–/– mice. Data represent pooled data presented as means ± SEM from 2 independent experiments containing n=11 WT PBS, n= 12 WT HDM, n=11 Saa–/– PBS and n=13 Saa–/– HDM animals per group. P values were calculated with a two-tailed test using one-way analysis of variance (ANOVA) with Dunett’s post hoc analysis that compares WT HDM to counterparts.
Extended Data Fig. 4:
Extended Data Fig. 4:. Airway SAA1-neutralization ameliorates the allergic phenotype.
(a) AHR (*P < 0.0105), (b) total serum IgE concentrations (*P = 0.0265), (c) eosinophil infiltration into the lungs, and (d) PAS stained lung sections of isotype (iso), HDM+isotype (HDM), or HDM+αSAAab-treated (αSAA) WT BALB/c mice. Antibodies were administered at 5 μg/i.t. Frequency of (e) Lin-CD45+ST2+IL-13+ ILC2s (**P = 0.0027, ***P = 0.0002), (f) TH2 and (*P = 0.0260, ***P = 0.0001) (g) TH17 cells (*P = 0.0149, ***P = 0.0005) in the lungs of these mice. Data represents means ± SEM of pooled data from 2 independent experiments containing (a) n=6 PBS+iso, n=7 HDM+iso, n=9 HDM+αSAA animals per group; (b, c, f, g) n=9 PBS+iso, n=11 HDM+iso, n=13 HDM+αSAA animals per group or are representative of 2 independent experiments with (e) n=4 PBS+iso, n=5 HDM+iso, n=7 HDM+αSAA animals per group. P values were calculated with a two-tailed test using one-way analysis of variance (ANOVA) with Dunett’s post hoc analysis that compares HDM to iso and αSAA counterparts. ****P ≤ 0.0001
Extended Data Fig. 5:
Extended Data Fig. 5:. SAA1 is a pattern recognition molecule for mite-derived and human cytosolic FABPs.
(a) Migration of SAA1 (1 mg/ml) in IMDM media was analyzed in the presence of the mite FABP rBlo t 13 (1 mg/ml) by native PAGE followed by immunoblot analysis using a sequence-specific antiserum (amino acid 89–104) raised against human SAA1. (b) Effects of the protein synthesis inhibitor cycloheximide on IL-33 concentrations in BEAS-2B cells treated for 30 min with HDM (100 μg/ml). (c) Cell viability of BEAS-2B cells after HDM exposure over time as measured by continuous reduction of a cell viability substrate by viable cells (**P = 0.0041). SAA1 concentrations in cells after (d) siRNA-mediated silencing of SAA1 (siSAA1) or non-targeting scrambled siRNA (siNT). Effects of SAA1 on HDM-induced IL-6 (**P = 0.0086, ***P = 0.0007) and IL-8 release in cells with siRNA mediated knockdown of SAA1 (siSAA1) (e and f). (g) HDM-induced IL-6 amounts after Der p 13-depletion and/or neutralization. Data are shown as means ± SEM and are representative of 2 (b, e) or 3 (c) independent experiments or pooled data from 2 independent experiments (d, f) each containing at least n=4 biologically independent samples. Representative analysis of SAA1 migration patterns in the presence of Blo t 13 using sequence-specific rabbit antiserum raised against human SAA1 (aa 89–104) (a). IL-6 amounts were analysed for one representative experiments with n=5 biologically independent samples (g). Cropped images are shown. P values were calculated with a two-tailed test using one-way analysis of variance (ANOVA) followed by Dunett’s post (b) or Tukey’s hoc analysis (e,f), two-way ANOVA followed by Dunnet correction (c) or Student’s t-test (d, g). ***P ≤ 0.001; ****P ≤ 0.0001.
Extended Data Fig. 6:
Extended Data Fig. 6:. Der p 13-depleted HDM has decreased TH2 skewing capacity.
(a) Total IgE serum concentrations and numbers of BAL (b) eosinophils and (c) T cells in mice undergoing a full allergen-exposure protocol using HDM that was depleted from the mite FABP Der p 13 using either an isotype control antibody or a group-13 specific antibody. Numbers of (d) mediastinal lymph node IL-13+ CD4+ T cells and (e) lung ICOS+ST2+ ILCs. Cytokine production from HDM-restimulated lung cells (*P = 0.024, ). Data represent mean ± SEM of n=2 PBS, n=4 HDM-isotype depleted, n=4 HDM- α-group 13-depleted comparing HDM-isotype to α-group 13-depleted extract group using two-tailed unpaired t-test.
Extended Data Fig. 7:
Extended Data Fig. 7:. HDM-induced IL-33 is dependent on SAA1 dissociation.
(a) mRNA and (b) protein amounts of SAA in response to HDM (100 μg/ml). (c) SAA1 hexamer after rBlo t 13 stimulation was analyzed as described in Fig. 3b. (d) Bar graph represents quantitative analysis of SAA hexamer using LI-COR Image Studio Software. (e) Concentration-dependent IL-33 release from BEAS-2B cells induced by rBlo t 13. Data are shown as means ± SEM and are pooled data from 2 independent experiments (b, e) each containing n=4–5 replicate wells or representative of 2–3 independent experiments (d). SAA1 mRNA expression, normalized to the average of housekeeping genes, is presented as mean value ± SEM (n = 5). Immunoblot is representative of an experimental n=2. Cropped images are shown. P values were calculated with a two-tailed test using Student’s t-test (a), two-way analysis of variance (ANOVA) followed by Dunnet’s correction (b) or one-way ANOVA with Dunett’s post hoc analysis (d, e). ****P ≤ 0.0001.
Extended Data Fig. 8:
Extended Data Fig. 8:. The SAA1-FPR2 axis regulates IL-33.
(a) mRNA expression of the FPR family members FPR1, FPR2 and FPR3 at baseline (open bars) or after 2 h of HDM stimulation (filled bars). (b) HDM-triggered IL-33 amounts in BEAS-2B cells overexpressing human FPR1 (**P = 0.0068, ***P = 0.0003). (c) IL-33 secretion in BEAS-2B cells overexpressing human FPR2 or cells transfected with an empty vector (EV; pcDNA3.1) (**P = 0.0068, ***P = 0.0003). HDM-induced IL-6 and IL-8 amounts in BEAS-2B cells overexpressing FPR2 (d and e) or blocking the FPR2 receptor (f (**P = 0.0043) and g (**P = 0.0021)) using WRW4. Data presented as means ± SEM and is representative of 2 independent experiments each containing at least n= 4 biologically independent samples (b, d, f) or pooled data from 2 independent experiments (c, e, g). mRNA expression, normalized to the average of housekeeping genes, is presented as mean values ± SEM (n = 5 biologically independent samples) performed in duplicates (a). P values were calculated with a two-tailed test using Student’s t-test (a) or one-way analysis of variance (ANOVA) with Tukeys multiple comparison test (b-e) or Dunett’s post hoc analysis (f, g). ****P ≤ 0.0001
Extended Data Fig. 9:
Extended Data Fig. 9:. SAA1-IL-33 axis is specific to HDM and not induced by Alternaria alternata:
(a) Immunoblot of SAA1 after Alternaria alternata (Alt a) stimulation of BEAS-2B cells performed as described in Fig. 3b. Alt a-induced IL-33 and IL-8 (**P = 0.0044) secretion in BEAS-2B cells after siRNA-mediated silencing of SAA1 (siSAA1) (b and c) or WRW4-mediated FPR2 blockade (d and e). (f) Total serum IgE concentrations, (g) eosinophil counts and frequency of (h) CD3+CD4+, (i) TH2 and (j) TH17 cells in the lungs of PBS or Alt a-treated WT and Saa–/– mice. Immunoblots are representative of an experimental n=2 (a). Data are presented as means ± SEM and represent pooled data from 2 independent experiments (b, d, e, f, g, i, j) or show one representative experiment (c) each containing at least n= 4 biologically independent samples or n=8 WT PBS, n=13 WT Alt a, n=8 Saa–/– PBS and n=11 Saa–/– Alt a animals per group (f, g, i, j) or n=5 WT PBS, n=9 WT Alt a, n=5 Saa–/– PBS and n=7 Saa–/– Alt a animals per group (h). Cropped images are shown. P values were calculated with a two-tailed test using one-way analysis of variance (ANOVA) with Tukeys multiple comparison test (a, b) or Dunett’s post hoc analysis (d-j). ****P ≤ 0.0001 siNT = non-targeting siRNA; siSAA1 = SAA1-targeting siRNA. ns=not significant.
Extended Data Fig. 10:
Extended Data Fig. 10:. Dysregulated SAA and FPR2 expression in patients with asthma.
Basal (a) SAA1 and (b) FPR2 expression in bronchial epithelial from asthmatic patients and matched controls. Data represents means ± SEM of (a and b) n= 6 control and n= 6 asthmatic patients per group. x.
Fig. 1:
Fig. 1:. SAA drives HDM-induced allergic airway inflammation.
Allergic phenotype in WT and Saa–/– C57BL/6 mice sensitized and challenged with HDM was analyzed seventy-two hours after the last challenge. Control mice received PBS at both sensitization and challenge. (a) Airway responses to cholinergic stimulation shown as airway pressure over time (APTI, *P = 0.0378, **P = 0.0019), (b) total serum IgE concentrations (**P = 0.0019), (c) bronchoalveolar lavage (BAL) eosinophilia and (d and e) histological examination of airway inflammation. Sections were stained for mucus production with periodic acid Schiff (PAS; Scale bars 100 μm) and bar graphs represent percentage of mucus positive cells in the airways (*P = 0.0241). Numbers of (f) CD11b+ DCs, (g) IL-13+ CD3+CD4+ and (h) IL-13+ILC2 cells (***P = 0.0003) in the lungs and (i and j) TH2 cytokine production from HDM-restimulated lung cells (**P = 0.0018). Data represent means ± SEM of pooled data from 2 independent experiments containing n=11 WT PBS, n=12 WT HDM, n=11 Saa–/– PBS and n=13 Saa–/– HDM animals per group (a, c, and f-j), n=2 WT PBS, n=3 WT HDM, n=2 Saa–/– PBS and n=4 Saa–/– HDM animals per group (d, e), or are representative of 2 experiments (b) with n=8 WT PBS, n=7 WT HDM, n=8 Saa–/– PBS and n=8 Saa–/– HDM animals per group. P values were calculated with a two-tailed test using one-way analysis of variance (ANOVA) with Dunett’s post hoc (b, c, e-j) or Holm-Sidak’s (a) analysis that compares WT HDM to counterparts. ***P ≤ 0.001; ****P ≤ 0.0001.
Fig. 2:
Fig. 2:. SAA signaling was also necessary for the innate manifestation of type 2 immunity.
Increase of the type 2 cytokines (a) IL-33 (*P = 0.0138), (b) IL-25, and (c) TSLP in the BAL of WT and Saa–/– mice 24h after a single dose of PBS or HDM. (d) Numbers of IL-13+ ILC2 cells in the lungs of these mice. (e) Effects of local SAA1 neutralization in WT BALB/c mice through HDL (*P = 0.0117) or local SAA antibody blockade (αSAA, *P = 0.0392) of WT BALB/c receiving isotype (iso), HDM+isotype (HDM+iso), or HDM+αSAAab-treated (HDM+αSAA). (f) Effects of SAA1 overexpression on numbers of Lin-CD45+CD25+ST2+IL-13+ ILC2s in the lungs. For overexpression, WT mice were injected retro-orbitally with a SAA1 overexpression plasmid (SAA1, grey bars) or a non-coding control vector (pcDNA, open bars). Data represent means ± SEM of pooled data from 2 independent experiments containing (a-c) n= 6 WT PBS, n=8 WT HDM, n=7 Saa–/– PBS and n=10 Saa–/– HDM animals per group; (d) n= 5 WT PBS, n=9 WT HDM, n=6 Saa–/– PBS and n=9 Saa–/– HDM animals per group; (e) n=7 PBS+iso, n=6 PBS+iso/HDL, n= 11 HDM+iso, n=13 HDM+iso/HDL, n=12 HDM+αSAA animals per group; (f) n=3 pcDNA PBS, n=9 pcDNA HDM, n=3 SAA1 PBS and n=10 SAA1 HDM animals per group. P values were calculated with a two-tailed test using one-way analysis of variance (ANOVA) with Dunett’s post hoc analysis (a-e) or two-sided Student’s t-test (f). ***P ≤ 0.001
Fig. 3:
Fig. 3:. SAA1 is a soluble pattern recognition molecule for mite fatty acid binding proteins.
(a) HDM, rBlo t 13, rDer p2 or rDer p 23 were separated by SDS-PAGE followed by detection with rSAA1 and a mouse monoclonal antibody specific for human SAA1. (b) Migration of SAA1 (1 mg/ml) in PBS was analyzed in the presence of increasing amounts of the mite FABP Blo t 13 (4:1 (0.25 mg/ml), 2:1 (0.5 mg/ml), 1:1 (1 mg/ml) and 1:2 (2 mg/ml) of Blo t 13) by native PAGE followed by immunoblot analysis using mouse monoclonal antibody specific for human SAA1 (R&D systems; MAB30196). (c) SAA1 (1 mg/ml) was chemically cross-linked in the presence of Blo t 13 added at a ratio of 1:2 or 1:4 (as indicated) using 0.0025%, 0.005%, and 0.01% glutaraldehyde and analysed by immunoblot using sequence-specific (amino acid 14–30) rabbit antiserum for human SAA1 (densitometric analysis shown in supplementary table 1). (d) HDM-induced IL-33 concentrations in BEAS-2B cells after siRNA-mediated silencing of SAA1 (siSAA1) or non-targeting scrambled siRNA (siNT) (**P = 0.0002, ns = 0.1911). (e) IL-33 amounts induced by individual mite or unrelated major cat (Fel d 1) and birch pollen (Bet v 1) allergens (10 μg/ml) (. (f) Blo t 13-induced IL-33 in BEAS-2B cells with siRNA-mediated silencing of SAA1 (siSAA1) or transfected with non-targeting scrambled siRNA (siNT). (g) IL-33 amounts induced by Der p 13-depleted HDM extract and HDM extract where Der p 13 was neutralized (100 μg/ml). (h) BAL IL-33 levels (*P = 0.0209, ***P = 0.006) as well as (i) Lin-CD45+ST2+IL-13+ ILC2s in the lungs of WT BALB/c mice receiving a single i.t. challenge with 100 μg Der p 13-depleted HDM extract as compared to isotype-treated control extract (*P = 0.0423). IL-33 amounts induced in the BEAS-2B cell line and SAA1 binding by the human fatty acid binding proteins (j) FABP5 (**P = 0.0207) and (k) FABP7. Cropped images are shown. Data are shown as means ± SEM and are pooled data from 2 (d, e, g, j) or 3 (h, i) independent experiments or representative of 2 (k) or 3 independent experiments (f) each containing at least n=4 biologically independent samples or n=8 PBS, n=12 HDM-isotype and n= 14 HDM-α-group 13 (h) and or n=10 PBS, n=13 HDM-isotype and n= 14 HDM-α-group 13 (i) animals per group. Immunoblots are representative of an experimental n=2 (a-c, j, k). P values were calculated with a two-tailed test using one-way analysis of variance (ANOVA) with Tukey’s multiple comparison test (d, e, f), Dunett’s (h) or Holm-Sidaks (i) post hoc analysis, and two-tailed Student’s t-test with Welch’s correction (g, j, k) ****P ≤ 0.0001.
Fig. 4:
Fig. 4:. Schistsoma mansoni worm extract-triggered TH2 skewing is impaired in Saa–/– mice.
The parasitic worm Schistosoma mansoni (a Puerto Rican isolate) routinely maintained in the laboratory by cycling between the intermediate snail host, Biomphalaria glabrata, and outbred ICR mice as definitive hosts. (a) Numbers of CD11b+ DCs in the lungs of PBS or Schistosoma mansoni worm extract-treated WT and Saa–/– C57BL/6 mice (***P = 0.0002). (b) Frequency and (c) total numbers of CD3+CD4+ T cells (*P = 0.014). (d) TH2 (***P = 0.0003) and (e) TH17 (**P = 0.0014) cells in the lungs of these mice. (f-i) Cytokine production from worm extract-restimulated lung cells (IL-5: *P = 0.019, IL-10: *P = 0.011, IL-13: *P = 0.017, IL-17: *P = 0.017). Data represents means ± SEM of pooled data from 2 independent experiments containing a total of n= 8 animals in each group. P values were calculated with a two-tailed test using one-way analysis of variance (ANOVA) with Dunett’s post hoc that compares WT worm to counterparts. ****P ≤ 0.0001.
Fig. 5:
Fig. 5:. HDM-induced IL-33 is dependent on SAA1 dissociation.
(a) Sequence of SAA1. Indicated are: secondary structure α-helices (α 1–4) and loops (connecting lines between α-helices), C-terminal tail (CTL). Amino acids located within the hydrophobic core of the SAA1 hexamer are shaded in green. The epitopes recognized by affinity-purified IgGs raised against residues 27–44, 40–63, 68–84, and 89–104 are indicated by yellow lines (used in panel e). The mutation site at the hydrophobic core is indicated by an orange dot (used in panel f). C-terminal deletion of amino acids (Δ1–11) is shaded in blue. (b) BEAS-2B supernatants were cleared of lipid-bound SAA1 pulling down HDL-bound SAA1 using a polyclonal goat anti-ApoA1 antibody. Cleared supernatants were immunoblotted with a monoclonal mouse anti-human SAA1 antibody (Acris). (c) IL-33 secretion induced by rSAA1 alone (open bars) or in complex with a mouse monoclonal antibody specific for human SAA1 (αSAA ab, closed bars) in the BEAS-2B cell line. (d) Supernatants of cells left either untreated (media) or stimulated with recombinant SAA1 (rSAA) and immunoblotted with a monoclonal antibody specific for human SAA (R&D Systems; MAB30196). (e) IL-33 release from BEAS-2B cells after incubation with sequence-specific rabbit antisera specific for human SAA1 (**P = 0.0029). (f) HDM-triggered IL-33 release in BEAS-2B cells transfected with empty plasmid control (EV), wildtype SAA1 (WT) overexpression plasmid or a SAA1 plasmid with a Trp to Ala mutation at position 53 of the amino acid sequence (W53A) to mutate the hydrophobic core of SAA1 (WT to EV **P = 0.0032; WT to W53A **P = 0.0085). (g) HDM-induced IL-33 amounts in epithelial cells grown in media supplemented with charcoal-stripped FBS (**P = 0.0027). Cropped images are shown. Data shown as means ± SEM represent are representative of 2 independent experiments (c, d, f, g) or 3 (e) each containing at least n=4 biologically independent samples. Blots are representative of 2 (d) and 4 (b) independent experiments. P values were calculated with a two-tailed test using one-way analysis of variance (ANOVA) with Tukey’s multiple comparison test (e, g) or Dunett’s post hoc analysis (f). ****P ≤ 0.0001
Fig. 6:
Fig. 6:. SAA1 signals via the FPR2 receptor to induce IL-33.
IL-33 concentrations in BEAS-2B cells blocking the SAA-binding receptors (a) FPR2 (WRW4, 12 μM; ***P = 0.0006) and (b) TLR4 (LPS from Rhodobacter sphaeroides; LPS-RS, 10 μg/ml; ). (c) Effects of FPR2 or TLR4 blockade in cells transfected with empty plasmid control (EV) or SAA1 overexpression plasmid. **P = 0.0047 § indicates p = 0.056; # indicates p = 0.22 between EV and SAA plasmid. Blockade of (d) CD36 (anti-human CD36 blocking antibody, aCD36; 10 μg/ml; ***P = 0.0005), (e) the P2 receptor antagonist suramin (100 μM; *P = 0.028), and (f) TLR2 (anti-human TLR2 IgA, aTLR2, 10 μg/ml; **P = 0.0055). (g) HDM-triggered IL-33 release in BEAS-2B cells transfected with EV, WT SAA1 overexpression plasmid or a SAA1 plasmid with a deletion of the C-terminal amino acids 1–11 (Δ1–11; *P = 0.01, **P = 0.0078 ). Data are representative of 2–3 independent experiments (b, d-f) or pooled data from 2 independent experiments (a, c, d, g) each containing at least n=4 biologically independent samples and depicted as means ± SEM. P values were calculated with a two-tailed test using one-way analysis of variance (ANOVA) with Dunett’s (a, b, d-g) or Tukey’s (c) post hoc analysis.****P ≤ 0.0001.
Fig. 7:
Fig. 7:. FPR2 axis controls sensitization to HDM by regulating IL-33-mediated ILC2 activation and TH2 cytokine production.
(a) Airway responses to cholinergic stimulation shown as airway pressure over time (APTI) measured on day 17 in PBS, HDM, or HDM+WRW4-treated (4 mg/kg) WT BALB/c mice (**P = 0.0022). (b) Total IgE serum concentrations of treated mice (HDM to PBS **P = 0.0483; HDM to WRW4 **P = 0.0486). (c) Eosinophilic infiltration into the lungs (**P = 0.0094 and ***P = 0.0009). (d and e) Histological examination of airway inflammation. Sections were stained for mucus production with periodic acid Schiff (PAS; Scale bars 100 μm). (f) Lung expression of Il5 (*P = 0.0421 and ***P = 0.0029) and Il13 (***P = 0.0009) mRNA. (g) BAL IL-33 (*P = 0.0175 and **P = 0.0009) and (h) Frequency of Lin-CD45+ST2+IL-13+ ILC2s (*P = 0.0125 and **P = 0.0058) and (i) BAL IL-13 (HDM to PBS *P = 0.0169; HDM to WRW4 *P = 0.0398) in the lung 24 h after a single i.t. challenge with PBS, HDM (100 μg), or HDM in combination with the FPR2 inhibitory peptide WRW4 (4 mg/kg). Data represents means ± SEM of pooled data from 2 experiments containing (a, b, f) n=11 PBS, n=11 HDM, n=14 HDM+WRW4 animals per group; (d, e) n=2 PBS, n=3 HDM, n=3 HDM+WRW4 animals per group; (g) n=11 PBS, n=13 HDM, n=14 HDM+WRW4 animals per group; (h) n=15 PBS, n=15 HDM, n=15 HDM+WRW4 animals per group; or are representative of 2 (c) or 3 (i) independent experiments with (c) n=5 PBS, n=5 HDM, n=7 HDM+WRW4 animals per group and (i) n=8 animals in each group, respectively. P values were calculated with a two-tailed test using one-way analysis of variance (ANOVA) with Dunett’s post hoc (a-c, e, g-i) or Holm-Sidak’s (f) post hoc analysis that compares HDM to PBS and WRW4 counterparts. ****P ≤ 0.0001.
Fig. 8:
Fig. 8:. Epithelial SAA1 dysregulation in human type 2 immune responses.
Basal (a) SAA1 and (b) FPR2 mRNA expression in nasal epithelial cells of CRS patients and matched control donors. (c) HDM (100 μg/ml)-triggered IL-33 concentration in primary nasal epithelial cells of CRS patients as compared to controls. (d) Dissociation of hexameric SAA was analyzed separating lipid-free and lipid-bound SAA by HDL pull down using a polyclonal goat antibody specific for human ApoA1 and immunoblotting with a monoclonal mouse antibody specific for human SAA1 (Acris). (e) Bar graph represents quantitative analysis of SAA monomer band intensities (LI-COR Image Studio Software). (f) SAA1 protein amounts in sera of control donors and HDM allergic individuals. Data represents means ± SEM of (a and b) n=16 control and n=27 CRS, (c) n=6 control and n=12 CRS patients per group, (e) n=5 control and n=8 CRS patients per group and (f) n=18 control and n=27 HDM allergic patients per group. Representative immunoblot of one control and one CRS patient (d). Cropped images are shown. P values were calculated with a two-tailed test using Student’s t-test with Welch’s correction. ****P ≤ 0.0001.

Comment in

References

    1. Wills-Karp M, Nathan A, Page K & Karp CL New insights into innate immune mechanisms underlying allergenicity. Mucosal Immunol 3, 104–110 (2010). - PMC - PubMed
    1. Corrigan CJ et al. Allergen-induced expression of IL-25 and IL-25 receptor in atopic asthmatic airways and late-phase cutaneous responses. J. Allergy Clin. Immunol 128, 116–124 (2011). - PubMed
    1. Gour N et al. Dysregulated invertebrate tropomyosin-dectin-1 interaction confers susceptibility to allergic diseases. Sci Immunol 3 (20): eaam9841 (2018). - PMC - PubMed
    1. Schuijs MJ et al. Farm dust and endotoxin protect against allergy through A20 induction in lung epithelial cells. Science 349, 1106–1110 (2015). - PubMed
    1. Smole U, Kratzer B & Pickl WF Soluble pattern recognition molecules: Guardians and regulators of homeostasis at airway mucosal surfaces. Eur. J. Immunol 50, 624–642 (2020). - PMC - PubMed

Methods only references

    1. Leontovyc A et al. SmSP2: A serine protease secreted by the blood fluke pathogen Schistosoma mansoni with anti-hemostatic properties. PLoS Negl Trop Dis 12, e0006446 (2018). - PMC - PubMed
    1. Lajoie S et al. IL-21 receptor signalling partially mediates Th2-mediated allergic airway responses. Clin. Exp. Allergy 44, 976–985 (2014). - PMC - PubMed
    1. Paris G, Pozharskaya T, Asempa T & Lane AP Damage-associated molecular patterns stimulate interleukin-33 expression in nasal polyp epithelial cells. Int Forum Allergy Rhinol 4, 15–21 (2014). - PMC - PubMed
    1. Darveau ME, Jacques E, Rouabhia M, Hamid Q & Chakir J Increased T-cell survival by structural bronchial cells derived from asthmatic subjects cultured in an engineered human mucosa. J. Allergy Clin. Immunol 121, 692–699 (2008). - PubMed
    1. Goulet F et al. Morphologic and functional properties of bronchial cells isolated from normal and asthmatic subjects. Am. J. Respir. Cell Mol. Biol 15, 312–318 (1996). - PubMed

Publication types

MeSH terms