

doi: 10.1038/s41591-020-0933-1.
Epub 2020 Jun 22.
Detection of renal cell carcinoma using plasma and urine cell-free DNA methylomes
Affiliations
- PMID: 32572266
- PMCID: PMC8288043
- DOI: 10.1038/s41591-020-0933-1
Item in Clipboard
Detection of renal cell carcinoma using plasma and urine cell-free DNA methylomes
Nat Med.
2020 Jul.
Erratum in
-
Author Correction: Detection of renal cell carcinoma using plasma and urine cell-free DNA methylomes.Nat Med. 2020 Oct;26(10):1663. doi: 10.1038/s41591-020-1078-y. Nat Med. 2020. PMID: 32895574
Abstract
Improving early cancer detection has the potential to substantially reduce cancer-related mortality. Cell-free methylated DNA immunoprecipitation and high-throughput sequencing (cfMeDIP-seq) is a highly sensitive assay capable of detecting early-stage tumors. We report accurate classification of patients across all stages of renal cell carcinoma (RCC) in plasma (area under the receiver operating characteristic (AUROC) curve of 0.99) and demonstrate the validity of this assay to identify patients with RCC using urine cell-free DNA (cfDNA; AUROC of 0.86).
Figures
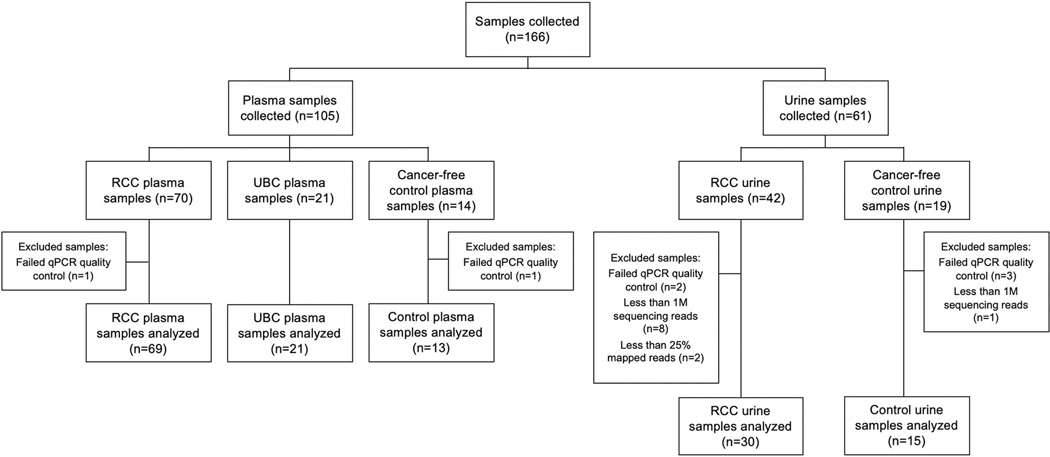
Flow chart outlining the number of cfDNA samples collected, excluded per previously established pre-defined criteria, and included in the analytical cohorts.
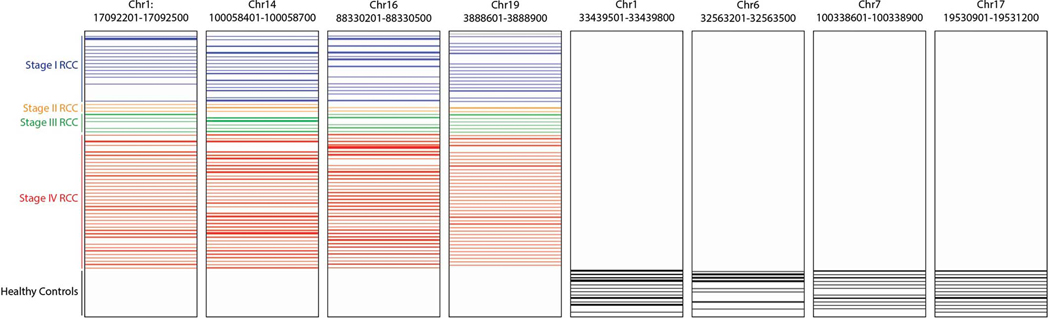
Representative sites of plasma cfDNA methylation gain (left) and loss (right) in RCC relative to controls. Each panel is a 300 base pair window. Each row represents one sample. Row height represents amount of cfDNA methylation at that site.
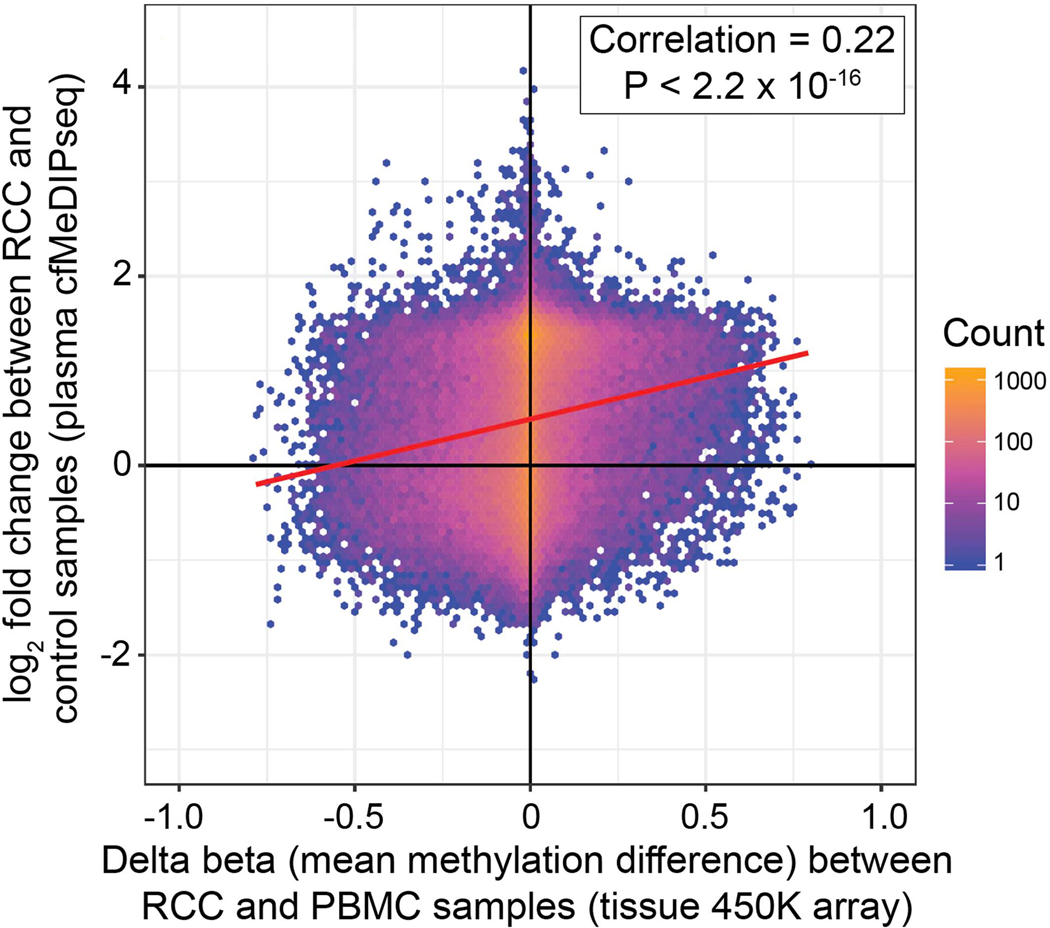
Density plot showing the overlap of plasma cfMeDIP-seq DMRs between 69 RCC and 13 control samples with differentially methylated CpGs in tissue from 450K methylation arrays between 93 peripheral blood mononuclear cell and 324 RCC tumor samples. Each observation (n=102,852) represents a 450K methylation array probe (x-axis) that overlaps a region covered by the cfMeDIP-seq assay (y-axis) where the color of each hex bin corresponds to the number of observations in that bin. A simple linear regression line is shown in red. The spearman rank correlation was computed and a 2-sided hypothesis of whether this correlation is equal to zero was carried out.
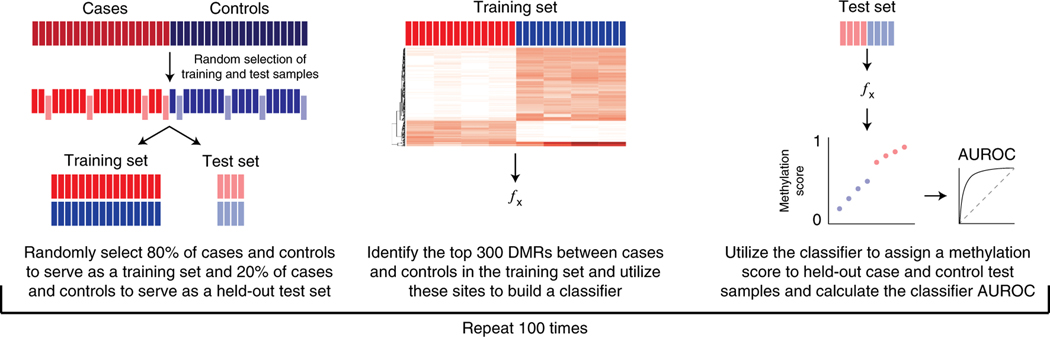
Summary figure describing the analytical methods used to classify samples based on differential methylation in cfDNA.
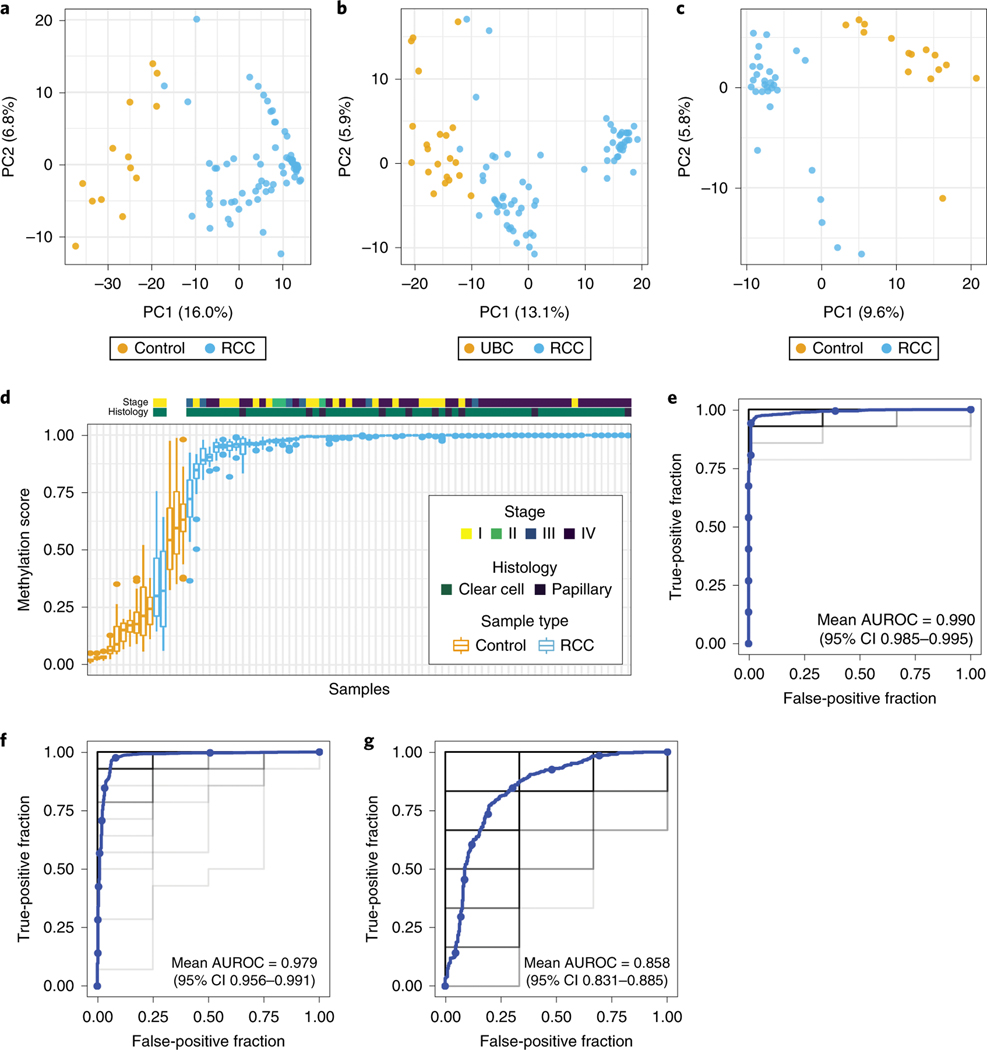
Classification of RCC using cfDNA methylomes. The top 300 DMRs between groups were used to generate principal component (PC) plots for plasma RCC versus control samples (a), plasma RCC versus UBC samples (b), and urine RCC versus control samples (c). Boxplot of methylation scores of individual plasma RCC and control samples from n=100 training-test sets (d). Boxplots are displayed with a median center line, box range of 25th to 75th percentile, and whiskers extending to the most extreme observation within 1.5 times the interquartile range (IQR); points outside the IQR are shown individually. AUROC curves for classifiers generated from n=100 training-test sets comparing plasma RCC versus control samples (e), plasma RCC versus UBC samples (f), and urine RCC versus control samples (g). Individual AUROC curves are shown in light grey with more overlapping curves indicated by darker shades of grey/black along with a smoothed mean curve in blue.
Comment in
-
Blood Test Catches Cancers That Shed Little DNA.Cancer Discov. 2020 Sep;10(9):1246-1247. doi: 10.1158/2159-8290.CD-NB2020-068. Epub 2020 Jul 14. Cancer Discov. 2020. PMID: 32665301
-
Closing in on cfDNA-based detection and diagnosis.Nat Rev Cancer. 2020 Sep;20(9):481. doi: 10.1038/s41568-020-0293-7. Nat Rev Cancer. 2020. PMID: 32690930 No abstract available.
-
Methylation extends the reach of liquid biopsy in cancer detection.Nat Rev Clin Oncol. 2020 Nov;17(11):655-656. doi: 10.1038/s41571-020-0420-0. Nat Rev Clin Oncol. 2020. PMID: 32732909 Free PMC article.
-
cfDNA methylation analysis detects RCC.Nat Rev Urol. 2020 Oct;17(10):543. doi: 10.1038/s41585-020-0366-0. Nat Rev Urol. 2020. PMID: 32782365 No abstract available.
References
-
- Shen SY et al. Sensitive tumour detection and classification using plasma cell-free DNA methylomes. Nature 563, 579–583 (2018). - PubMed
-
- Shen SY Burgener JM Bratman SV & De Carvalho DD Preparation of cfMeDIP-seq libraries for methylome profiling of plasma cell-free DNA. Nat. Protoc. 14, 2749–2780 (2019). - PubMed
Publication types
MeSH terms
Substances
Grants and funding
LinkOut - more resources
Full Text Sources
Other Literature Sources
Medical
