. 2020 Aug;26(8):1256-1263.
doi: 10.1038/s41591-020-0938-9. Epub 2020 Jun 22.

Tau molecular diversity contributes to clinical heterogeneity in Alzheimer's disease

Affiliations

Tau molecular diversity contributes to clinical heterogeneity in Alzheimer's disease

Simon Dujardin et al. Nat Med. 2020 Aug.

Erratum in

  • Author Correction: Tau molecular diversity contributes to clinical heterogeneity in Alzheimer's disease.
    Dujardin S, Commins C, Lathuiliere A, Beerepoot P, Fernandes AR, Kamath TV, De Los Santos MB, Klickstein N, Corjuc DL, Corjuc BT, Dooley PM, Viode A, Oakley DH, Moore BD, Mullin K, Jean-Gilles D, Clark R, Atchison K, Moore R, Chibnik LB, Tanzi RE, Frosch MP, Serrano-Pozo A, Elwood F, Steen JA, Kennedy ME, Hyman BT. Dujardin S, et al. Nat Med. 2021 Feb;27(2):356. doi: 10.1038/s41591-021-01251-7. Nat Med. 2021. PMID: 33514949 Free PMC article. No abstract available.

Abstract

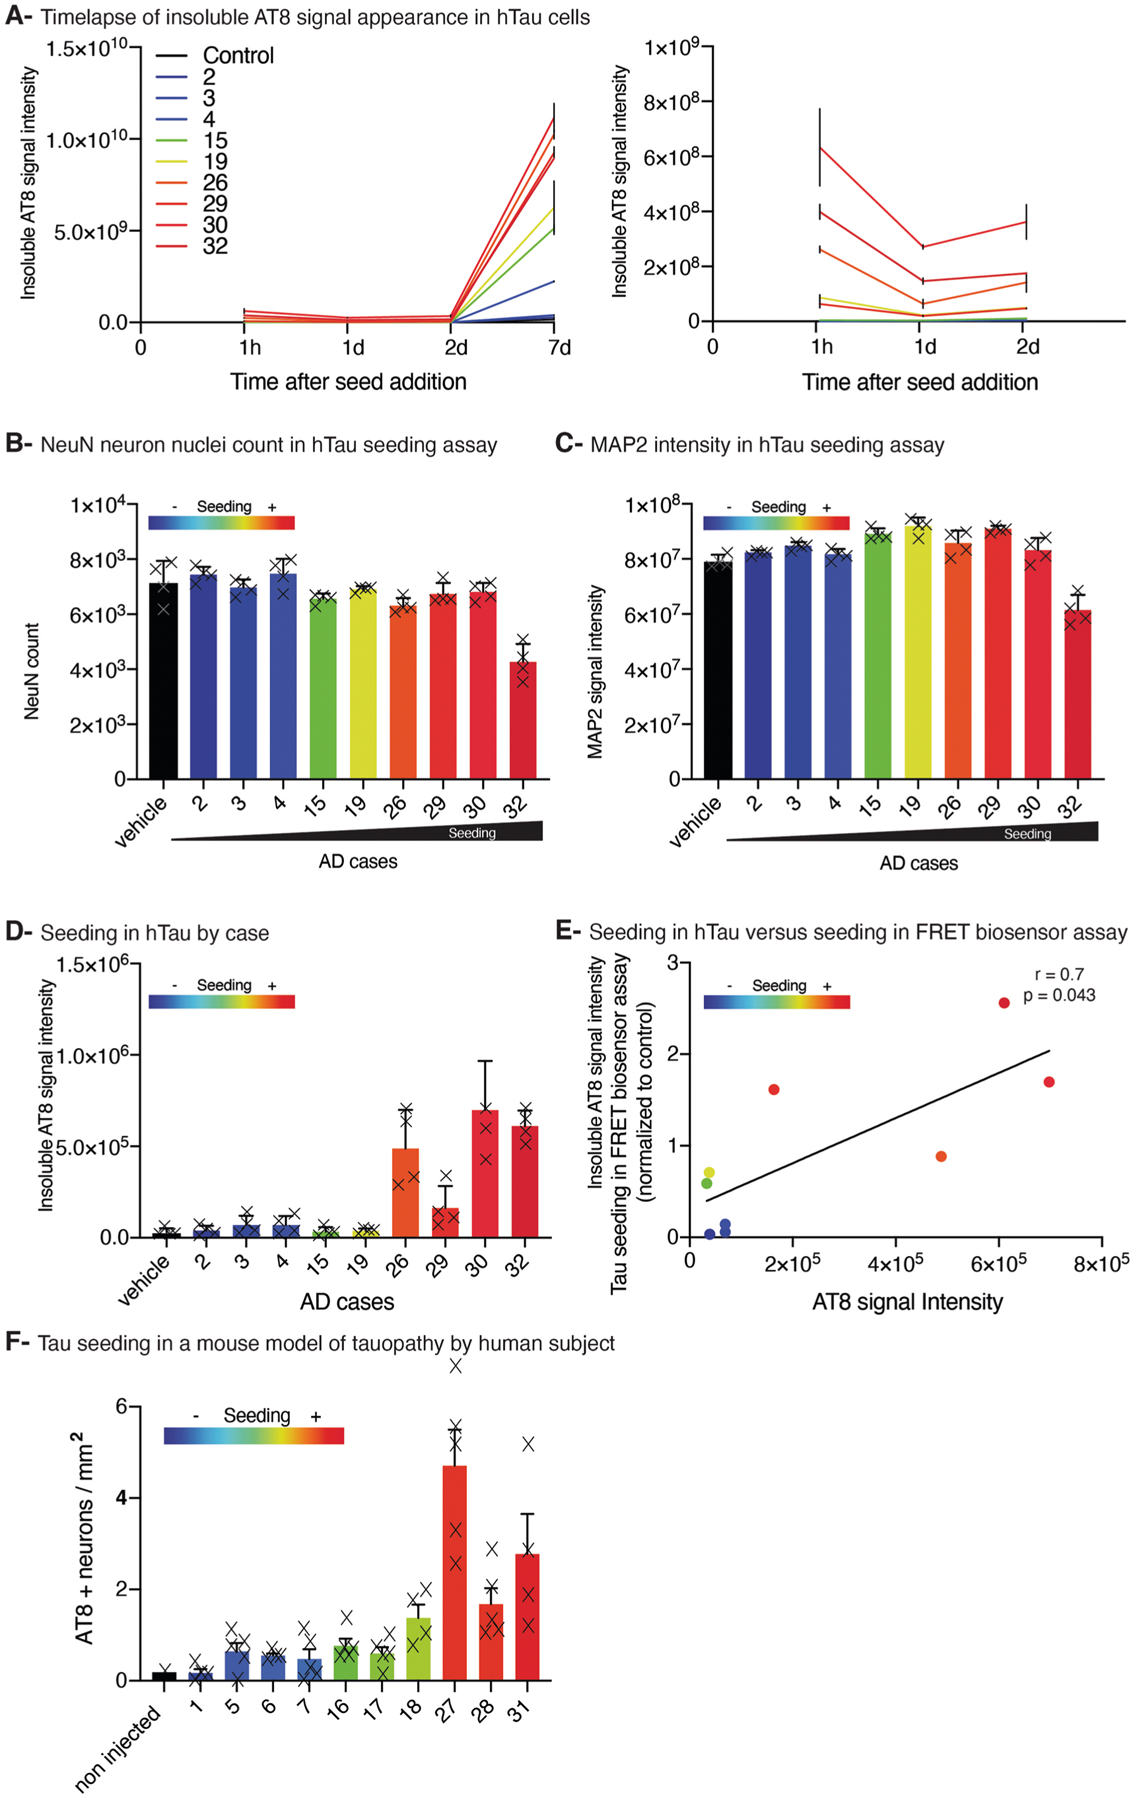
Alzheimer's disease (AD) causes unrelenting, progressive cognitive impairments, but its course is heterogeneous, with a broad range of rates of cognitive decline1. The spread of tau aggregates (neurofibrillary tangles) across the cerebral cortex parallels symptom severity2,3. We hypothesized that the kinetics of tau spread may vary if the properties of the propagating tau proteins vary across individuals. We carried out biochemical, biophysical, MS and both cell- and animal-based-bioactivity assays to characterize tau in 32 patients with AD. We found striking patient-to-patient heterogeneity in the hyperphosphorylated species of soluble, oligomeric, seed-competent tau. Tau seeding activity correlates with the aggressiveness of the clinical disease, and some post-translational modification (PTM) sites appear to be associated with both enhanced seeding activity and worse clinical outcomes, whereas others are not. These data suggest that different individuals with 'typical' AD may have distinct biochemical features of tau. These data are consistent with the possibility that individuals with AD, much like people with cancer, may have multiple molecular drivers of an otherwise common phenotype, and emphasize the potential for personalized therapeutic approaches for slowing clinical progression of AD.


Conflict of interest statement

Competing interests

This work was supported in part by a research agreement to Massachusetts General Hospital from Merck & Co. D.J.-G, R.C., R.M., K.A., F.E., and M.E.K. are/were full time employees of Merck & Co. Inc. during the course of the work.

Figures

Extended Data Fig. 1 |
Extended Data Fig. 1 |. Kinetics of tau seeding in FRET biosensor assay relates to Fig. 2d.
a, Tau seeding was quantified by live imaging over 72 h of FRET biosensor cells exposed to PBS extracts of the 32 human AD brains. This process is divided into three phases: a nucleation/lag phase followed by the exponential polymerization/elongation phase and ending by a plateau phase. Samples were normalized to total tau levels before being added to the seeding assay and the number of aggregates obtained was normalized to both positive and negative controls. A sigmoidal, 4PL, X is log(concentration) nonlinear regression was applied before plotting the data b, Tau seeding dose response was investigated in two of these AD brain extracts. Tau seeding was quantified with 8 ng of total tau in the sample (dose used for Fig. 2d and in panel A) but also with 0.08 ng, 0.8 ng, 4 ng, 16 ng and 40 ng to demonstrate the dose dependence of the plateau phase and the ceiling effect of the assay. c, Statistically significant two-tailed Spearman’s rank nonparametric correlation between the plateau value for each of the 32 AD brain extracts measured in this manner and the seeding value obtained on the FRET biosensor assay by flow cytometry (Fig. 2b). d, Statistically significant two-tailed Spearman’s rank nonparametric correlation between the values of the plateau and of the slope for the 32 AD brains.
Extended Data Fig. 2 |
Extended Data Fig. 2 |. hTau seeding assay cell viability and association with FRET biosensor assay.
a, Timecourse of insoluble AT8 aggregates appearance in the hTau primary neuron seeding assay 1 hour, 1 day, 2 days and 7 days post incubation with the AD brain extracts. The right panel only represents the time points from 1 h to 2 days post incubation with the brain extracts. Error bars represents Standard deviations to the mean. n = 10 human subjects. Quantification of immunolabelling with NeuN (b) and MAP2 (c) in hTau mouse primary neurons incubated with 9 different AD brain extracts from our study’s cohort show a general viability of neuronal cells after brain extract incubation beside a possible toxicity with subject #32 brain extract. n = 4 independent experiments, error bars represent standard deviations to the mean d, Quantification of AT8 hyperphosphorylated tau staining on 9 human subjects from Fig. 2g. n = 4 independent experiments. Error bars represents Standard deviations to the mean. The color gradient scale bar relates to seeding quantities obtained in Fig. 2b. e, Statistically significant two-tailed Spearman’s rank nonparametric correlation between the value of seeding activity obtained in Fig. 2b and the AT8 signal intensity obtained with the hTau primary neuron seeding assay for 9 subjects AD brain extracts. f, Tau seeding in a mouse model of tauopathy- Relates to Fig. 2h,i. Two-month-old P301S transgenic mice were stereotactically injected with human AD brain PBS extracts from 10 human AD subject. Mice were euthanized 2 months later, and their brains processed for AT8 immunohistochemistry to assess the in vivo seeding potential of human AD brain extracts. n = 5 animals per human subject. Bar graph depicts the stereological quantification of the number of AT8-positive neurons in the cortex and hippocampus. The color gradient scale bar relates to seeding quantities obtained in Fig. 2b. Error bars represents Standard deviations to the mean.
Extended Data Fig. 3 |
Extended Data Fig. 3 |. Hyperphosphorylation is closely associated with tau seeding.
Brain extracts from the 32 AD subject were quantified for two epitopes of tau using alphaLISA (AT8 (a) and PHF6 (b)). Prior to this assay, samples were normalized for total protein amount as obtained using a BCA assay. Background Corrected Relative Light Unit (RLU) are plotted here. The color gradient scale bar relates to seeding quantities obtained in Fig. 2b. Both phospho-epitopes show a positive statistically significant association with tau seeding using a two-tailed Spearman’s rank non parametric correlation. SEC fractions from 9 AD brain extracts grouped into high seeders (red, n = 3), moderate seeders (green, n = 3) and low seeders (blue, n = 3) were tested for the presence of epitopes of tau hyperphosphorylation by alphaLISA (AT8 (d) and PHF6 (c)). Error bars represent the standard deviation to the mean. Showing the enriched presence of these epitopes in HMW fractions, especially in high and moderate seeders. e, HMW tau species quantified from the SDD-AGE (bin1–6, see Fig. 3b) were correlated with oligomeric tau levels from the alphaLISA showing a significant two-tailed Spearman’s rank nonparametric correlation. The r coefficient and p value are indicated on the plot. n = 14 individual subjects.
Extended Data Fig. 4 |
Extended Data Fig. 4 |. Proteinase K digestion Western blots.
Relates to Fig. 3f–i. 12 AD brain extracts from our study’s cohort were incubated with increasing doses of proteinase K and run on a Western blot in order to investigate differential stabilities of tau species. Antibodies recognizing total tau proteins as well as hyperphosphorylated tau proteins were used as detection antibodies. This experiment was repeated two times with similar results.
Extended Data Fig. 5 |
Extended Data Fig. 5 |. Correlation of postmortem interval and longevity versus intensities of phosphorylation.
Intensity of phosphorylation of phospho-sites T181, S198/S199/S202, T217, T231, T231&S235, S262, S400/T403/S404 (ordinate) were correlated with postmortem interval (a) or age at death (b) (abscissa). n = 31 individual subjects. Two-tailed Spearman’s rank nonparametric correlation tests were used, and r coefficient and p values are indicated on the tables. c, Some phospho-epitopes do not correlate with seeding- Intensity of phosphorylation of phospho-sites T181, T217 and T231 (ordinate) were correlated with tau seeding activity (abscissa). n = 31 individual subjects. Two-tailed Spearman’s rank nonparametric correlation test was used, and r coefficient and p value are indicated on the plots.
Extended Data Fig. 6 |
Extended Data Fig. 6 |. Tau seeding activity correlates with tau and GFAP-immunoreactive burdens.
Immunohistochemical staining of tau (indicative of NFTs, neuropil threads and plaque-associated neuritic dystrophies) a, Amyloid-β (indicative of Aβ plaques) c, GFAP + reactive astrocytes e, and CD68 + phagocytic microglia g, formalin-fixed paraffin-embedded sections from the frontal association cortex (BA8/9) of the 32 AD subjects and their respective burden quantifications (b,d,f,h). The color gradient scale bar relates to seeding activities obtained in Fig. 2b. Both the tau burden and the GFAP burden show a statistically significant positive association with tau seeding using a two-tailed Spearman’s rank nonparametric correlation. i, Cortical thickness measured as a proxy for neurodenegeration in the same sections did not significantly correlated with tau seeding activity using a two-tailed Spearman’s rank nonparametric correlation. n = 32 individual human subjects.
Extended Data Fig. 7 |
Extended Data Fig. 7 |. Age of disease onset correlates with tau seeding activity but not with intensity of tau phosphorylation.
a, Tau seeding (on the abscissa) as quantified in Fig. 2b negatively correlates with age of onset. n = 32 individual subjects. b, Intensities of phosphorylation of different phospho-sites (ordinate) were positively or negatively correlated with age of onset (abscissa). n = 31 individual subjects. Two-sided Spearman’s rank nonparametric correlation test was used and r coefficient and p value are indicated on the plots.
Extended Data Fig. 8 |
Extended Data Fig. 8 |. Some phospho-epitopes do not correlate with rate of disease clinical progression.
Intensities of phosphorylation of phospho-sites T181, T217 and T231 (ordinate) were correlated with rate of clinical disease progression as indicated by the slope of the linearized CDR-SOB score trajectories (abscissa). Two-sided Spearman’s rank nonparametric correlation test was used and r coefficient and p value are indicated on the plots. n = 31 individual human subjects.
Extended Data Fig. 9 |
Extended Data Fig. 9 |. Rate of clinical disease progression and age of symptom onset correlate with tau burden, oligomeric tau and phosphorylated tau levels.
The relationship between age of onset and rate of progression undoubtedly has many contributors, hence it is not surprising that some relationships are not evident statistically in a relatively small sample that was not selected to examine this question. As expected and previously established,,,, Rate of disease clinical progression as indicated by the slope of the linearized CDR-SOB score trajectories and age of symptom onset as quantified in Fig. 1b, c significantly correlates with tau burden from Supplementary Fig. 8a,b (respectively a, and b) but also oligomeric tau levels from Fig. 3a (respectively c, and d, p = 0.057) and 2 epitopes of tau hyperphosphorylation: PHF6, from Supplementary Fig. 4b (respectively e, and f, p = 0.051) and AT8 from Supplementary Fig. 4a (respectively g, and h) in the 32 subjects of this study’s cohort. i, As recently described and probably not independent of the age of onset, tau seeding correlates with age at death. Correlations were carried out using a two-sided Spearman’s rank nonparametric correlation, r coefficient and p values are indicated on the plots. n = 32 individual human subjects. j, Analysis of tau seeding activity by APOE genotype showed a statistically significant difference with higher seeding activity in APOEε4/ε4 subjects (n = 5) compared to APOEε3/ε4 (n = 20, p = 0.0013) and APOEε4 non-carriers (n = 8, p = 0.0072). Groups were compared using a one-way ANOVA with a Tukey’s multiple comparison post-test. Error bars represent standard deviation to the mean.
Extended Data Fig. 10 |
Extended Data Fig. 10 |. Reduction of tau seeding by antibodies is epitope and subject-to-subject dependent.
a, Schematic representation of the paradigm of tau seeding reduction via immunodepletion. Antibodies were coupled with magnetic beads and incubated with AD brain extract. Beads/antibodies/antigens complexes were depleted and the supernatant placed on the FRET biosensor seeding assay. FRET was quantified by flow cytometry. b, Schematic representation of tau protein with alternative exons 2 (yellow), 3 (green) and 10 (red) as well as the repeated regions of the microtubule binding domains (black). Antibodies used in this study are indicated below. Green antibodies (Tau12, HT7 and Tau46) target the total protein when red antibodies (AT270, AT8, pS262 and PHF1) target phospho-epitopes known to be associated with AD tau pathology. c, Antibody-mediated reduction of tau seeding across 15 AD subjects from our study’s cohort (left column). Antibodies are organized in columns. IgG serve as negative control for seeding reduction. Percentage of seeding reduction and standard deviation are indicated for each individual/antibody association. The color code of seeding reduction is indicated in the lower panel.
Fig. 1 |
Fig. 1 |. Heterogeneity of clinical progression and age of onset in Alzheimer’s disease.
a, Dementia progression in this study’s participants. Each line corresponds to an individual participant, and each point to an individual visit at the memory clinic. Participants were evaluated for their CDR-SOB scores at each visit. CDR-SOB = 0 is a cognitively normal individual; CDR-SOB = 18 is the maximum of this scale and corresponds to an individual with very advanced dementia. b, Linear estimate of the rate of clinical progression, extrapolated longitudinally from the data in a, from onset to CDR-SOB = 18 or from onset to last visit if CDR-SOB = 18 was not reached. c, Distribution of the ages of disease onset across the 32 participants in this study.
Fig. 2 |
Fig. 2 |. Heterogeneity of tau seeding in the human brain.
a, Schematic of the FRET-biosensor seeding assay. HEK293 cells were stably expressing the tau repeat domain fused with a cyan fluorescent protein or a yellow fluorescent protein. When seeds from human brain extract are added, these constructs aggregate and allow for the generation of a FRET signal that is detectable and quantifiable by flow cytometry and imaging. b, Seeding in 34 human participants (32 participants from Fig. 1, as well as a positive and a negative control) was quantified using flow cytometry in the seeding assay described in a. Samples were normalized to total tau levels before being added to the seeding assay, and the integrated FRET densities obtained were normalized to both positive and negative controls. The positive control is a human AD Braak VI brain that has been characterized in previous studies (Takeda et al.). The negative control is a human control brain without tau pathology. Error bars represent s.d. of the mean; n = 4 independent experiments. c, Images from the FRET-biosensor assay for tau seeding over time. White arrowheads show the aggregates forming inside cells. This experiment was repeated two times for each participant, with similar results. Scale bar, 100 μm. d, Tau seeding was quantified by live imaging over 72 h in a subset of 9 human study participants. Data for all 32 participants are available in Extended Data Fig. 1. Samples were normalized to total tau levels before being added to the seeding assay, and the number of seeds obtained was normalized to both positive and negative controls. A sigmoidal, four-parameter logistic (4PL) nonlinear regression in which x is log (concentration) was applied before data were plotted. e, Schematic of the human Tau (hTau) seeding assay in mice. hTau-expressing mice primary neurons were plated and incubated with human brain extract for 3 h, and then were further incubated for 11 d before a fixing and permeabilization step in which soluble tau species were washed and hyperphosphorylated tau was stained for, evidencing intracellular insoluble aggregates. f, Representative images of the hTau seeding assay after neurons were stained with NeuN (blue), MAP2 (red) and AT8 antibody against hyperphosphorylated tau (green), showing insoluble aggregates of tau (white arrowheads) when AD brain extract is incubated with neurons. This experiment was repeated six times with similar results. g, Quantification of hyperphosphorylated tau staining with the AT8 antibody in nine human participants in this study. These individuals were separated into groups of high (red, n = 4), moderate (green, n = 2) and low (blue, n = 3) seeders on the basis of the value obtained in Fig. 2b. A representation of data by participant, as well as a time course of aggregate appearance and NeuN and MAP2 burdens, is available in Extended Data Fig. 2. Error bars represent s.d. of the mean. h, Representative images of the presence of AT8-positive immunostaining 2 months after injection of brain extract from 3 patients—a low seeder (upper panels), a moderate seeder (middle panels) and a high seeder (lower panels)—in 4-month-old P301S mice; stars represent the injection sites. Middle and right panels show two different magnifications. Five mice were injected with each human AD extract. i, Two-month-old P301S transgenic mice were stereotactically injected with human AD brain PBS extracts from three high seeders (red), three moderate seeders (green) and three low seeders (blue), determined on the basis of the tau seeding activities obtained in Fig. 2b. Five mice were injected with each human AD extract, for a total of 15 mice in each group. Five mice were injected with human control brain extracts as negative control. Mice were euthanized 2 months later, and their brains were processed for AT8 immunohistochemistry to assess the in vivo seeding potential of human AD brain extracts. The bar graph depicts the stereological quantification of the number of AT8+ neurons in the cortex and hippocampus. A representation by patient is available in Extended Data Fig. 2f. One-way analysis of variance (ANOVA) (P < 0.0001) with a Tukey’s multiple-comparison post hoc test revealed a significantly higher number of NFTs after injection with brain extracts from high seeders compared with those from moderate (P < 0.0001) and low (P < 0.0001) seeders. Error bars represent s.d. of the mean.
Fig. 3 |
Fig. 3 |. Tau seeding relies on an oligomeric form of tau.
a, In brain extracts from study participants, total tau (BT2-HT7 antibodies) and oligomeric tau (HT7-HT7 antibodies) were quantified using AlphaLISA. Prior to this assay, samples were normalized for total protein amount as determined using a bicinchoninic acid (BCA) assay. Absolute amounts of total tau are plotted against relative light units for oligomeric tau. The color-gradient scale bar indicates the seeding quantities determined in Fig. 2b. Both total tau and oligomeric tau show, respectively, a negative and positive statistically significant association with tau seeding, determined using a two-tailed Spearman’s rank non-parametric correlation. Bars represent the average of two independent experimental replicates. AlphaLISA data on tau hyperphosphorylation are available in Extended Data Fig. 3a,b. b, Fourteen participants in our study were selected from across the seeding spectrum, and brain extracts were run on a semi-denaturing detergent agarose gel electrophoresis to separate the HMW tau species (that is, tau oligomers and aggregates) and the LMW tau species (that is, tau monomers and proteolysis products) and revealed by a total tau antibody (Dako). These study participants were separated into groups of high (red, n = 5), moderate (green, n = 4) and low (blue, n = 5) seeders on the basis of the value obtained in Fig. 2b. Densitometry data for tau signals were quantified and plotted in the right panel, which shows a difference in the quantity of HMW tau species in the high seeders versus in the moderate and low seeders. Error bars represent s.d. of the mean. See Extended Data Fig. 3e for the association between the quantities of HMW tau from SDD-AGE and of oligomeric tau from AlphaLISA c, Schematic of the SEC technique. Human brain extracts were applied to a gel-filtration column, and fractions were retrieved with separation of HMW and LMW tau species. d, Upper panel, Tau seeding was quantified in SEC fractions of nine study participants using the assay described in Fig. 1a. Participants were grouped into high (red, n = 3), moderate (green, n = 3) and low (blue, n = 3) seeders on the basis of seeding quantities obtained in Fig. 2b. Tau seeding seems to be present mostly in HMW fractions, and not in LMW fractions. Error bars represent s.d. of the mean. Lower panel, Distribution of tau seeding across fractions for the three groups, indicating that there is widespread tau seeding in high seeders compared with that in moderate and low seeders. Boxes represent the 25th and 75th percentile, and the median is indicated by the midline; whiskers represent the 5th and 95th percentiles. e, Total and oligomeric tau levels were quantified in SEC fractions from nine study participants by AlphaLISA, showing the abundance of LMW tau species and the rarity of HMW tau. However, high seeders have more HMW oligomeric tau than do moderate and low seeders. Error bars represent s.d. of the mean. AlphaLISA data on tau hyperphosphorylation are available in Extended Data Fig. 3c,d. RLU, relative light unit. fh, Twelve participants’ brain extracts were incubated with increasing doses of proteinase K (PK) and were run on a western blot to find evidence for the differential stabilities of tau species. An antibody recognizing total tau protein was used as the detection antibody. Full blots are available in Extended Data Fig. 4. i, Degradation products from the condition with 2.5 μg ml−1 PK were quantified and compared using a one-way ANOVA with a Tukey’s multiple-comparison post hoc test. There was a significant association between high seeders (red, n = 4) and a higher amount of degradation products compared with moderate (green, n = 4) and in low (blue, n = 4) seeders. Error bars represent s.d. of the mean.
Fig. 4 |
Fig. 4 |. Tau seeding is associated with rate of disease progression and intensity of tau phosphorylation.
a, Brain extracts from the 32 study participants (rows) were sedimented by ultracentrifugation to precipitate seeding-active tau species. Pellets were digested in trypsin and analyzed on a Q Exactive Mass Spectrometer. Peptides modified by phosphorylation were identified and quantified, and data were normalized to the summed intensity of three unmodified tau peptides (columns). Color scales from the lowest value (light green) to the highest value (dark green) for each peptide. One sample (participant no. 9) was excluded owing to poor data quality. b, Intensities of phosphorylation for different phosphorylation sites were correlated to tau seeding. n = 31 individual human participants. Correlations were performed using a two-tailed Spearman’s rank non-parametric test, and P and r values are indicated on each plot. c, Tau seeding, as quantified in Fig. 2b, positively correlates with rate of disease progression, as quantified in Fig. 1b. n = 32 individual human participants. IFD, integrated FRET density. The correlation was performed using a two-tailed Spearman’s rank non-parametric test, and P and r values are indicated on the plot. d, Intensity of phosphorylation at different phosphoepitopes were also correlated with rate of disease progression, showing significant associations. n = 31 individual human participants. A two-tailed Spearman’s rank non-parametric correlation test was used, and r and P values are indicated on the plots. See Extended Data Figs. 5, 7, 8 and 9 for additional analysis regarding intensities of phosphorylation, rates of progressions and ages of onset.

References

    1. Komarova NL & Thalhauser CJ High degree of heterogeneity in Alzheimer’s disease progression patterns. PLoS Comput. Biol 7, e1002251 (2011). - PMC - PubMed
    1. Giannakopoulos P et al. Tangle and neuron numbers, but not amyloid load, predict cognitive status in Alzheimer’s disease. Neurology 60, 1495–1500 (2003). - PubMed
    1. Arriagada PV, Growdon JH, Hedley-Whyte ET & Hyman BT Neurofibrillary tangles but not senile plaques parallel duration and severity of Alzheimer’s disease. Neurology 42, 631–639 (1992). - PubMed
    1. Arakhamia T et al. Posttranslational modifications mediate the structural diversity of tauopathy strains. Cell 180, 633–644 e612 (2020). - PMC - PubMed
    1. Falcon B et al. Novel tau filament fold in chronic traumatic encephalopathy encloses hydrophobic molecules. Nature 568, 420–423 (2019). - PMC - PubMed

Publication types

MeSH terms