

Longitudinal neuroimaging biomarkers differ across Alzheimer's disease phenotypes
- PMID: 32572464
- PMCID: PMC7363492
- DOI: 10.1093/brain/awaa155
Longitudinal neuroimaging biomarkers differ across Alzheimer's disease phenotypes
Abstract
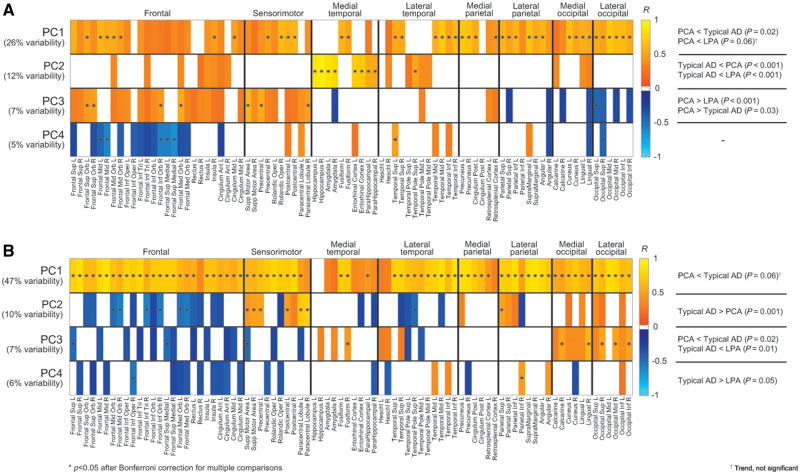
Alzheimer's disease can present clinically with either the typical amnestic phenotype or with atypical phenotypes, such as logopenic progressive aphasia and posterior cortical atrophy. We have recently described longitudinal patterns of flortaucipir PET uptake and grey matter atrophy in the atypical phenotypes, demonstrating a longitudinal regional disconnect between flortaucipir accumulation and brain atrophy. However, it is unclear how these longitudinal patterns differ from typical Alzheimer's disease, to what degree flortaucipir and atrophy mirror clinical phenotype in Alzheimer's disease, and whether optimal longitudinal neuroimaging biomarkers would also differ across phenotypes. We aimed to address these unknowns using a cohort of 57 participants diagnosed with Alzheimer's disease (18 with typical amnestic Alzheimer's disease, 17 with posterior cortical atrophy and 22 with logopenic progressive aphasia) that had undergone baseline and 1-year follow-up MRI and flortaucipir PET. Typical Alzheimer's disease participants were selected to be over 65 years old at baseline scan, while no age criterion was used for atypical Alzheimer's disease participants. Region and voxel-level rates of tau accumulation and atrophy were assessed relative to 49 cognitively unimpaired individuals and among phenotypes. Principal component analysis was implemented to describe variability in baseline tau uptake and rates of accumulation and baseline grey matter volumes and rates of atrophy across phenotypes. The capability of the principal components to discriminate between phenotypes was assessed with logistic regression. The topography of longitudinal tau accumulation and atrophy differed across phenotypes, with key regions of tau accumulation in the frontal and temporal lobes for all phenotypes and key regions of atrophy in the occipitotemporal regions for posterior cortical atrophy, left temporal lobe for logopenic progressive aphasia and medial and lateral temporal lobe for typical Alzheimer's disease. Principal component analysis identified patterns of variation in baseline and longitudinal measures of tau uptake and volume that were significantly different across phenotypes. Baseline tau uptake mapped better onto clinical phenotype than longitudinal tau and MRI measures. Our study suggests that optimal longitudinal neuroimaging biomarkers for future clinical treatment trials in Alzheimer's disease are different for MRI and tau-PET and may differ across phenotypes, particularly for MRI. Baseline tau tracer retention showed the highest fidelity to clinical phenotype, supporting the important causal role of tau as a driver of clinical dysfunction in Alzheimer's disease.
Keywords: Alzheimer’s disease phenotypes; atrophy; longitudinal tau-PET; neuroimaging biomarkers.
© The Author(s) (2020). Published by Oxford University Press on behalf of the Guarantors of Brain. All rights reserved. For permissions, please email: journals.permissions@oup.com.
Figures


References
-
- Ashburner J, Friston KJ.. Unified segmentation. Neuroimage 2005; 26: 839–51. - PubMed
-
- Braak H, Braak E.. Neuropathological stageing of Alzheimer-related changes. Acta Neuropathol 1991; 82: 239–59. - PubMed
-
- Chiotis K, Saint-Aubert L, Rodriguez-Vieitez E, Leuzy A, Almkvist O, Savitcheva I, et al. Longitudinal changes of tau PET imaging in relation to hypometabolism in prodromal and Alzheimer’s disease dementia. Molecular Psychiatry 2018; 23: 1666–73. - PubMed
Publication types
MeSH terms
Substances
Grants and funding
LinkOut - more resources
Full Text Sources
Medical
