. 2020 Jul 1;143(7):2089-2105.
doi: 10.1093/brain/awaa162.

Multiple sclerosis lesions in motor tracts from brain to cervical cord: spatial distribution and correlation with disability

Affiliations

Multiple sclerosis lesions in motor tracts from brain to cervical cord: spatial distribution and correlation with disability

Anne Kerbrat et al. Brain. .

Abstract

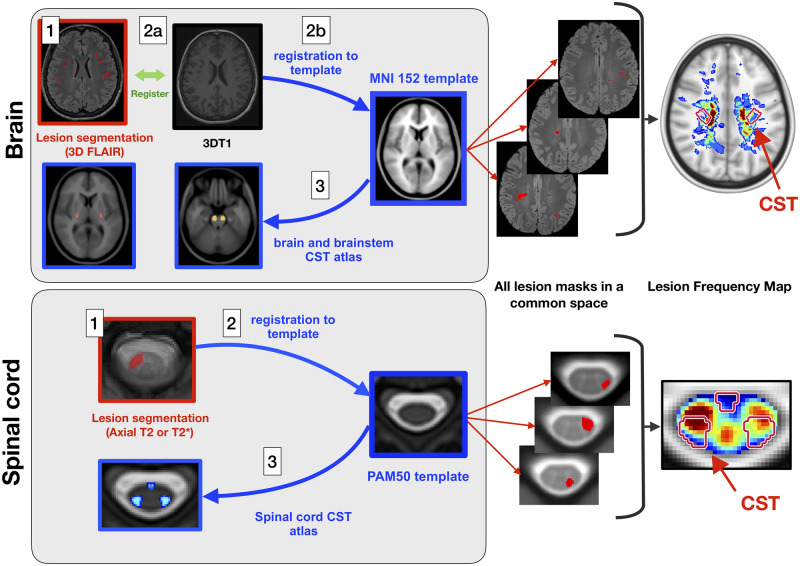
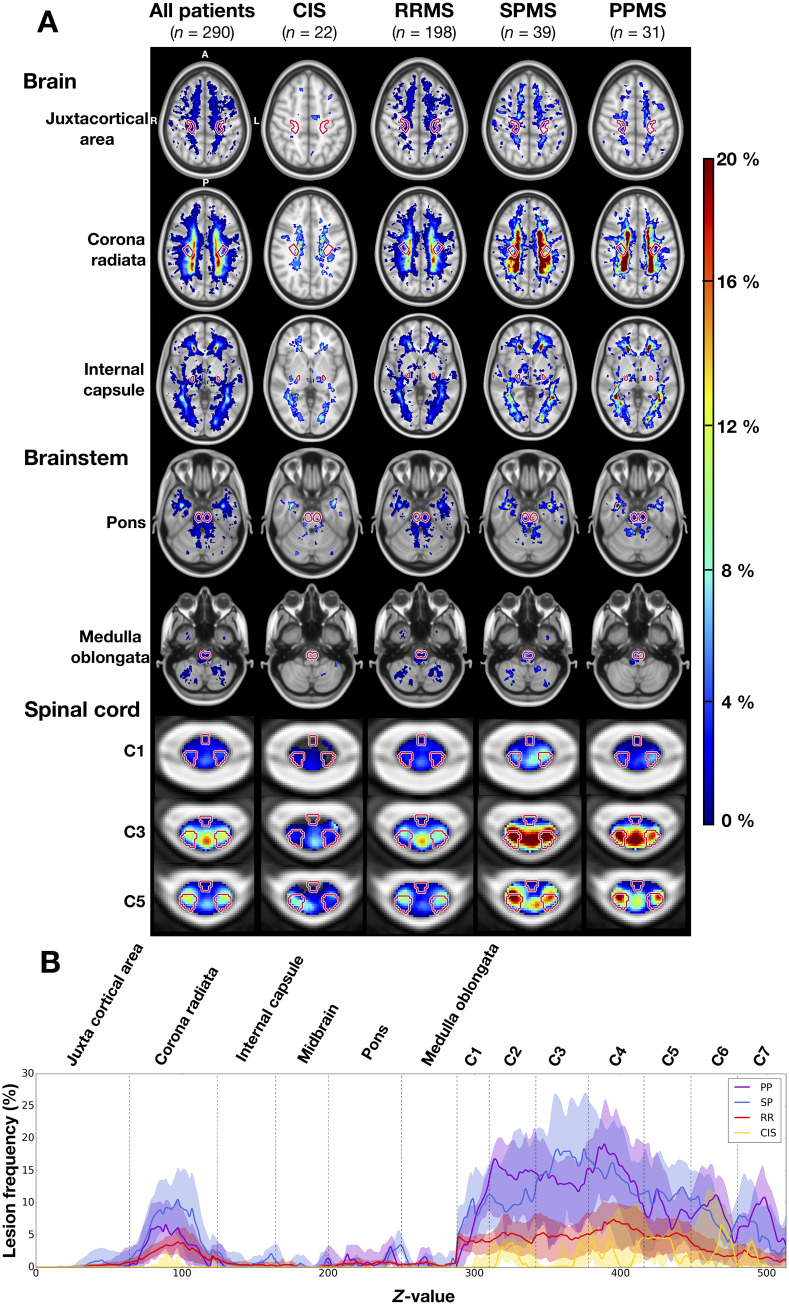
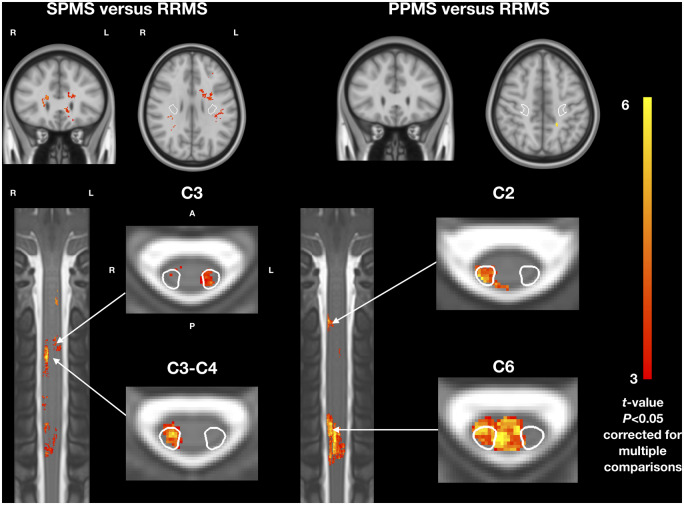
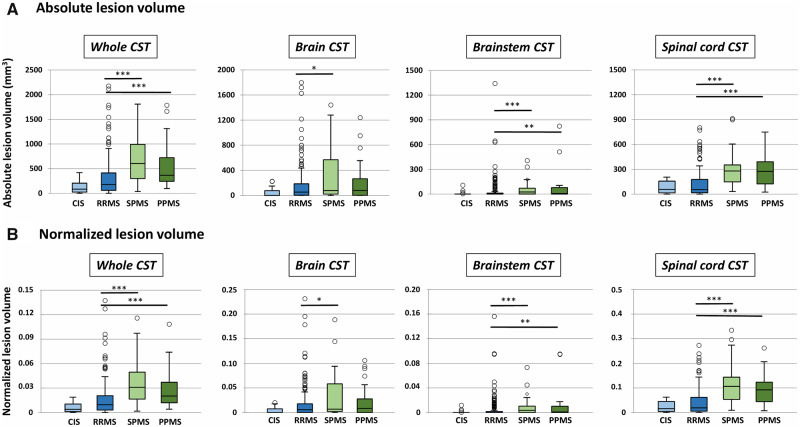
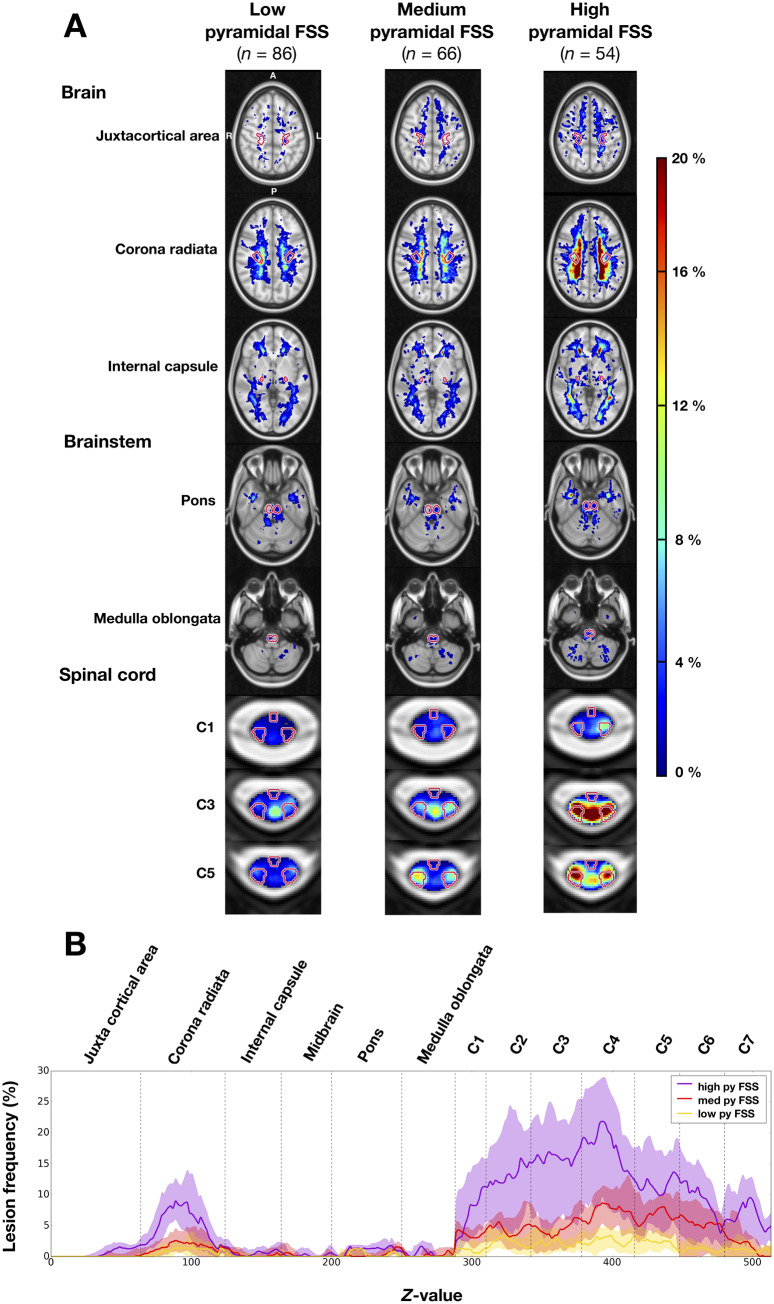
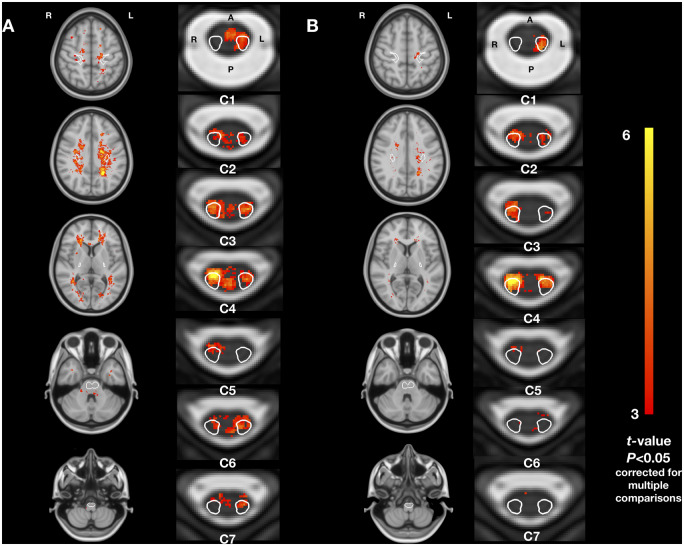
Despite important efforts to solve the clinico-radiological paradox, correlation between lesion load and physical disability in patients with multiple sclerosis remains modest. One hypothesis could be that lesion location in corticospinal tracts plays a key role in explaining motor impairment. In this study, we describe the distribution of lesions along the corticospinal tracts from the cortex to the cervical spinal cord in patients with various disease phenotypes and disability status. We also assess the link between lesion load and location within corticospinal tracts, and disability at baseline and 2-year follow-up. We retrospectively included 290 patients (22 clinically isolated syndrome, 198 relapsing remitting, 39 secondary progressive, 31 primary progressive multiple sclerosis) from eight sites. Lesions were segmented on both brain (T2-FLAIR or T2-weighted) and cervical (axial T2- or T2*-weighted) MRI scans. Data were processed using an automated and publicly available pipeline. Brain, brainstem and spinal cord portions of the corticospinal tracts were identified using probabilistic atlases to measure the lesion volume fraction. Lesion frequency maps were produced for each phenotype and disability scores assessed with Expanded Disability Status Scale score and pyramidal functional system score. Results show that lesions were not homogeneously distributed along the corticospinal tracts, with the highest lesion frequency in the corona radiata and between C2 and C4 vertebral levels. The lesion volume fraction in the corticospinal tracts was higher in secondary and primary progressive patients (mean = 3.6 ± 2.7% and 2.9 ± 2.4%), compared to relapsing-remitting patients (1.6 ± 2.1%, both P < 0.0001). Voxel-wise analyses confirmed that lesion frequency was higher in progressive compared to relapsing-remitting patients, with significant bilateral clusters in the spinal cord corticospinal tracts (P < 0.01). The baseline Expanded Disability Status Scale score was associated with lesion volume fraction within the brain (r = 0.31, P < 0.0001), brainstem (r = 0.45, P < 0.0001) and spinal cord (r = 0.57, P < 0.0001) corticospinal tracts. The spinal cord corticospinal tracts lesion volume fraction remained the strongest factor in the multiple linear regression model, independently from cord atrophy. Baseline spinal cord corticospinal tracts lesion volume fraction was also associated with disability progression at 2-year follow-up (P = 0.003). Our results suggest a cumulative effect of lesions within the corticospinal tracts along the brain, brainstem and spinal cord portions to explain physical disability in multiple sclerosis patients, with a predominant impact of intramedullary lesions.

Keywords: MRI; corticospinal tract; disability; multiple sclerosis.


Figures

Figure 1
Figure 1
Processing pipeline. Brain data processing: (1) semi-automatic lesion segmentation on 3D T2-FLAIR or axial T2-weighted images (when 3D T2-FLAIR was not available); (2a) intra-subject linear registration between T2-FLAIR and T1-weighted images; (2b) Affine and non-linear registration between T1-weighted images and the T1 ICBM 1 mm isotropic template space; and (3) quantification of lesion volume fraction based on brain and brainstem CST atlases. Spinal cord data processing: (1) manual lesion segmentation on axial T2*-weighted images; (2) slice-wise non-linear registration to the PAM50 template; and (3) Quantification of lesion volume fraction based on a spinal cord CST atlas. To create the lesion frequency maps, brain and spinal cord lesion masks were averaged in the ICBM and PAM50 space, respectively.
Figure 2
Figure 2
Lesion frequency in the brain, brainstem and cervical spinal cord. (A) Lesion frequency maps for the whole cohort and for each disease phenotype. The CST are indicated in red contour. (B) Lesion frequency along the CST for each phenotype subcohort. For each axial slice (1-mm slice thickness), the CST lesion frequency median and interquartile range are represented by a solid line and shaded region, respectively. The CST segments are demarcated by dashed vertical lines. When interpreting this graph, it is important to keep in mind that the lesion frequencies are normalized by the CST volume.
Figure 3
Figure 3
T2 lesion frequency voxelwise comparison between phenotypes. (A) Patients with SPMS versus RRMS. (B) Patients with PPMS versus RRMS. Coronal and axial views. Only t-values of voxels from significant clusters are shown (P < 0.05, family-wise error corrected for multiple comparisons). All analyses were adjusted for sex, age, disease duration and scanning sites. A = anterior; P = posterior; L = left; R = right. The CST is indicated in white contour in axial views.
Figure 4
Figure 4
Absolute and normalized lesion volumes for each phenotype, measured in the whole CST, in the brain, brainstem and spinal cord portion of the CST. ***P < 0.0001, **P < 0.001, *P < 0.05. For clarity, only significant differences between relapsing-remitting and progressive phenotypes are reported, and not between clinically isolated syndrome and other phenotypes. For each box plot, the median is indicated as a thick horizontal line and the interquartile range as a rectangle. The horizontal bar at both extremities of the whiskers indicates the 5th and 95th percentiles. The circles indicate outliers.
Figure 5
Figure 5
Frequency of multiple sclerosis lesions in the brain, brainstem and spinal cord for patients grouped by pyramidal functional system score. (A) Lesion frequency maps. Pyramidal functional system score (FSS) subgroups: low pyramidal functional system score (0), medium pyramidal functional system score (1–2), high pyramidal functional system score (≥3). The CST is indicated in red contour. (B) Lesion frequency along the CST for each pyramidal functional system score subcohort. For each axial slice (1-mm slice thickness), the CST lesion frequency median and interquartile range are represented by a solid line and shaded region, respectively. The CST segments are demarcated by dashed vertical lines. Pyramidal functional system score (py FSS) subgroups: low pyramidal functional system score (0), medium pyramidal functional system score (1–2), high pyramidal functional system score (≥3). When interpreting this graph, it is important to note that the lesion frequencies are normalized by the CST volume.
Figure 6
Figure 6
Association between T2 lesion frequency and disability. (A) Disability scored by the EDSS. (B) Disability scored by the pyramidal functional system score. Only t-values for significant clusters are shown (P < 0.05, family-wise error corrected for multiple comparisons). All analyses were adjusted for sex, age, disease duration and scanning sites at a voxel scale. The CST is indicated in white contour in the axial views.

Similar articles

Cited by

References

    1. Agosta F, Pagani E, Caputo D, Filippi M.. Associations between cervical cord gray matter damage and disability in patients with multiple sclerosis. Arch Neurol 2007; 64: 1302–5. - PubMed
    1. Archer DB, Vaillancourt DE, Coombes SA.. A Template and Probabilistic Atlas of the Human Sensorimotor Tracts using Diffusion MRI. Cereb Cortex 2018; 28: 1685–99. - PMC - PubMed
    1. Arrambide G, Rovira A, Sastre-Garriga J, Tur C, Castilló J, Río J, et al.Spinal cord lesions: a modest contributor to diagnosis in clinically isolated syndromes but a relevant prognostic factor. Mult Scler 2018; 24: 301–12. - PubMed
    1. Avants BB, Tustison NJ, Wu J, Cook PA, Gee JC.. An open source multivariate framework for n-tissue segmentation with evaluation on public data. Neuroinform 2011; 9: 381–400. - PMC - PubMed
    1. Barkhof F. The clinico-radiological paradox in multiple sclerosis revisited. Curr Opin Neurol 2002; 15: 239–45. - PubMed

Publication types