. 2020 Jul 1;143(7):2255-2271.
doi: 10.1093/brain/awaa154.

A role of the frontotemporal lobar degeneration risk factor TMEM106B in myelination

Affiliations

A role of the frontotemporal lobar degeneration risk factor TMEM106B in myelination

Tuancheng Feng et al. Brain. .

Abstract

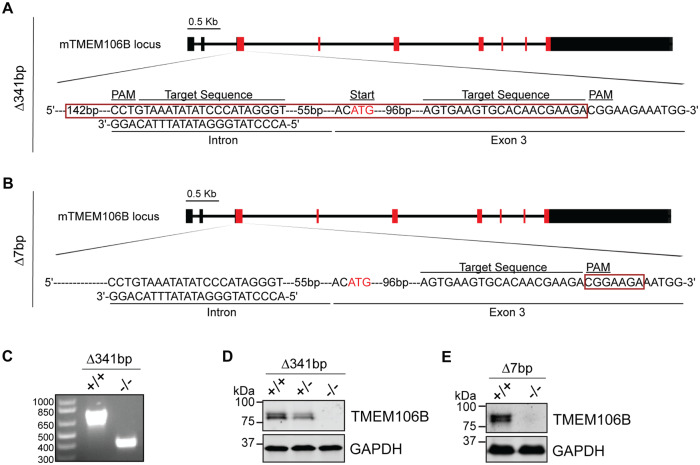
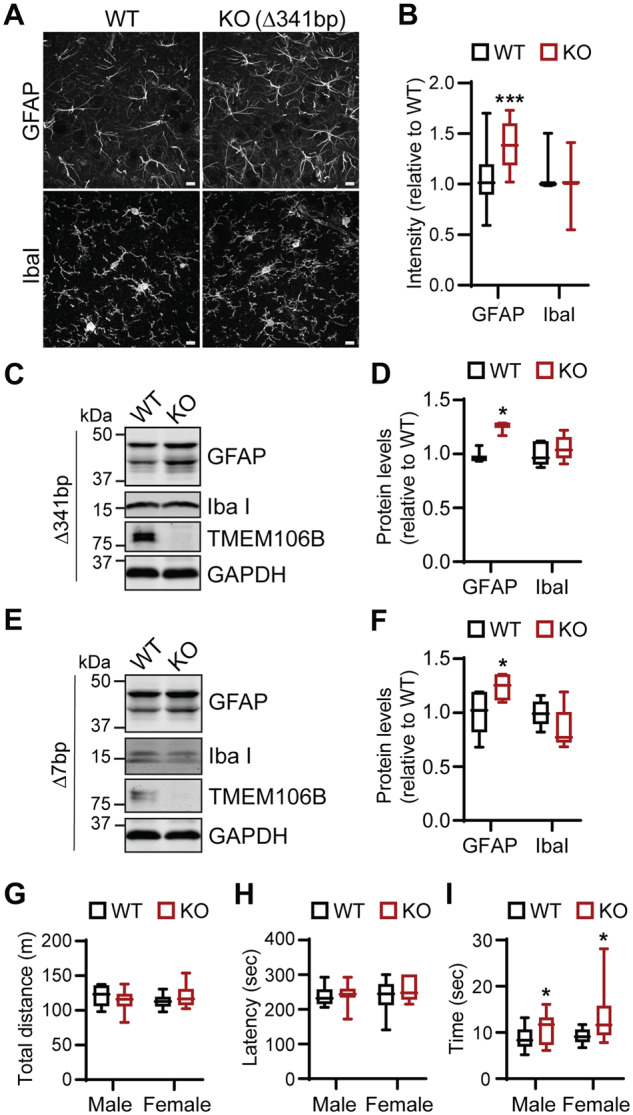
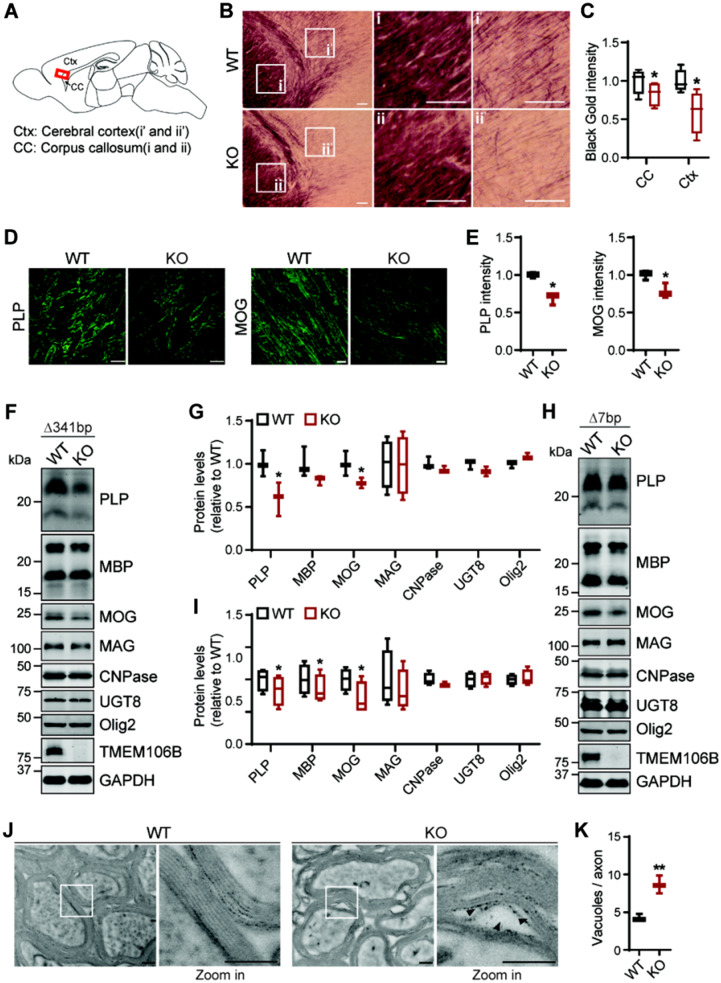
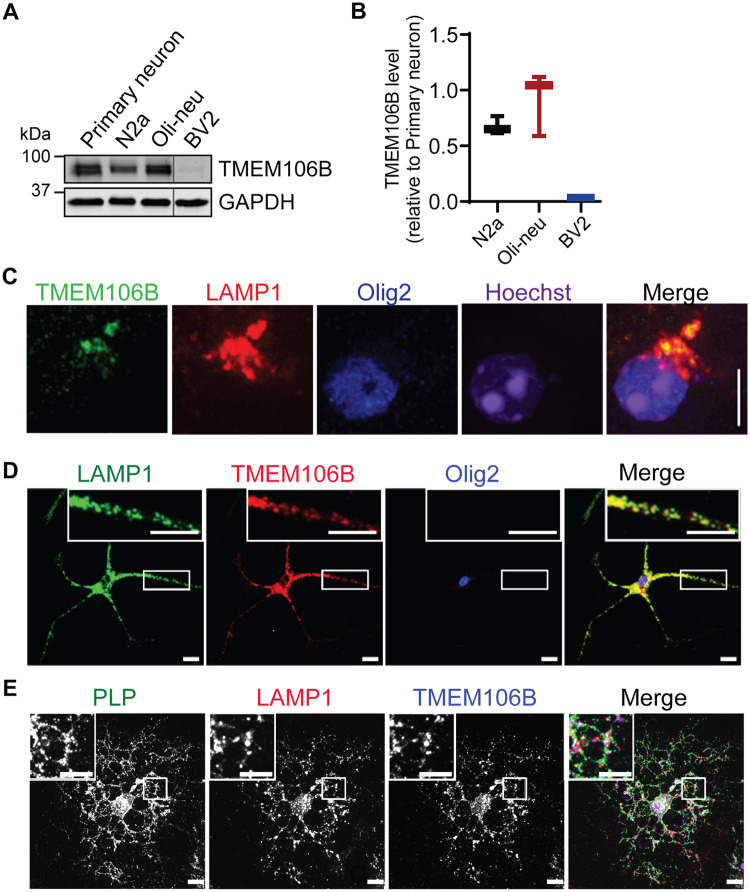
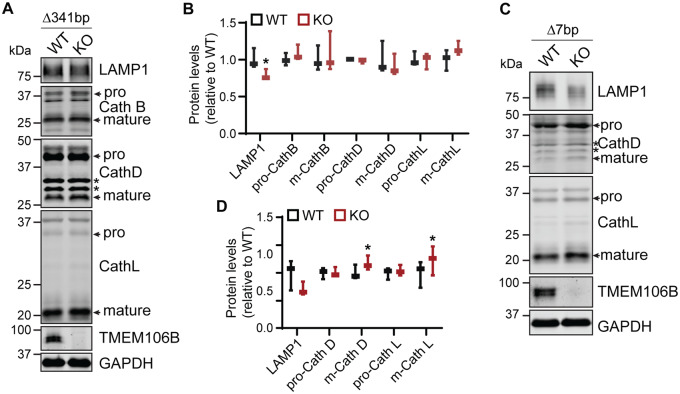
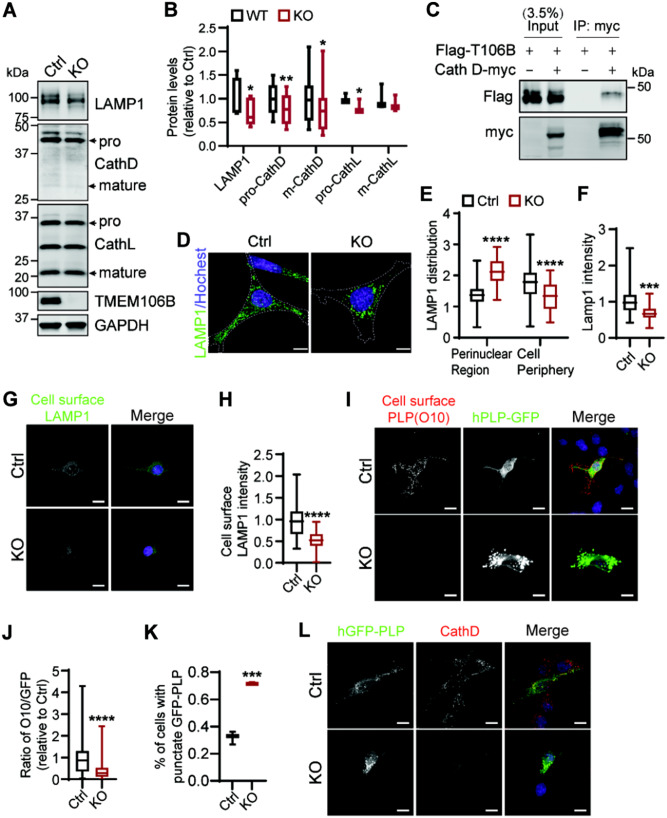
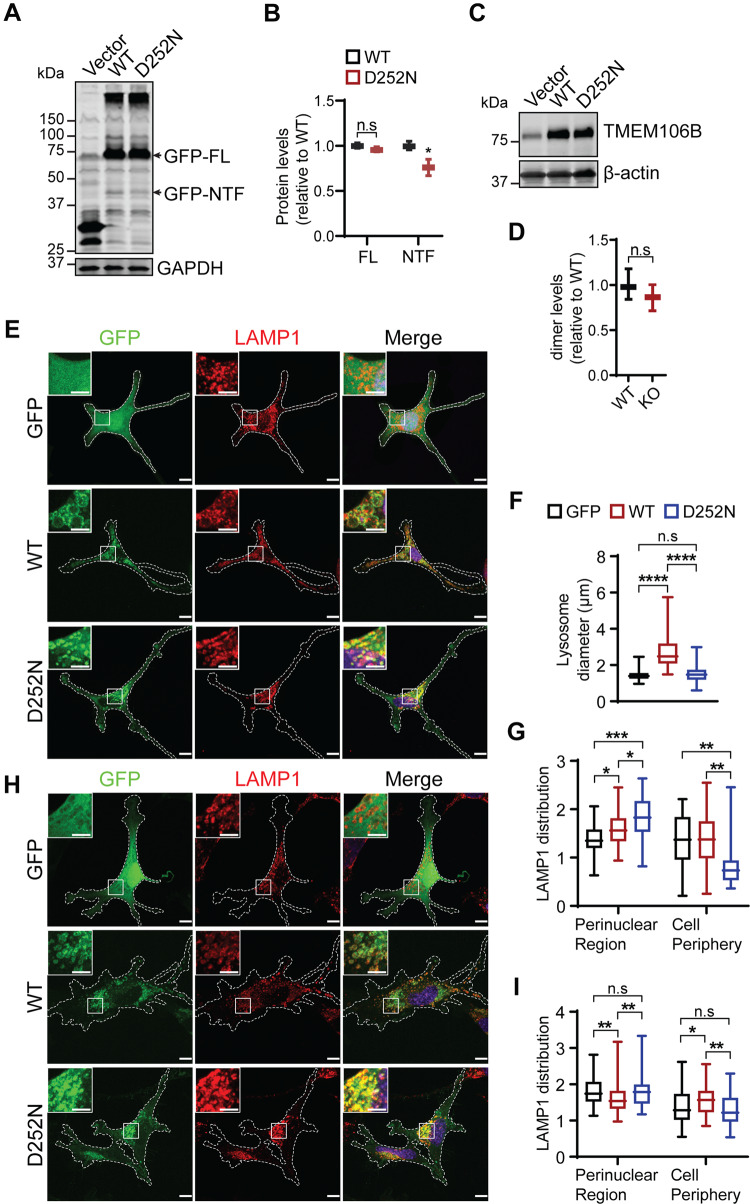
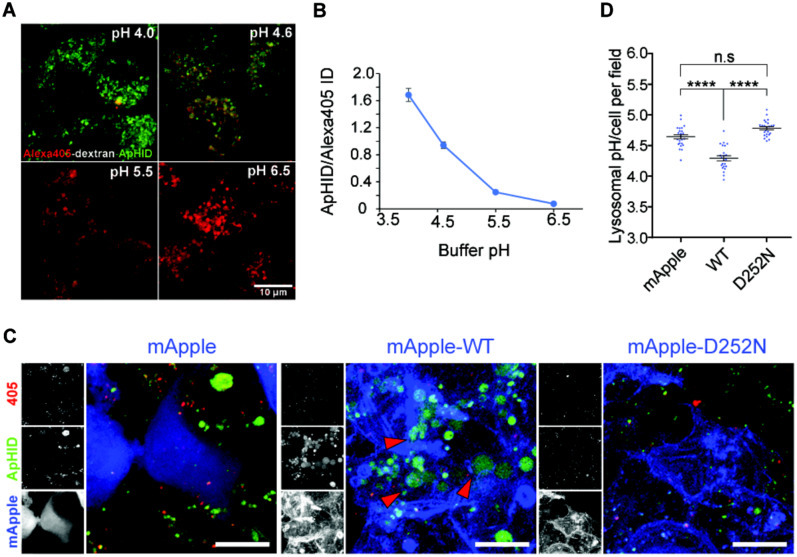
TMEM106B encodes a lysosomal membrane protein and was initially identified as a risk factor for frontotemporal lobar degeneration. Recently, a dominant D252N mutation in TMEM106B was shown to cause hypomyelinating leukodystrophy. However, how TMEM106B regulates myelination is still unclear. Here we show that TMEM106B is expressed and localized to the lysosome compartment in oligodendrocytes. TMEM106B deficiency in mice results in myelination defects with a significant reduction of protein levels of proteolipid protein (PLP) and myelin oligodendrocyte glycoprotein (MOG), the membrane proteins found in the myelin sheath. The levels of many lysosome proteins are significantly decreased in the TMEM106B-deficient Oli-neu oligodendroglial precursor cell line. TMEM106B physically interacts with the lysosomal protease cathepsin D and is required to maintain proper cathepsin D levels in oligodendrocytes. Furthermore, we found that TMEM106B deficiency results in lysosome clustering in the perinuclear region and a decrease in lysosome exocytosis and cell surface PLP levels. Moreover, we found that the D252N mutation abolished lysosome enlargement and lysosome acidification induced by wild-type TMEM106B overexpression. Instead, it stimulates lysosome clustering near the nucleus as seen in TMEM106B-deficient cells. Our results support that TMEM106B regulates myelination through modulation of lysosome function in oligodendrocytes.

Keywords: TMEM106B; lysosome; myelination; oligodendrocytes.


Figures

Figure 1
Figure 1
Generation of TMEM106B-deficient mice. (A and B) Illustration of mouse TMEM106B genomic locus and guide RNAs used to generate TMEM106B-deficient mice. Red box indicates deleted region. (CE) Ablation of TMEM106B gene product was confirmed by PCR (C) and western blot analysis using antibodies specific to TMEM106B (D and E).
Figure 2
Figure 2
Increased gliosis and mild behavioural defects in TMEM106B-deficient mice. (A and B) Increased astrocyte activation in 5-month-old Tmem106b−/− (Δ341bp) mice. Brain sections were stained with anti-GFAP or IbaI antibodies, and images were captured in hippocampus region. Scale bar = 10 µm. n = 3 (two females, one male each genotype), ***P <0.001, Student’s t-test. (CF) Western blot analysis of GFAP and Iba1 protein levels in wild-type and Tmem106b−/− frontal cortex lysates (C and D: 5 months old, Δ341bp; E and F: 10 months old, Δ7bp). n = 4 (two females, two males each genotype), *P < 0.05, paired t-test with littermate wild-type controls. (G–I) Tmem106b−/− mice show normal behaviour in the open field test (G) and rotor rod test (H), but show a slight delay in passing balance beam (I). n = 12–17 (male), 10–12 (female); *P < 0.05, Student’s t-test. KO = knockout; WT = wild-type.
Figure 3
Figure 3
Myelination defects in TMEM106B-deficient mice. (AC) Tmem106b−/− mice show reduced myelination in the corpus callosum and cortex as indicated by Black-Gold staining. Scale bar = 100 µm. n = 3 (two females, one male each genotype), *P < 0.05, Student’s t-test. Signals from the corpus callosum and cortex regions were quantified separately in C. (D and E) Tmem106b−/− mice show a significant reduction in PLP and MOG fluorescent intensity in frontal cortex region. Scale bar = 10 µm. n = 3 (two females, one male each genotype), *P < 0.01, Student’s t-test. (FI) Western blot analysis of myelin proteins in wild-type (WT) and Tmem106b−/− frontal cortex lysates (F and G: 5 months old, Δ341bp; H and I: 10 months old, Δ7bp) n = 4 (two females, two males each genotype), *P < 0.05; **P < 0.01; paired t-test with wild-type littermate control. (J) Electron microscope images of myelin sheath in optic nerve isolated from wild-type and Tmem106b−/− mice (Δ7bp) at 12 months of age; scale bar = 200 nm. Magnified images show the separation and vacuolation of myelin sheath (arrowheads). Optic nerves from three male mice of each genotypes were analysed and representative images are shown. (K) Quantification of vacuoles per axon for experiment in J. Optic nerves from three mice per group (n = 3) were analysed. Vacuoles with size >13 nm were manually counted by experimenter blinded to genotypes. Total 196 axons (wild-type, WT) and 165 axons (KO) were analysed. **P < 0.01, Student’s t-test.
Figure 4
Figure 4
TMEM106B is expressed in oligodendrocytes and localizes in the lysosome compartment. (A and B) Western blot analysis of TMEM106B proteins levels in various cell types as indicated. TMEM106B levels relative to GAPDH were quantified from three independent samples and plotted relative to its levels in day in vitro 14 primary cortical neurons. n = 3. (C) Immunostaining of TMEM106B, LAMP1 and OLIG2 in brain sections from a 5-month-old wild-type mouse to show that TMEM106B is expressed and localized in the lysosome compartment in oligodendrocytes. Scale bar = 10 µm. (D and E) Immunostaining of TMEM106B, LAMP1 and OLIG2 in immature (C) and mature (D) oligodendrocytes cultured from postnatal Day 0–3 pups. Scale bar = 10 µm.
Figure 5
Figure 5
Changes in the levels of lysosome proteins in TMEM106B-deficient mice. Western blot analysis of lysosomal proteins in wild-type and Tmem106b−/− frontal cortex lysates (A and B: 5-month-old, Δ341bp; C and D: 10-month-old, Δ7bp). n = 3 (two females, one male each genotype), *P < 0.05, paired t-test with wild-type littermate controls.
Figure 6
Figure 6
TMEM106B deficiency results in lysosome and PLP trafficking defects in oligodendrocyte cells. (A and B) Western blot analysis of lysosome protein levels in control and Tmem106b−/− Oli-Neu cells generated using CRISPR/Cas9. n = 3–4, *P < 0.05, **P < 0.01; Student’s t-test. (C) Flag-tagged TMEM106B and control vector or myc-tagged Cath D construct were co-transfected into HEK293T cells as indicated. Cell lysates were subjected to anti-myc immunoprecipitation (IP) and the IP products were analysed using western blot with anti-myc and anti-Flag antibodies. (DF) Tmem106b−/− Oli-Neu cells show increased lysosome clustering in the perinuclear region (D and E) and decreased LAMP1 intensity per cell (D and F). Scale bar = 10 µm. Data were analysed from four independent experiments (n = 4), ***P < 0.001, Student’s t-test. (G and H) Live control and Tmem106b−/− Oli-Neu cells were stained with antibodies against extracellular domain of LAMP1. LAMP1 intensity was quantified in H. Scale bar = 10 µm. Data were analysed from three independent experiments (n = 3), ****P < 0.0001, Student’s t-test. (IK) Control and Tmem106b−/− Oli-Neu cells were transfected with GFP-PLP1 and live cells were subject to immunostaining using the O10 antibody, which recognizes the extracellular domain of PLP. The ratio of cell surface PLP/PLP-GFP was quantified in J. The percentage of cells with intracellular punctate GFP-PLP accumulation was quantified in K. Scale bar = 10 µm. Data were analysed from three independent experiments (253–485 cells/experiment, n = 3), ****P < 0.0001, Student’s t-test. (L) Control and Tmem106b−/− Oli-Neu cells were transfected with GFP-PLP1 and stained with anti-CathD antibody. The representative images from three independent experiments are shown. Scale bar = 10 µm.
Figure 7
Figure 7
The D252N mutant abolishes TMEM106B induced lysosome enlargement but induces lysosome clustering in the perinuclear regions. (A and B) The D252N mutant of TMEM106B is expressed at levels comparable to wild-type TMEM106B but shows reduced cleavage. GFP tagged wild-type or D252N mutant of TMEM106B were transfected into HEK293T cells and lysates were collected 2 days later for western blot analysis. n = 4, n.s = not significant, *P < 0.05, Student’s t-test. (C and D) D252N does not affect TMEM106B dimerization. Untagged wild-type or D252N mutant of TMEM106B were transfected into HEK293T cells as indicated and lysates were collected 2 days later for western blot analysis under non-reducing conditions. n = 4, n.s = not significant, Student’s t-test. (EG) Wild-type Oli-Neu cells were transfected with GFP vector or GFP tagged wild-type or D252N mutant TMEM106B and stained with anti-LAMP1 antibodies. Lysosome size and distribution were measured and quantified. Scale bar = 10 µm. Data were analysed from three independent experiments (n = 3), *P < 0.05, **P < 0.01; ***P < 0.001, ****P < 0.0001, n.s = not significant, Student’s t-test. (H and I) Tmem106b−/− Oli-Neu cells were transfected with GFP vector or GFP tagged wild-type or D252N mutant TMEM106B and stained with anti-LAMP1 antibodies. Lysosome distribution were quantified. Scale bar = 10 µm. Data were analysed from three independent experiments (n = 3), *P < 0.05, **P < 0.01, n.s = not significant, Student’s t-test.
Figure 8
Figure 8
HEK293T cells overexpressing TMEM106B-wild-type, but not TMEM106B-D252N, hyper-acidify their lysosomes. (A and B) Fixed J774 macrophages, with their lysosomes labelled with dextran-Alexa405-ApHID, were incubated in various pH-adjusted buffers containing 2.5 µM nigericin and monensin (A), and ApHID/Alexa405 signal ratios were plotted against buffer pH (B). Scale bars = 10 µm. (C and D) HEK293 cells transfected with mApple tagged wild-type or D252N TMEM106B, or empty mApple vector were incubated with dextran-Alexa405-ApHID, which was delivered to lysosomes. mApple is pseudo-coloured blue in the magnified images. The three small panels next to each image correspond to greyscale images indicating Alexa405 (top), ApHID (middle), and mApple (bottom) (D). Red arrowheads indicate enlarged lysosomes with strong ApHID fluorescence. Ratiometric pH imaging was carried out for each condition, and ApHID/Alexa405 ratios were interpolated to pH values using the calibration shown in B. Lysosomal pH values for each condition are shown in C. Scale bars = 10 µm. Error bars in the plots indicate SEM.

Similar articles

Cited by

References

    1. Alizadeh A, Dyck SM, Karimi-Abdolrezaee S.. Myelin damage and repair in pathologic CNS: challenges and prospects. Front Mol Neurosci 2015; 8: 35. - PMC - PubMed
    1. Blasi E, Barluzzi R, Bocchini V, Mazzolla R, Bistoni F.. Immortalization of murine microglial cells by a v-raf/v-myc carrying retrovirus. J Neuroimmunol 1990; 27: 229–37. - PubMed
    1. Brady OA, Zheng Y, Murphy K, Huang M, Hu F.. The frontotemporal lobar degeneration risk factor, TMEM106B, regulates lysosomal morphology and function. Hum Mol Genet 2013; 22: 685–95. - PMC - PubMed
    1. Brady OA, Zhou X, Hu F.. Regulated intramembrane proteolysis of the frontotemporal lobar degeneration risk factor, TMEM106B, by signal peptide peptidase-like 2a (SPPL2a). J Biol Chem 2014; 289: 19670–80. - PMC - PubMed
    1. Charzewska A, Wierzba J, Izycka-Swieszewska E, Bekiesinska-Figatowska M, Jurek M, Gintowt A, et al.Hypomyelinating leukodystrophies - a molecular insight into the white matter pathology. Clin Genet 2016; 90: 293–304. - PubMed

Publication types