. 2020 Aug;40(6):807-819.
doi: 10.1007/s10875-020-00803-9. Epub 2020 Jun 22.

Three Copies of Four Interferon Receptor Genes Underlie a Mild Type I Interferonopathy in Down Syndrome

Affiliations

Three Copies of Four Interferon Receptor Genes Underlie a Mild Type I Interferonopathy in Down Syndrome

Xiao-Fei Kong et al. J Clin Immunol. 2020 Aug.

Abstract

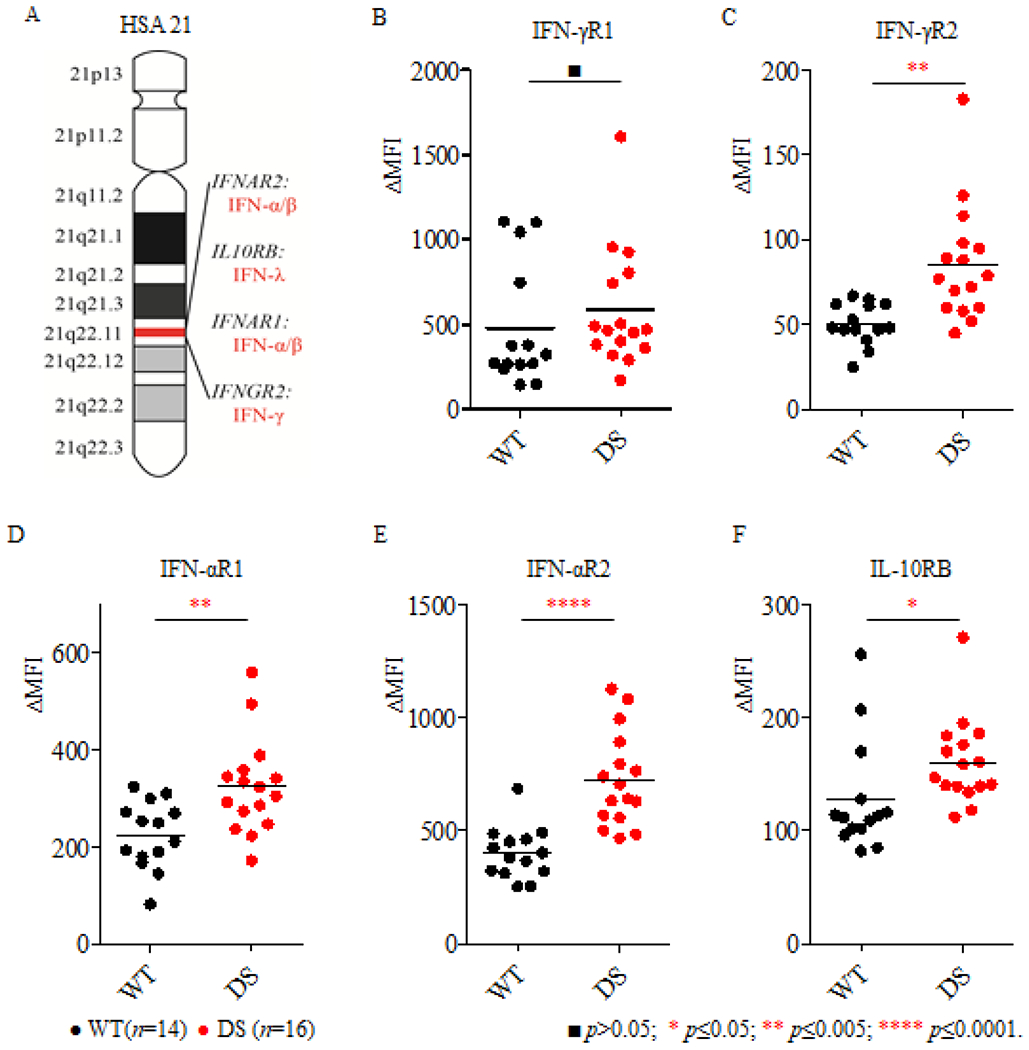
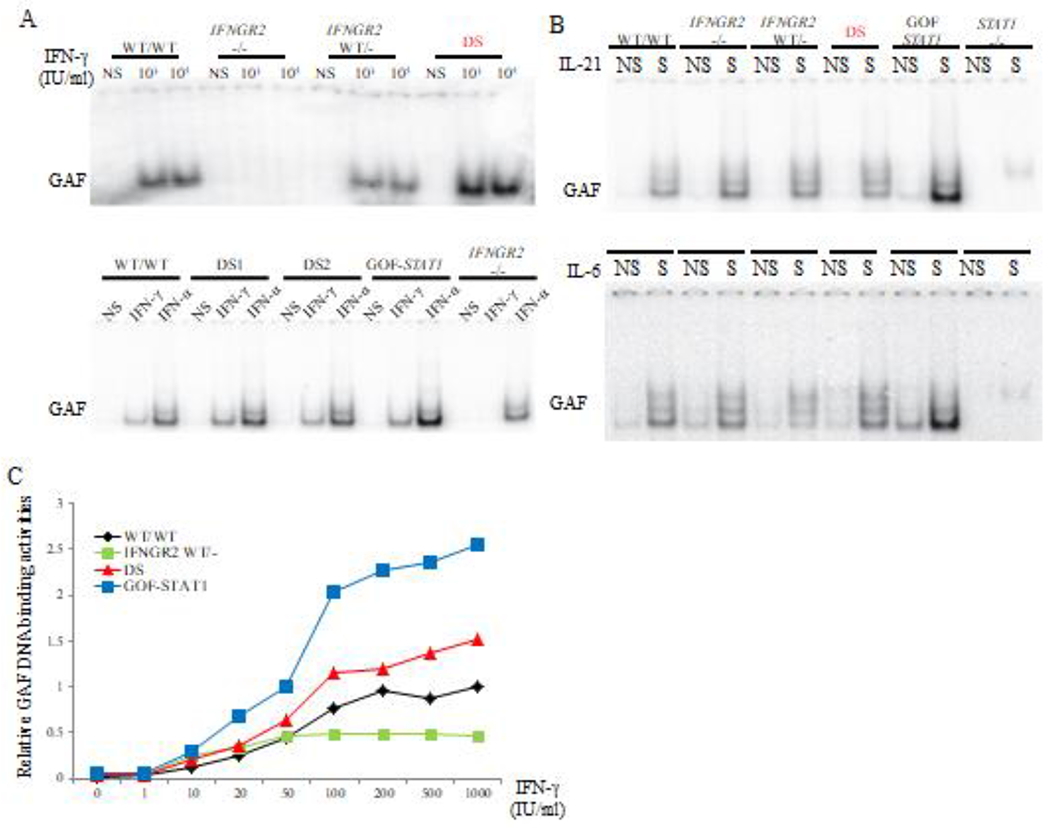
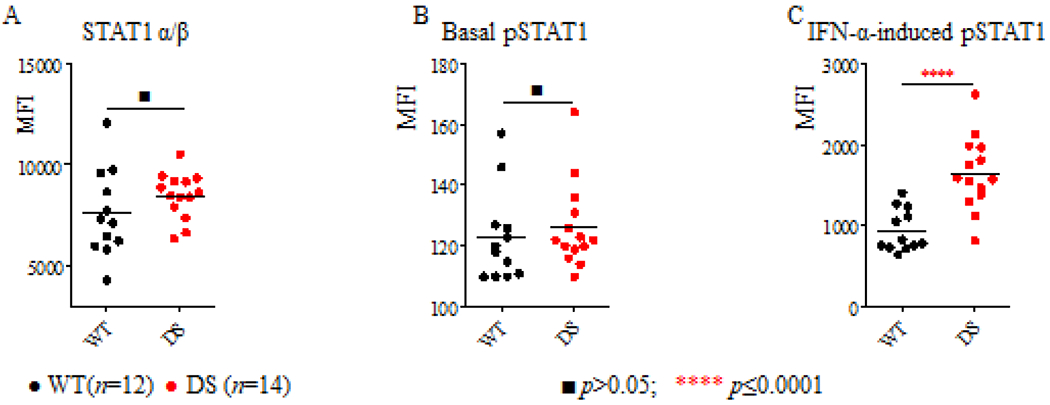
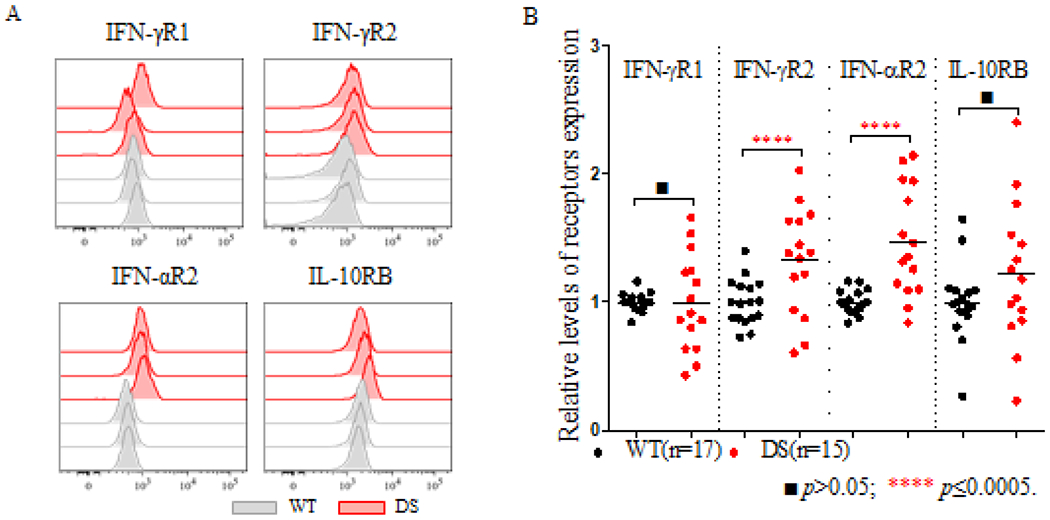
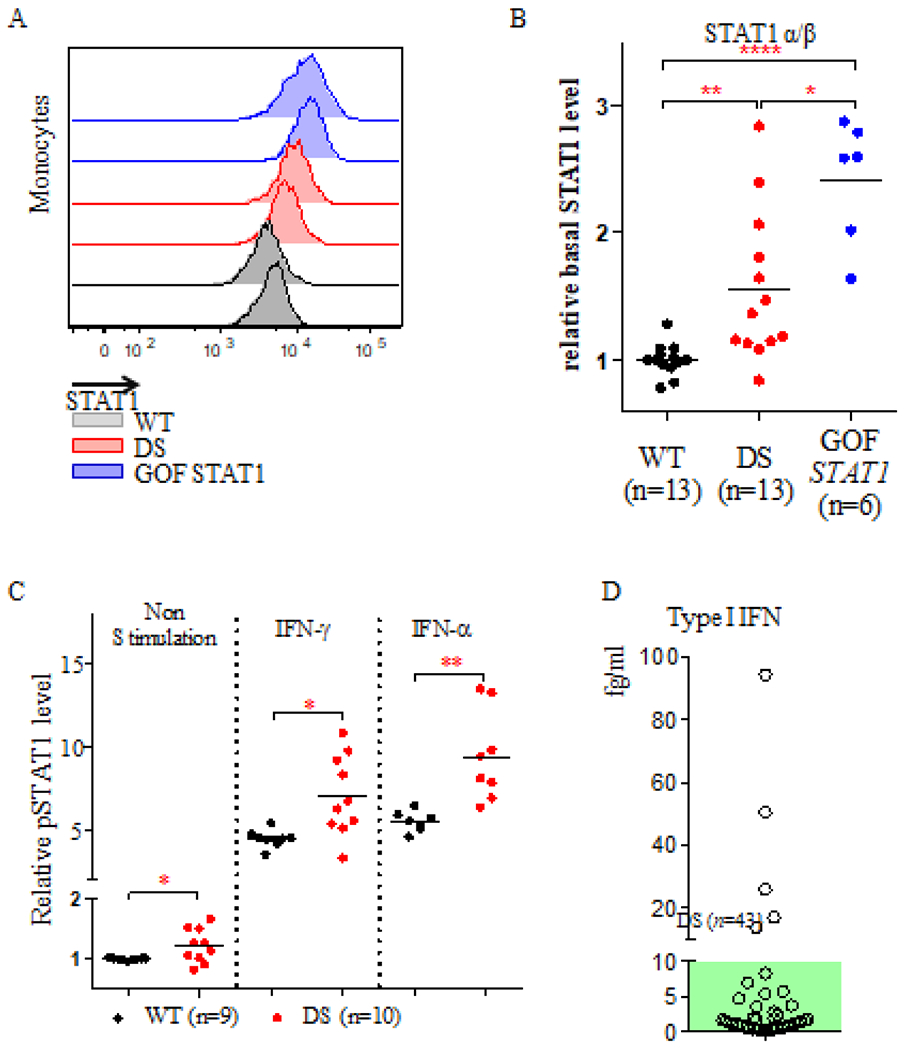
Down syndrome (DS) is characterized by the occurrence of three copies of human chromosome 21 (HSA21). HSA21 contains a cluster of four interferon receptor (IFN-R) genes: IFNAR1, IFNAR2, IFNGR2, and IL10RB. DS patients often develop mucocutaneous infections and autoimmune diseases, mimicking patients with heterozygous gain-of-function (GOF) STAT1 mutations, which enhance cellular responses to three types of interferon (IFN). A gene dosage effect at these four loci may contribute to the infectious and autoimmune manifestations observed in individuals with DS. We report high levels of IFN-αR1, IFN-αR2, and IFN-γR2 expression on the surface of monocytes and EBV-transformed-B (EBV-B) cells from studying 45 DS patients. Total and phosphorylated STAT1 (STAT1 and pSTAT1) levels were constitutively high in unstimulated and IFN-α- and IFN-γ-stimulated monocytes from DS patients but lower than those in patients with GOF STAT1 mutations. Following stimulation with IFN-α or -γ, but not with IL-6 or IL-21, pSTAT1 and IFN-γ activation factor (GAF) DNA-binding activities were significantly higher in the EBV-B cells of DS patients than in controls. These responses resemble the dysregulated responses observed in patients with STAT1 GOF mutations. Concentrations of plasma type I IFNs were high in 12% of the DS patients tested (1.8% in the healthy controls). Levels of type I IFNs, IFN-Rs, and STAT1 were similar in DS patients with and without recurrent skin infections. We performed a genome-wide transcriptomic analysis based on principal component analysis and interferon modules on circulating monocytes. We found that DS monocytes had levels of both IFN-α- and IFN-γ-inducible ISGs intermediate to those of monocytes from healthy controls and from patients with GOF STAT1 mutations. Unlike patients with GOF STAT1 mutations, patients with DS had normal circulating Th17 counts and a high proportion of terminally differentiated CD8+ T cells with low levels of STAT1 expression. We conclude a mild interferonopathy in Down syndrome leads to an incomplete penetrance at both cellular and clinical level, which is not correlate with recurrent skin bacterial or fungal infections. The constitutive upregulation of type I and type II IFN-R, at least in monocytes of DS patients, may contribute to the autoimmune diseases observed in these individuals.

Keywords: Down syndrome; JAK-STAT; interferon receptors; interferonopathy.


Conflict of interest statement

Conflict of Interest:

Dr. Casanova reports personal fees from Celgene, personal fees from ADMA, personal fees from Nimbus, personal fees from Vitae Pharmaceuticals, Inc, personal fees from KymeraTX, personal fees from Sanofi, personal fees from Asahi Kasei, personal fees from Pfizer, personal fees from Elixiron Immunotherapeutics, outside the submitted work. None of the other authors have no conflict of interest to declare.

Figures

Figure 1:
Figure 1:. Surface expression of IFN-Rs on EBV-B cells from DS patients.
(A). Schematic diagram of the structure of HSA21, with the IFN-R locus including IFNAR2, IL-10RB, IFNAR1 and IFNGR2 as well as genes for the corresponding agonists; (B-F). IFN-R expression was analyzed in EBV-B cells from healthy controls (WT, n=14) and DS patients (DS, n=16) with the corresponding specific antibodies, against IFN-γR1 (B), IFN-γR2 (C), IFN-αR1 (D), IFN-αR2 (E) and IL-10RB (F). ΔMFI was calculated by subtracting the MFI for the isotype control from that for the specific anti-IFN-R antibody. Significance was assessed by calculating p values in unpaired t tests. ■p>0.05; * p≤ 0.05; * p≤0.005; *** p≤ 0.0005; **** p≤ 0.0001.
Figure 2:
Figure 2:. IFN responses in EBV-B cells from DS patients.
(A). EMSA analysis of GAF DNA-binding activity in the EBV-B cells from a healthy control, a patient with complete IFNGR2 deficiency, a patient with a heterozygous IFNGR2 mutation, a patient with GOF STAT1 mutation and two DS patients, with and without IFN stimulation. (B). EMSA analysis of GAF DNA-binding activity in the EBV-B cells as described above, in response to stimulation with IL-21 (upper panel) or IL-6 (lower panel). All the experiments were performed at least three times. (C). IFN-γ dose-dependent GAF DNA-binding activity in EBV-B cells, as indicated.
Figure 3:
Figure 3:. FACS analysis of total STAT1 and pSTAT1 in EBV-B cells from DS patients.
The levels of total STAT1 protein (A), basal pSTAT1(B) and IFN-α-induced pSTAT1(C) in the EBV-B cells of healthy controls (n=14) and DS patients (n=16) were compared. Thep values were obtained in unpaired t tests. ■p>0.05; **** p≤ 0.0001.
Figure 4:
Figure 4:. Surface expression of IFN-Rs on monocytes from DS patients.
(A). Representative histogram of the levels of IFN-γR1, IFN-γR2, IFN-αR2 and IL-10RB expressed on monocytes from three healthy controls (WT) and three DS patients (DS) in one representative experiment; (B). The relative levels of IFN-Rs on monocytes were compared between healthy controls (n=17) and DS patients (n=15). The p values were obtained in unpaired t tests. ■ p>0.05; **** p≤ 0.0001.
Figure 5:
Figure 5:. Total STAT1 and pSTAT1 levels in monocytes and plasma type I interferon levels in DS patients.
(A). Representative histogram of total STAT1 α/β protein levels in monocytes from two healthy controls (gray), two DS patients (red) and two patients with GOF STAT1 mutations (blue). (B). Relative levels of total STAT1 α/β protein in 13 healthy controls, 13 DS patients, and 6 patients with GOF STAT1 mutations. (C). Relative pSTAT1 levels in monocytes from 9 healthy controls and 10 DS patients, with and without IFN stimulation. Difference between the two groups were assessed in t tests. * p≤ 0.05; ** p≤0.005; **** p≤ 0.0001. (D). Plasma IFN-α protein levels were quantified in 43 DS patients with a single molecular array (Sigmoa). The green area indicates the normal range of IFN-α levels (≤ 10 fg/ml).
Figure 6:
Figure 6:. Modular interferon signature in monocytes from DS patients and patients with STAT1 GOF.
(A). Differences in the levels of transcripts from six “interferon modules” are shown on the heatmap above. Each column corresponds to a different subject (healthy controls are shown in black, DS in red and STAT1 GOF in blue). Each row corresponds to a different module. Both modules and subjects are arranged by hierarchical clustering. The colored spots on the map represent the percentage of the transcripts in a given module for which abundance was higher (in red) or lower (in blue) in DS patients than in controls (the cutoff was a 1.5-fold difference and 100-fold difference relative to the mean for the controls). ➢ : DS patient with history of recurrent skin bacterial infections; ✧: DS patient with history chronic mucocutaneous candidiasis; ❖: DS patient with high type I IFN level (≥10fg/ml). (B). The table below lists the genes in each of the transcriptional modules, with their associated functional annotations.
Figure 7:
Figure 7:. IFN-α responses and STAT1 levels in the CD8+ T cells of DS patients.
(A). Representative histogram, (B). Summary of the relative levels of pSTAT1 in the CD8+ T cells of healthy controls, DS patients, and patients with STAT1 GOF with and without IFN-α stimulation. (C). Representative FACS histogram of STAT1 levels in the four subsets of CD8+ T cells from one DS patient. The p values were obtained in unpaired t tests. ■ p>0.05; * p≤ 0.05;.

References

    1. Lejeune J, Gautier M & Turpin R A study of somatic chromosomes in nine infants with mongolism. C.R. Acad. Sci 248, 1721–1722 (1959). - PubMed
    1. de Graaf G, Buckley F & Skotko BG Estimation of the number of people with Down syndrome in the United States. Genet. Med 19, 439–447 (2017). - PubMed
    1. Oster J, Mikkelsen M & Nielsen A Mortality and life-table in Down’s syndrome. Acta Paediatr. Scand 64, 322–6 (1975). - PubMed
    1. Bell JA, Pearn JH & Firman D Childhood deaths in Down’s syndrome. Survival curves and causes of death from a total population study in Queensland, Australia, 1976 to 1985. J. Med. Genet 26, 764–768 (1989). - PMC - PubMed
    1. Nagarajan A et al. Oral Candidal and Streptococcal carriage in Down syndrome patients. J. Nat. Sci. Biol. Med 6, 300 (2015). - PMC - PubMed

Publication types

MeSH terms