. 2020 Jun 23:9:e54590.
doi: 10.7554/eLife.54590.

A new genetic strategy for targeting microglia in development and disease

Affiliations

A new genetic strategy for targeting microglia in development and disease

Gabriel L McKinsey et al. Elife. .

Abstract

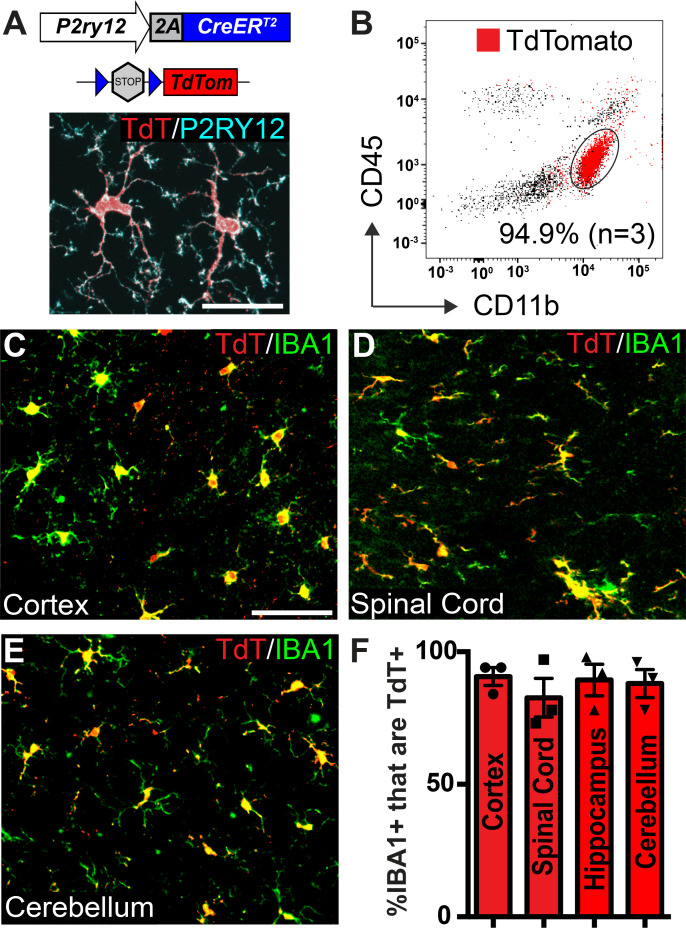
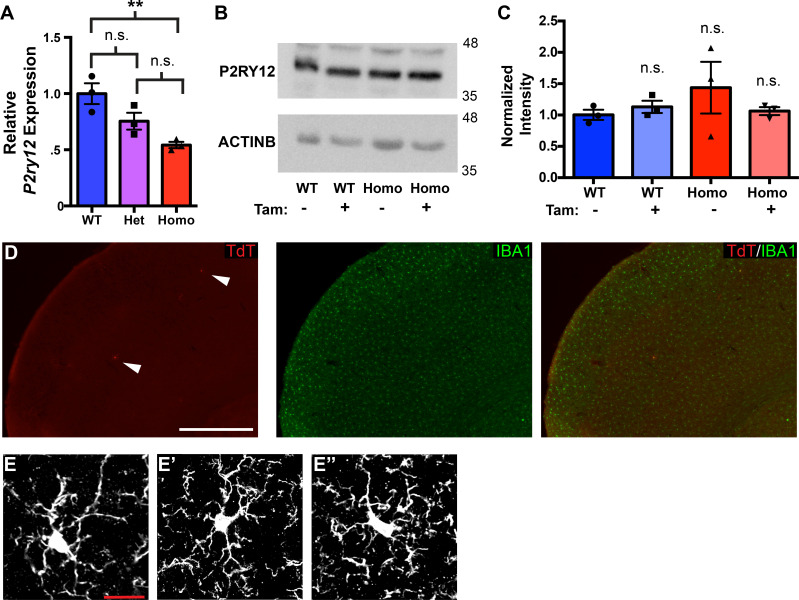
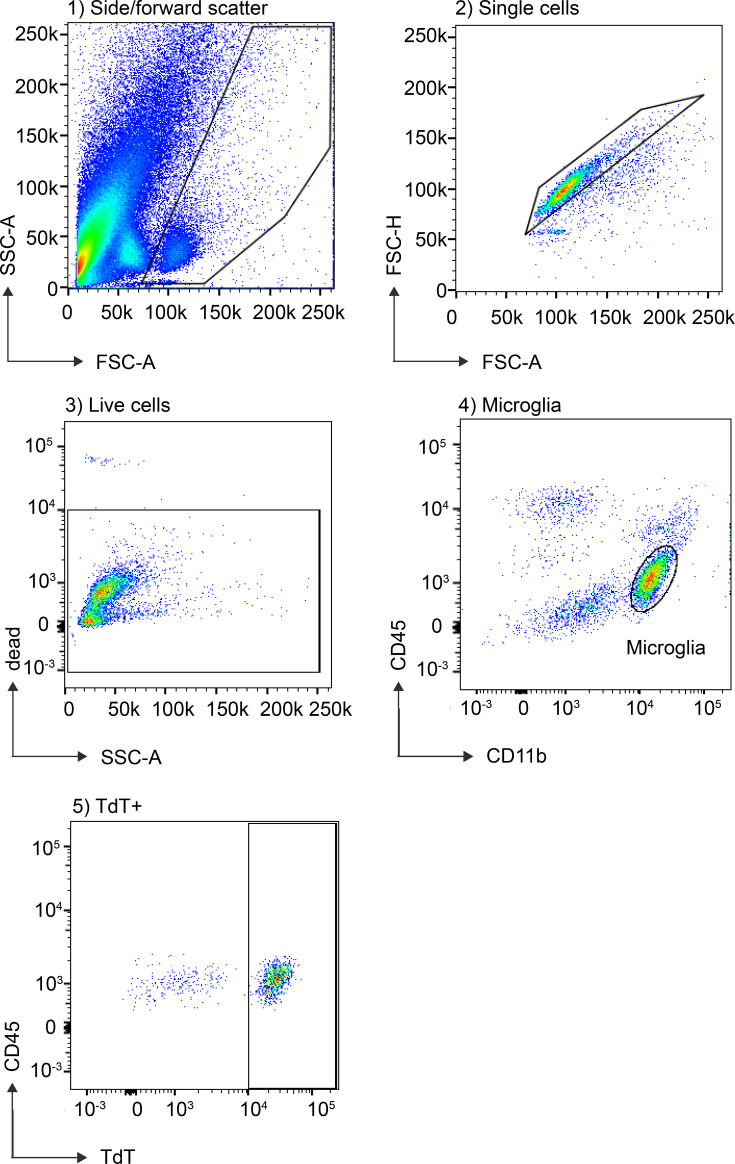
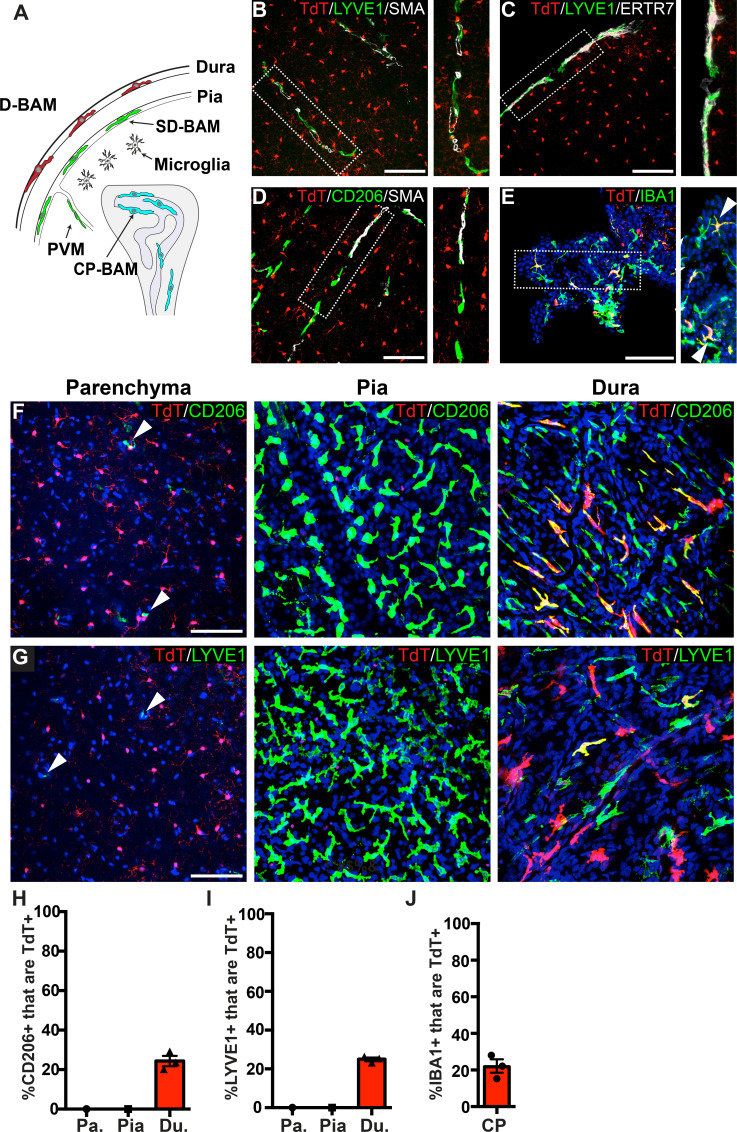
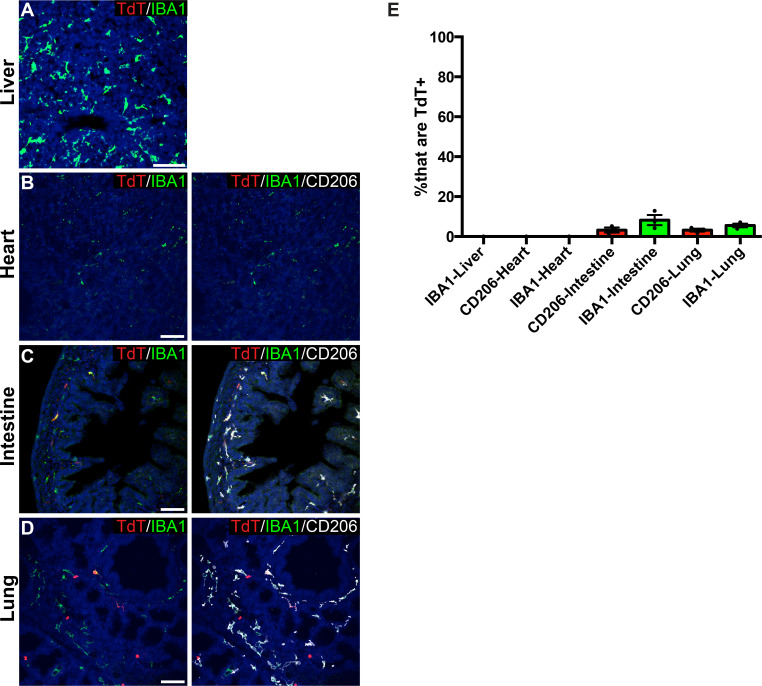
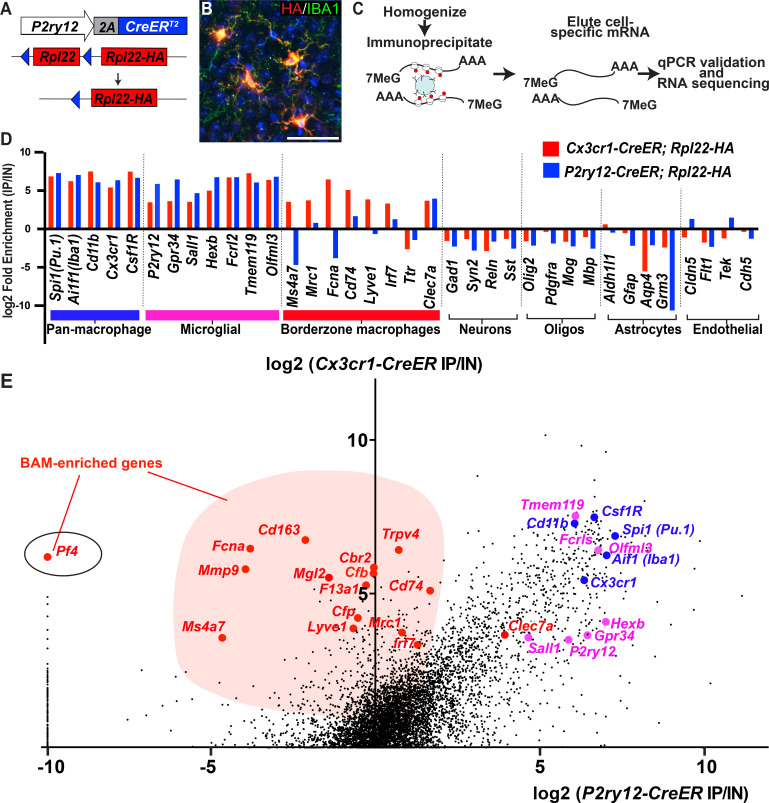
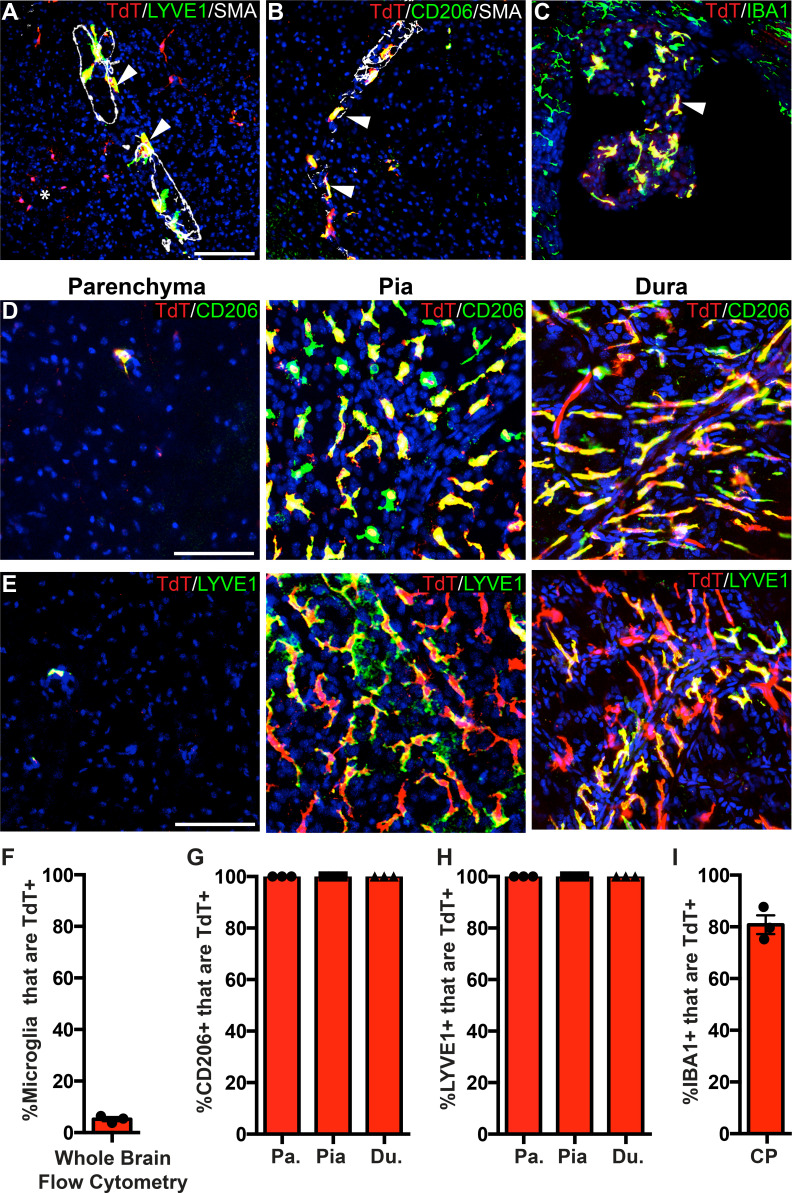
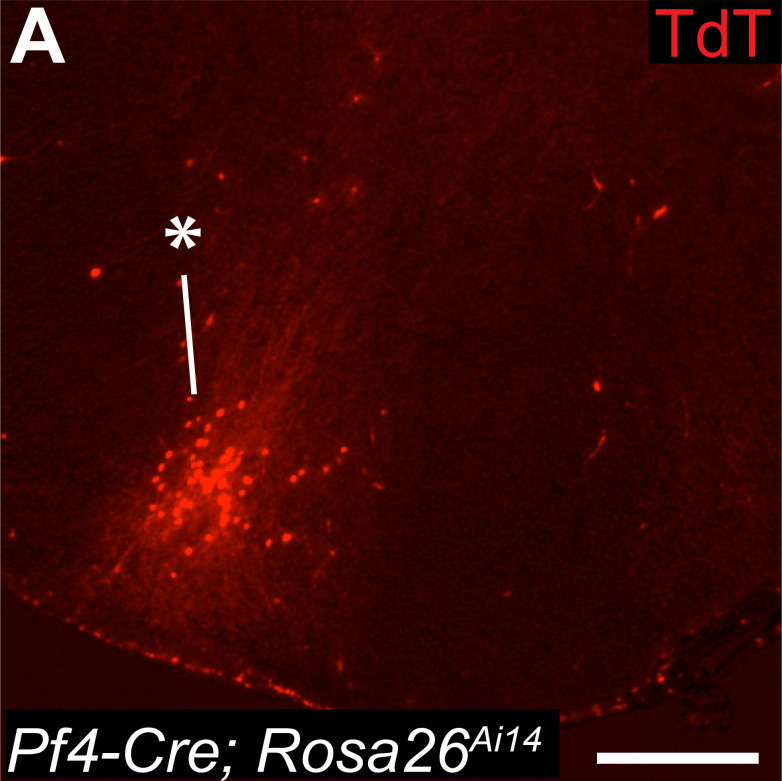
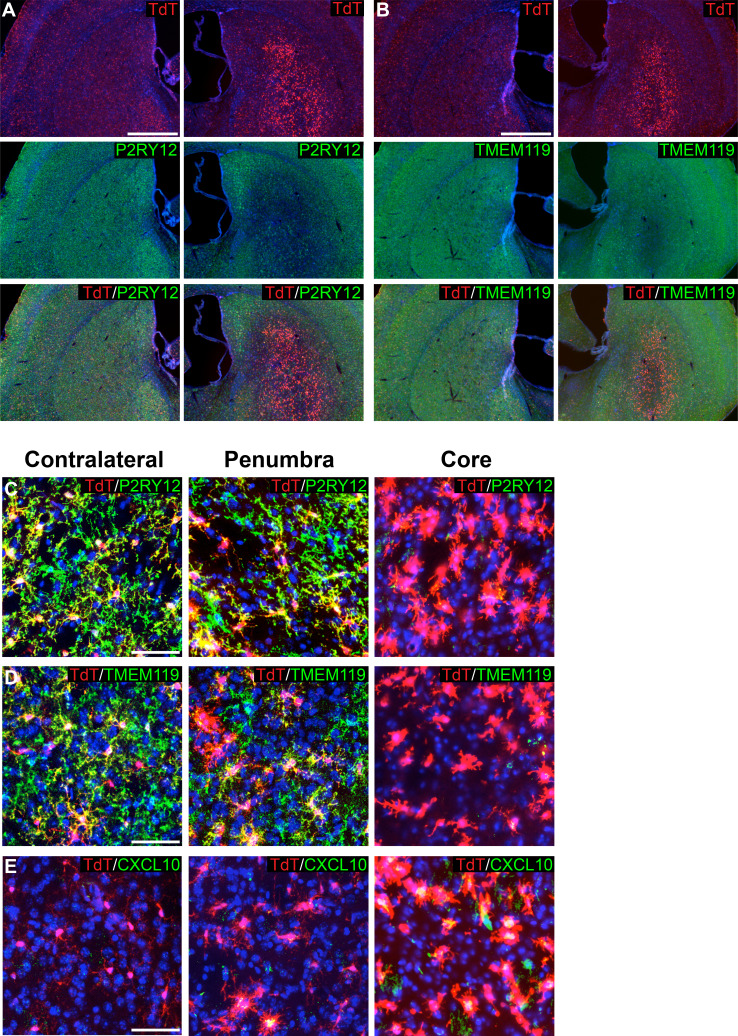
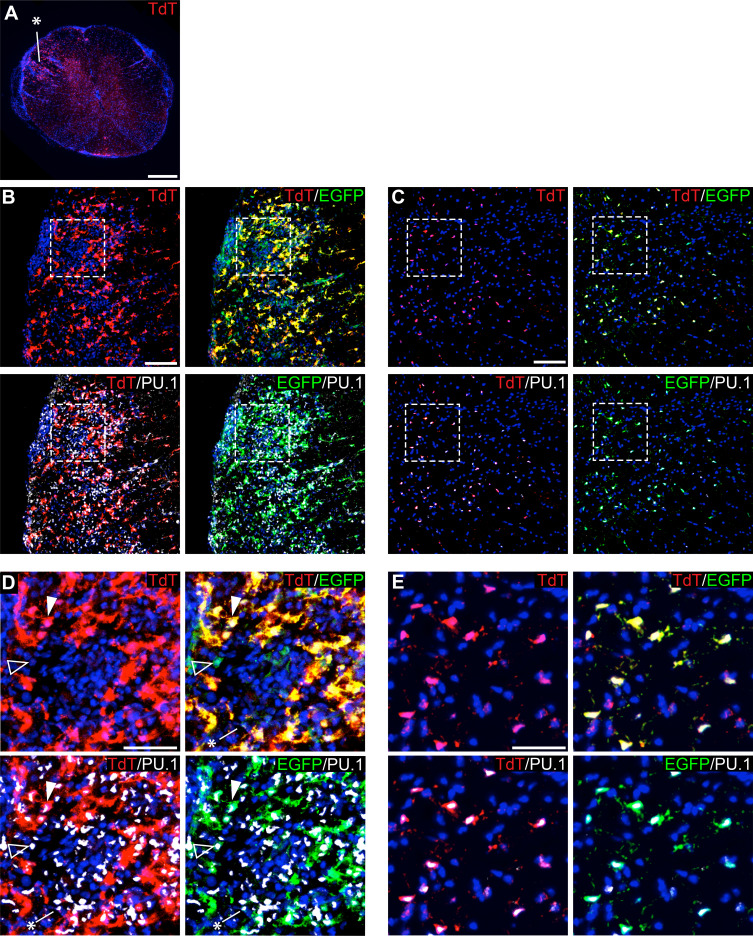
As the resident macrophages of the brain and spinal cord, microglia are crucial for the phagocytosis of infectious agents, apoptotic cells and synapses. During brain injury or infection, bone-marrow derived macrophages invade neural tissue, making it difficult to distinguish between invading macrophages and resident microglia. In addition to circulation-derived monocytes, other non-microglial central nervous system (CNS) macrophage subtypes include border-associated meningeal, perivascular and choroid plexus macrophages. Using immunofluorescent labeling, flow cytometry and Cre-dependent ribosomal immunoprecipitations, we describe P2ry12-CreER, a new tool for the genetic targeting of microglia. We use this new tool to track microglia during embryonic development and in the context of ischemic injury and neuroinflammation. Because of the specificity and robustness of microglial recombination with P2ry12-CreER, we believe that this new mouse line will be particularly useful for future studies of microglial function in development and disease.

Keywords: fate mapping; immunology; inflammation; microglia; mouse; multiple sclerosis; neuroinflammation; neuroscience; ribosomal profiling; stroke.


Conflict of interest statement

GM, CL, AK, AN, NS, AL, EC, FG, TA No competing interests declared

Figures

Figure 1.
Figure 1.. Microglia recombination by P2ry12-CreER.
(A) Design of the P2ry12 knock-in allele and a P2ry12-CreER;Rosa26Ai14 mouse brain section immunostained for P2RY12 (cyan) and TdTomato (red). (B) Flow cytometry analysis of recombined TdTomato+ microglia in a P2ry12-CreER;Rosa26Ai14 mouse. Microglia were pre-gated on forward scatter, isolation of single cells, and removal of dead cells. TdTomato+ cells are marked in red. 94.9 ± 2.75% of microglia (CD11b+CD45int cells) were recombined by P2ry12-CreER. (C-E) Images of recombination in microglia of the cerebral cortex (C), spinal cord (D) cerebellum (E) in P2ry12-CreER; Rosa26Ai14 mice. Sections stained with pan-macrophage marker IBA1 (green). (F) Immunohistochemical quantification of recombination in the cerebral cortex, spinal cord, hippocampus and cerebellum. For B-E, n = 3 mice. Error bars in F = standard error of the mean (SEM). Scale bars = 20 µm (A), 50 µm (C).
Figure 1—figure supplement 1.
Figure 1—figure supplement 1.. qPCR and western blot analysis of P2ry12 expression; background recombination of P2ry12-CreER.
(A) Quantitative RT-PCR analysis of P2ry12 brain transcript levels in wildtype, P2ry12-CreER heterozygous and P2ry12-CreER homozygote mouse brains. (B) Western blot analysis of P2RY12 protein expression in WT and P2ry12-CreER homozygote brains, with or without tamoxifen treatment. (C) Densitometry quantification of western blot analysis. (D) Non-tamoxifen recombination in the cerebral cortex of a P2ry12-CreER; Rosa26Ai14 heterozygous mouse. Two recombined microglia are seen in this field of view of the cerebral cortex. Section stained for IBA1 (green). (E) High-magnification images of IBA1 staining in wildype (E), P2ry12-CreER heterozygous (E’) and P2ry12-CreER homozygous (E’) mice. For analysis in A and C, N = 3 mice per condition/genotype. For analysis in A., **p-value=0.0089. Statistical comparisons in A. and C. were made with a one-way ANOVA and a Tukey’s multiple comparisons test. Error bars = SEM (A), SE (C). Scale bars = 500 µm (D), 20 µm (E).
Figure 1—figure supplement 2.
Figure 1—figure supplement 2.. Flow cytometry gating strategy used for isolating microglia and TdT+ cells.
Flow cytometry analysis of microglial recombination in P2ry12-CreER; Rosa26Ai14 brains involved pre-gating for 1) Side-scatter 2) Single cells 3) Live cells. Microglia were then identified by expression of CD11b and CD45 (4) and analyzed for TdT expression (5).
Figure 2.
Figure 2.. Analysis of P2ry12-CreER recombination in brain macrophage populations.
(A) Cartoon depicting the subsets of brain macrophage populations that were analyzed in P2ry12-CreER; Rosa26Ai14 mice. D-BAMs, SD-BAMs, CP-BAMs = dural, subdural, choroid plexus border-associated macrophages. PVMs = perivascular macrophages. Adapted, with permission, from Van Hove et al., 2019. (B) Analysis of P2ry12-CreER; Rosa26Ai14 recombination in SMA-adjacent LYVE1+ perivascular macrophages. No recombination was seen in perivascular macrophages, unlike Cx3CR1-CreER; Rosa26Ai14 mice (see Figure 2—figure supplement 1). (C) Analysis of recombination in LYVE1+ pial macrophages. ERTR7 expression delineates pial boundaries. (D) Analysis of recombination in SMA-adjacent CD206+ perivascular macrophages. (E) Analysis of recombination in IBA1+ macrophages of the choroid plexus. (F) Whole-mount cerebral cortex and dura, immunostained for CD206. (G) Whole-mount cerebral cortex and dura, immunostained for LYVE1. Weakly red cells in pial images are microglia in deeper focal planes. (H–I) Quantification of recombination in CD206+ (H) and LYVE1+ (I) macrophages in the parenchymal, pial and dural spaces. (J) Quantification of recombination in IBA1+ macrophages of the choroid plexus. Error bars = SEM. Scale bars = 100 µm (B–G).
Figure 2—figure supplement 1.
Figure 2—figure supplement 1.. Analysis of perivascular and pial recombination in Cx3CR1-CreER; Rosa26Ai14 mice.
(ACx3cr1-CreER;Rosa26Ai14 recombination labels SMA-adjacent, LYVE1(+) perivascular macrophages (arrowheads), unlike P2ry12-CreER. (B) Cx3cr1-CreER; Rosa26Ai14 recombination in the pia. (C) Cx3cr1-CreER; Rosa26Ai14 recombination in IBA1+ macrophages of the choroid plexus. Scale bars = 100 µm (A–C).
Figure 3.
Figure 3.. P2ry12-CreER recombination in the embryonic brain.
(A) Diagram of P2ry12-CreER; Rosa26Ai14 embryonic tamoxifen induction regimen. Pregnant mice were induced with tamoxifen at E13.5, E15.5 and E17.5. Embryos were collected at E18.5. (B) Recombination in the E18.5 brain, shown in three images, arranged rostral (B) to caudal (B’’). (C) P2ry12-CreER; Rosa26Ai14 recombination in the developing cerebral cortex. Recombination was seen primarily in the parenchyma of the brain, with low levels of recombination in the meninges (arrowhead). This is quantified in I and J. (D) Recombination in LYVE1+ cells of the embryonic meninges (arrowheads). Recombination in microglia is noted with asterisks. (E) Recombination in IBA1+ cells of the choroid plexus, quantified in K. (F) Recombination was most concentrated in IBA1+ cells of the hippocampal and cortical SVZ (arrowheads). (G) CD206 staining of recombined cells of the hippocampal SVZ and cortical SVZ. CD206 expression was lower, and coexpression with TdT less frequent, with greater distance from the hippocampus. (H) Recombination was observed in SMA-adjacent CD206+ perivascular macrophages at E18.5 (arrowheads). (I–J) Quantification of recombination in meningeal CD206+ (I) and LYVE1+ (J) macrophages. (K) Quantification of recombination in embryonic choroid plexus IBA1+ macrophages. Cx = Cortex, LGE = lateral ganglionic eminence, LS = Lateral migratory stream, Str = Striatum, Th = Thalamus, SVZ = Subventricular zone. Scale bars = 800 µm (B), 400 µm (C, F), 100 µm (D, G, H), 200 µm (E).
Figure 4.
Figure 4.. P2ry12-CreER recombination in non-microglial populations.
(A) Analysis of P2ry12-CreER; Rosa26Ai14 recombination showed a lack of recombination in oligodendrocytes (OLIG2), astrocytes (SOX9) or neurons (NEUN). (B) Analysis of recombination and coexpression with Cx3cr1-EGFP and CD206 in the spleen, lungs, heart, thymus, intestine and liver of adult P2ry12-CreER; Rosa26Ai14; Cx3cr1-EGFP mice. (C) Quantification of recombination overlap with Cx3CR1-EGFP (heart, intestine, lungs, spleen, thymus) or CD206 (heart, intestine, lungs). CD206 coexpression in the spleen and thymus was not analyzed due to density of CD206 expression. (D) Flow cytometry and blood smear recombination analysis revealed negligible recombination of blood cells in P2ry12-CreER;Rosa26Ai14 mice compared to Cx3cr1-EGFP (internal control), or to Cx3cr1-CreER; Rosa26Ai14 mice. *p=0.0015, Student’s t-test. N = 4 mice for A. and D., N = 3 mice for B and C. Scale bars = 50 µm (A), 100 µm (B,D).
Figure 4—figure supplement 1.
Figure 4—figure supplement 1.. P2ry12-CreER recombination in the spleen, liver, lungs and circulating platelets.
(AP2ry12-CreER recombination in the spleen showed a striking pattern of recombination in the marginal zone of the spleen. (B) Higher magnification of spleen recombination and comparison with Cx3CR1-EGFP expression shows that P2ry12-CreER recombination in the spleen is more restricted to the marginal zone than Cx3CR1-EGFP expression, which is also expressed throughout the red and white pulp. (C) P2ry12-CreER; Rosa26Ai14 recombination in the adult liver was not seen in perivascular SMA-adjacent Cx3cr1-EGFP cells, but was seen in Kupffer cells. (D) P2ry12-CreER; Rosa26Ai14 recombination in the lungs was seen primarily around SMA-delimited airways and associated vessels. (E) P2ry12-CreER; Rosa26Ai14 recombination in platelets was analyzed by blood smears. In PF4-Cre; Rosa26Ai14 mice, which have well-described platelet recombination, TdTomato+; CD41+ platelets were observed, but no TdTomato expression was observed in P2ry12-CreER; Rosa26Ai14 platelets. Scale bars = 1 mm (A), 500 µm (B), 100 µm (C, D), 30 µm (E).
Figure 4—figure supplement 2.
Figure 4—figure supplement 2.. P2ry12-CreER recombination in embryonic organs.
Pregnant mice were induced with tamoxifen at E13.5, E15.5 and E17.5 and embryos were collected at E18.5. The liver (A), heart (B), intestine (C) and lungs (D) were analyzed for recombination and coexpression with IBA1 or CD206. (E) Quantification of recombination overlaps with IBA1 or CD206 in the liver, heart, intestine and lungs. Error bars = SEM. Scale bars = 50 µm (A–D).
Figure 5.
Figure 5.. Cre-dependent ribosomal profiling of microglia.
(A) Diagram illustrating P2ry12-CreER-dependent recombination of the Rpl22-HA allele, used to perform cell-type specific ribosomal profiling. (B) Immunostaining of tagged microglia for HA (red) and IBA1 (green) shows strong Cre-dependent expression of Rpl22-HA in microglia. (C) Workflow diagram for Cre-dependent ribosomal profiling experiments. (D) A comparison of relative enrichment for cell-type specific markers from P2ry12-CreER; Rpl22-HA and Cx3cr1-CreER; Rpl22-HA ribosomal immunoprecipitations. (E) Genome-wide comparisons of relative enrichment following immunoprecipitation of ribosomes in P2ry12-CreER; Rpl22-HA and Cx3cr1-CreER; Rpl22-HA mice. Pan-macrophage markers in blue; presumptive microglial markers in pink; presumptive BAM markers in red.
Figure 6.
Figure 6.. PF4-Cre robustly labels border-associated macrophages of the brain.
(A-C) Analysis of PF4-Cre; Rosa26Ai14 recombination in (A) LYVE1+ perivascular macrophages, (B) CD206+ perivascular macrophages, and (C) IBA1+ choroid plexus macrophages. Asterisk in A: recombination in a small cluster of microglia. (D–E) PF4-Cre; Rosa26Ai14 whole-mount immunostaining of the cerebral cortex parenchyma, pia and dura for CD206 (D) and LYVE1 (E). (F) Flow cytometry quantification of microglial recombination in PF4-Cre; Rosa26Ai14 mice. (G–H) Quantification of PF4-Cre; Rosa26Ai14 recombination in (G) CD206+ and (H) LYVE1+ perivascular, pial and dural macrophages. (I) Quantification of PF4-Cre; Rosa26Ai14 recombination in IBA1+ cells of the choroid plexus. Error bars = SE (F–H), SEM (I). Scale bars = A-E-100um.
Figure 6—figure supplement 1.
Figure 6—figure supplement 1.. PF4-Cre recombination in non-myeloid brain parenchymal cells.
PF4-Cre; Rosa26Ai14 mice consistently recombined what appears to be a subpopulation of neurons of the anterior amygdala (asterisk). Scale bar = 100 µm.
Figure 7.
Figure 7.. Genetic labeling of microglia during MCAO-induced stroke.
(A-B) Genetically labeled microglia analyzed following MCAO-induced stroke show significant downregulation of microglial markers P2RY12 (A) and TMEM119 (B) in the ischemic core and penumbra. For both (A) and (B), the contralateral control hemisphere is the left column, the stroke-affected ipsilateral hemisphere is the right column. (C–D) Higher magnification of contralateral control area of the striatum, the stroke penumbra and core. P2RY12 and TMEM119 expression is reduced in the penumbra, and almost completely lost in the stroke core. In the stroke core, microglia are larger and amoeboid. (E) The cytokine CXCL10 is significantly upregulated in microglia of the stroke core. Scale bars = 500 µm (A,B), 50 µm (C–E).
Figure 8.
Figure 8.. Genetic labeling of microglia during EAE.
(A) Spinal cord microglia labeled prior to induction of EAE are dispersed throughout inflammatory lesions (see asterisk). (B) EAE spinal cord lesion in a P2ry12-CreER; Rosa26Ai14; Cx3cr1-EGFP mouse that was given tamoxifen a week prior to EAE induction. Sections were immunostained for PU.1 (white) and Cx3cr1-EGFP (green). (C) Control, non-lesioned area of the spinal cord. (D) Higher magnification view of EAE lesion, showing microglia (closed arrowhead), Cx3Cr1-EGFP; TdTomato(-) potential infiltrating monocytes (open arrowhead), and TdTomato(-); EGFP(-); PU.1 (+) infiltrating myelogenous cells (asterisk). (E) Higher magnification view of a non-lesioned area of the spinal cord. Scale bars = 500 µm (A), 100 µm (B,C), 40 µm (D,E).

References

    1. Abram CL, Roberge GL, Hu Y, Lowell CA. Comparative analysis of the efficiency and specificity of myeloid-Cre deleting strains using ROSA-EYFP reporter mice. Journal of Immunological Methods. 2014;408:89–100. doi: 10.1016/j.jim.2014.05.009. - DOI - PMC - PubMed
    1. Álvarez-Aznar A, Martínez-Corral I, Daubel N, Betsholtz C, Mäkinen T, Gaengel K. Tamoxifen-independent recombination of reporter genes limits lineage tracing and mosaic analysis using CreERT2 lines. Transgenic Research. 2020;29:53–68. doi: 10.1007/s11248-019-00177-8. - DOI - PMC - PubMed
    1. Arnold TD, Lizama CO, Cautivo KM, Santander N, Lin L, Qiu H, Huang EJ, Liu C, Mukouyama YS, Reichardt LF, Zovein AC, Sheppard D. Impaired αvβ8 and tgfβ signaling lead to microglial dysmaturation and neuromotor dysfunction. Journal of Experimental Medicine. 2019;216:900–915. doi: 10.1084/jem.20181290. - DOI - PMC - PubMed
    1. Bar-On L, Birnberg T, Lewis KL, Edelson BT, Bruder D, Hildner K, Buer J, Murphy KM, Reizis B, Jung S. CX3CR1+ CD8alpha+ dendritic cells are a steady-state population related to plasmacytoid dendritic cells. PNAS. 2010;107:14745–14750. doi: 10.1073/pnas.1001562107. - DOI - PMC - PubMed
    1. Bebo BF, Dehghani B, Foster S, Kurniawan A, Lopez FJ, Sherman LS. Treatment with selective estrogen receptor modulators regulates myelin specific T-cells and suppresses experimental autoimmune encephalomyelitis. Glia. 2009;57:777–790. doi: 10.1002/glia.20805. - DOI - PMC - PubMed

Publication types

Substances

Associated data