. 2020 Jun 23:9:e56185.
doi: 10.7554/eLife.56185.

Moyamoya disease factor RNF213 is a giant E3 ligase with a dynein-like core and a distinct ubiquitin-transfer mechanism

Affiliations

Moyamoya disease factor RNF213 is a giant E3 ligase with a dynein-like core and a distinct ubiquitin-transfer mechanism

Juraj Ahel et al. Elife. .

Abstract

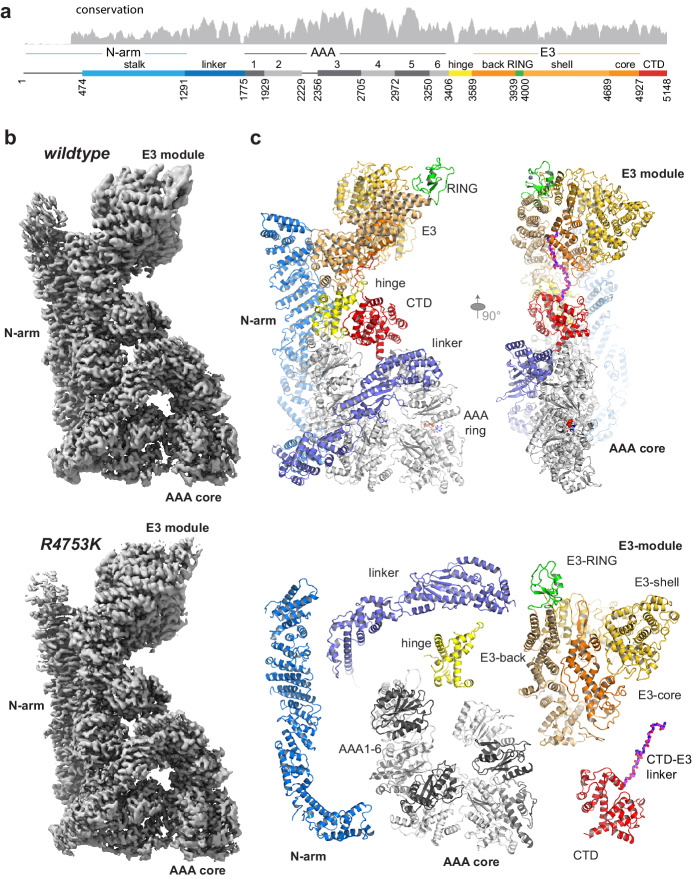
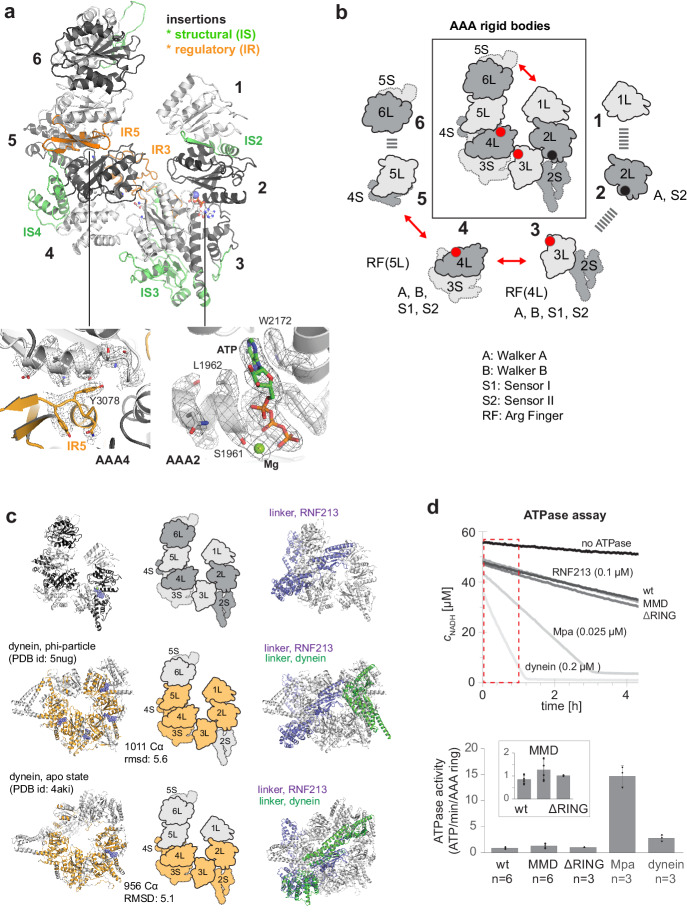
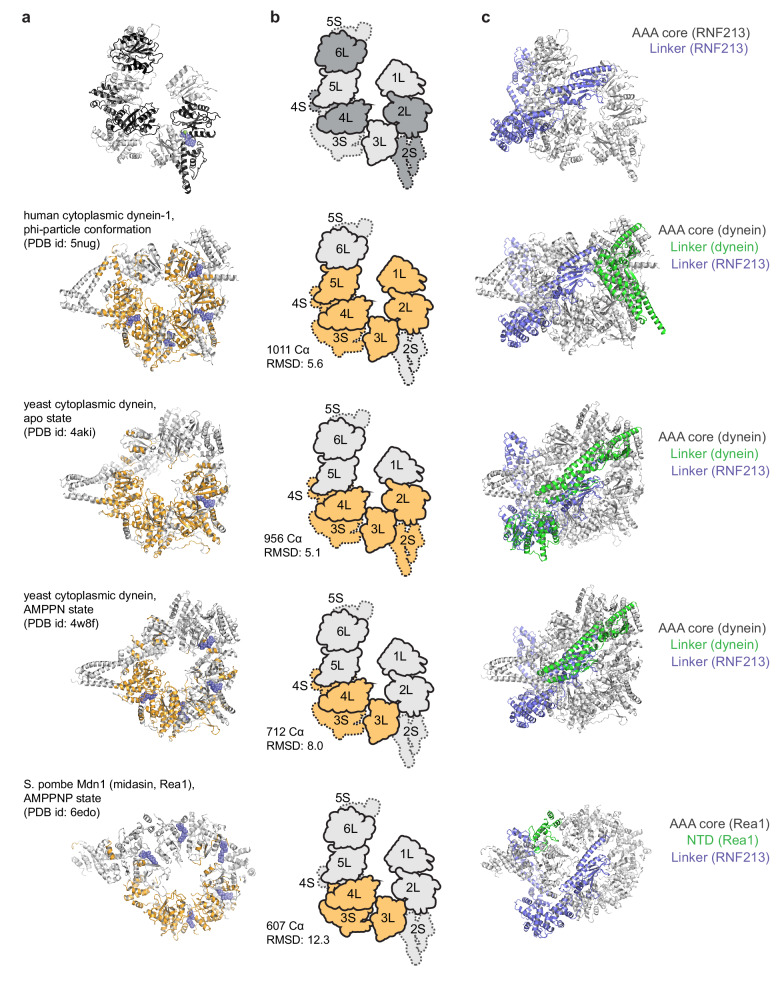
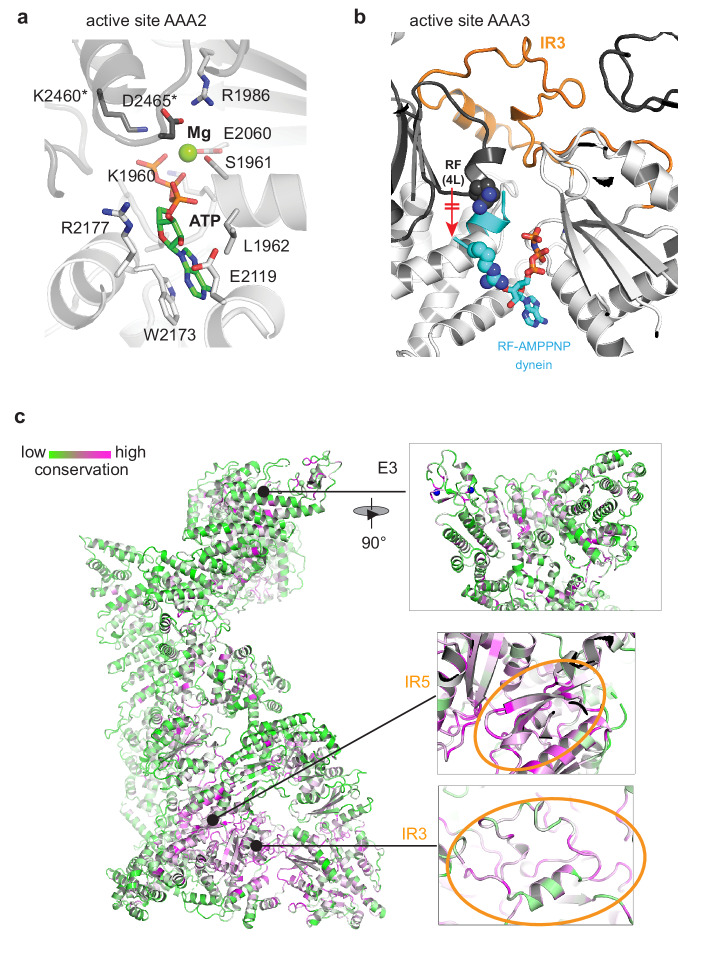
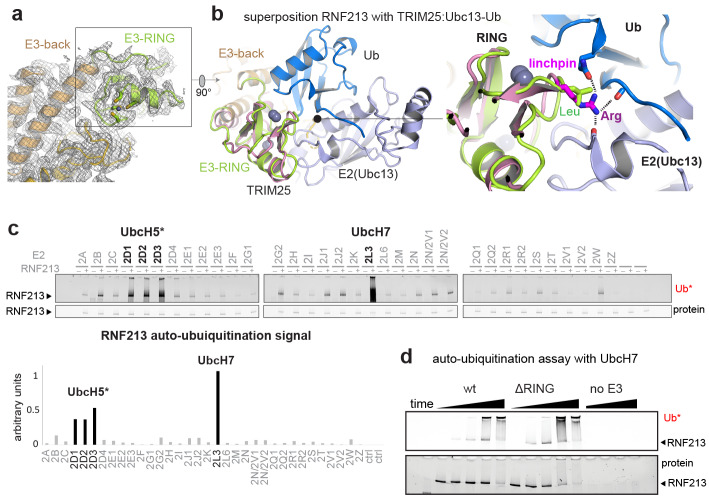
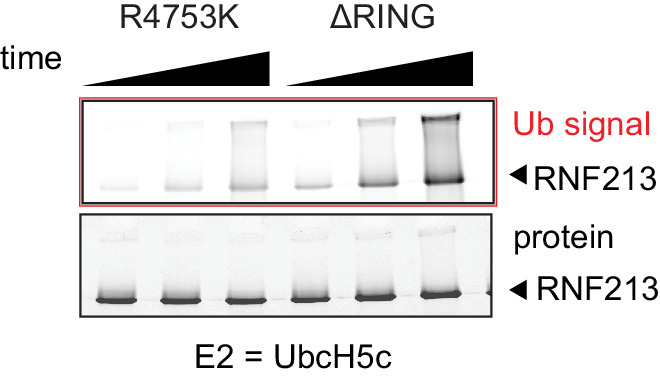
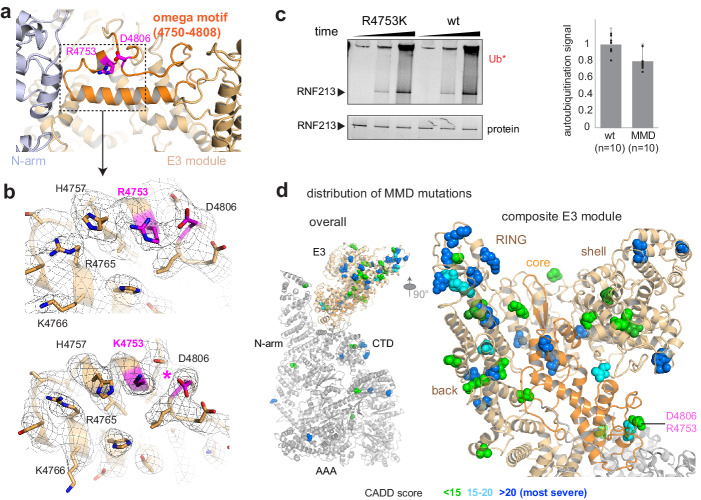
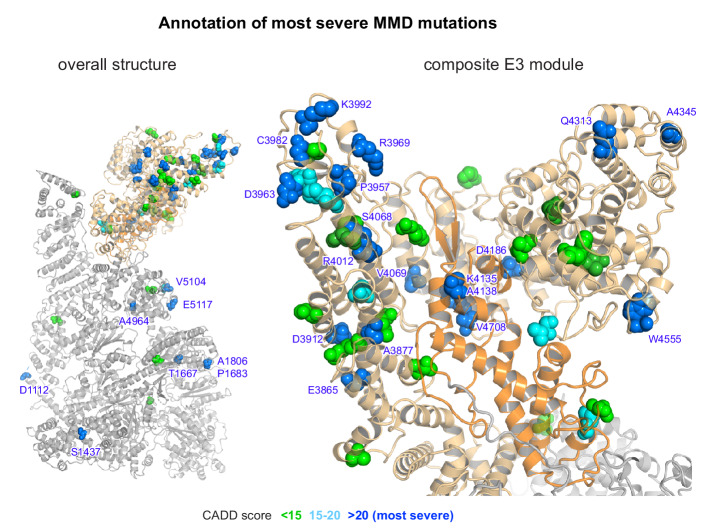
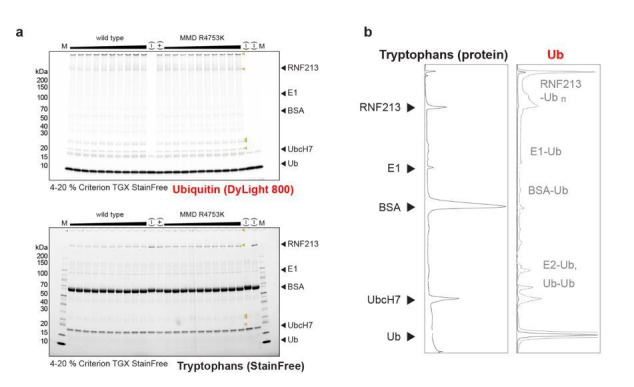
RNF213 is the major susceptibility factor for Moyamoya disease, a progressive cerebrovascular disorder that often leads to brain stroke in adults and children. Characterization of disease-associated mutations has been complicated by the enormous size of RNF213. Here, we present the cryo-EM structure of mouse RNF213. The structure reveals the intricate fold of the 584 kDa protein, comprising an N-terminal stalk, a dynein-like core with six ATPase units, and a multidomain E3 module. Collaboration with UbcH7, a cysteine-reactive E2, points to an unexplored ubiquitin-transfer mechanism that proceeds in a RING-independent manner. Moreover, we show that pathologic MMD mutations cluster in the composite E3 domain, likely interfering with substrate ubiquitination. In conclusion, the structure of RNF213 uncovers a distinct type of an E3 enzyme, highlighting the growing mechanistic diversity in ubiquitination cascades. Our results also provide the molecular framework for investigating the emerging role of RNF213 in lipid metabolism, hypoxia, and angiogenesis.

Keywords: biochemistry; cerebrovascular disorder; chemical biology; human; molecular biophysics; molecular machines; mouse; protein quality control; protein ubiquitination; rare disease; structural biology.

Plain language summary

Moyamoya disease is a genetic disorder affecting both adults and children. It is characterized by narrowing of the blood vessels in the brain, which can lead to strokes. Moyamoya patients often have mutations in the gene for a protein called RNF213. This protein is linked to multiple processes in the body, including the development of blood vessels. Despite this, its role in Moyamoya disease is still something of a mystery. RNF213 is known to fall into two protein ‘classes’. First, it is an E3 enzyme. This type of protein tags unwanted or defective proteins for disposal by the cell. Second, it is a motor protein. Motor proteins contain tiny molecular ‘engines’, called ATPases, that normally convert chemical energy to movement. No other human protein combines these two activities, making RNF213 unique. RNF213 is also an extremely large protein, which means it is difficult to manipulate in the laboratory and thus hard to study. Scientists still need more detailed information on RNF213’s structure and chemical activity before we can understand what the mutant protein might be doing in Moyamoya disease. Ahel et al. therefore set out to make the RNF213 protein and ‘dissect’ it in a test tube. Electron microscopy experiments using the mouse-version of RNF213 revealed that it consisted of a single, giant molecule, folded up to form three regions with distinct structures. These were a long ‘arm’ at one end, a ring-shaped part in the middle, containing the ATPase ‘motor’, and the E3 enzyme module at the other end. Further chemical analysis showed that RNF213’s ATPase and E3 modules worked in unexpected ways. Although the ATPase did resemble another well-known motor protein, in RNF213 it did not generate movement but rather appeared to act like an intricate molecular ‘switch’. The E3 module of RNF213 ‘tagged’ other molecules as expected but did not contain an additional structure that all other known E3 enzymes need to work properly. This suggests that RNF213 represents a distinct class of E3 enzymes. Biochemical tests of the mutation most commonly found in Moyamoya patients revealed that it left RNF213’s overall structure, ATPase motor and E3 module intact. That is, the disease-causing mutation appeared to hinder interactions with other partner proteins, rather than disrupting RNF213 itself. By providing the first detailed molecular description of the architecture of RNF213, Ahel et al. hope that these findings will help future investigations of both this giant protein’s biological role in the cell and its contribution to Moyamoya disease.


Conflict of interest statement

JA, AL, AV, AS, AM, DH, TC No competing interests declared

Figures

Figure 1.
Figure 1.. Overall structure of the AAA-E3 ligase RNF213.
(a) Conservation and domain organization of RNF213. (b) Composite cryo-EM maps of wt and R4753K RNF213 resulting from focused refinements. (c) Architecture of RNF213, shown in orthogonal views (top row; first view matches orientation of panel b), illustrated as ribbon model using a domain-based color mode similar as in (a). The lower panel depicts the collection of dissected RNF213 domains.
Figure 1—figure supplement 1.
Figure 1—figure supplement 1.. In silico and in vitro characterization of RNF213.
(a) Prediction of folded (green, above the axis) and disordered (red, below the axis) regions. The prediction is based on the FoldIndex score. (b, c) Dynamic light scattering (DLS) and size exclusion chromatography (SEC) analysis of the purified protein used for structural and biochemical analysis. The SDS-PAGE gel highlights the purity of the sample.
Figure 1—figure supplement 2.
Figure 1—figure supplement 2.. Cryo-EM analysis of RNF213.
(a) Cryo-EM analysis of wt RNF213 showing a representative micrograph, (b) highest populated class averages, (c) angular distribution of individual wt particles, (d) Fourier Shell Correlation curve of the refined map showing a resolution of 3.2 Å and (e) local resolution map. (f) Cryo-EM analysis of R4753K RNF213 mutant showing a representative micrograph, (g) the highest populated class averages, (h) the angular distribution of individual mutant particles, (i) the Fourier Shell Correlation curve of the refined map showing a resolution 3.1 Å and (j) the local resolution map.
Figure 1—figure supplement 3.
Figure 1—figure supplement 3.. Reconstruction of RNF213 cryo-EM densities.
The scheme shows various computational steps that were performed to generate the final EM density maps, which were used to determine the molecular model of wt RNF213. Top: The iterative process leading to the overall EM density is shown. From left to right: 1) generating the initial EM density map, 2) generating the second density map following optimized particle picking guided by the first map, 3) picking additional particles using the projections of the second density map as a reference, and 4) generating the final overall EM density. Bottom: The focus refinement scheme is illustrated, showing both the mask used and the generated density from each refinement. The number of particles included in each step is noted in green. The achieved resolution (resolution cutoff at FSC = 0.143) is indicated below different models.
Figure 1—figure supplement 4.
Figure 1—figure supplement 4.. XL-MS analysis of RNF213.
(a) Ribbon plot of RNF213 with DSS-mediated crosslinks between Lys residues shown as rods. Crosslinks with permitted distances are shown in light blue (0–10 Å) or dark blue (10–30 Å), those with larger distance in lilac. Crosslinker length is calculated with respect to the N-atom of the lysine amino group, or the O-atom the serine, threonine, or tyrosine side chains. (b) Distance distribution of the crosslinks. These data show that the majority of the crosslinks is in the allowed range. (c, d) Corresponding plots but only showing crosslinks between lysine pairs. Here, only a single link did not fulfill distance constrains.
Figure 2.
Figure 2.. AAA core adopts a dynein-like fold.
(a) Organization of the 6 AAA domains, shown in alternating gray tones, highlighting insertions with structural (IS, green) and regulatory (IR, orange) roles. Orientation is similar as in Figure 1c. The insets below illustrate the EM density of the IR5 motif blocking via Tyr3078 nucleotide binding to AAA4 and the ATP molecule tightly bound at AAA2 (also shown in Video 1). (b) Schematic cartoon of the ATPase core emphasizing the AAA ‘rigid bodies’ formed between the L domain of one and the S domain of the previous unit (Wang et al., 2001). The catalytically competent ATPase sites (red dots), the ATP-bound AAA2 (black dot), and the respective functional motifs for ATP binding and hydrolysis are indicated. (c) Structural superposition of RNF213 (top row) with two dynein states (Phi particle, middle; apo dynein, bottom). The left panel illustrates the aligned dynein domains (orange), the middle shows the corresponding cartoon of the matching RNF213 AAA portions, and the right panel highlights the upstream linker of RNF213 (lilac) superimposed with phi-particle and apo dynein structures (AAA core, grey; linker, green). (d) ATPase assay comparing RNF213 variants with dynein and a processive ATPase, the unfoldase Mpa. The top panel illustrates representative NADH decay curves, with used protein concentrations being indicated. The region for calculating reaction rates is highlighted in red. The lower panel quantifies the respective ATPase rates calculated per AAA ring. Rates for tested RNF213 variants are also shown enlarged. Error bars indicate standard deviation.
Figure 2—figure supplement 1.
Figure 2—figure supplement 1.. Structural comparison of RNF213 with dynein-like proteins, containing 6 AAA units in a single polypeptide.
(a) AAA cores of dynein Phi particle, dynein apo state, dynein AMPPNP-bound form, and Rea1, highlighting those residues in orange that could be aligned to RNF213 (top). The rms deviations and number of aligned Cα atoms are indicated. (b) Schematic cartoon of the RNF213 AAA core, emphasizing the aligned AAA units. Accordingly, RNF213 and dynein show the greatest similarity in the AAA2/3/4 part. (c) AAA cores of RNF213, dynein and Rea1 as in panel a) are shown together with their N-terminal linker (green), superimposed with the RNF213 counterpart (lilac). The pictures highlight the similar linker architecture in RNF213 and dynein.
Figure 2—figure supplement 2.
Figure 2—figure supplement 2.. Conservation pattern of RNF213 mapped to the cryo-EM structure.
(a) Atomic model of the AAA2 active site, tightly engaging ATP/Mg. Residues of the adjacent AAA rigid body are marked (*). (b) IR3 stabilizes the inactive state of AAA3 by trapping the arginine finger (RF) in a remote position from the AAA3 active site. For comparison, the aligned RF motif of the dynein AMPPNP structure (PDB ID 4w8f) is shown in cyan together with the bound nucleotide. (c) Conservation pattern of the full-length protein colored according to the degree of sequence conservation from low (green) to high (magenta). This plot illustrates that the core of the AAA ring represents the most highly conserved portion of RNF213. The zoomed-in inserts illustrate the conservation of the central E3 part, where only few functional motifs are conserved including the Zn-coordinating residues of the RING (top), the conservation of the IR5 motif (orange circle) and the conservation of the IR3 motif (orange circle). Notably, for IR3, specifically those residues that extend to the protein interior are conserved, whereas the conservation of surface-exposed residues varies.
Figure 2—figure supplement 3.
Figure 2—figure supplement 3.. Structural comparison of RNF213 and Rea1.
The picture compares the overall organization of the two AAA6 proteins. From the aligned AAA rings, large C-terminal extensions project into the periphery. In case of RNF213, the tilted AAA6 domain guides the C-terminal E3 extension into a different direction aligning it with the N-arm, which is absent in Rea1.
Figure 3.
Figure 3.. E3 ligase function of RNF213.
(a) EM density of the RNF213 RING (green ribbon) and its engaging structural elements in the E3 domain. (b) Superposition with the TRIM25/Ubc13 ~Ub complex (PDB id 5eya; colored in brown, slate, blue, respectively), showing the relative orientation of the three domains in the activated ‘closed’ conformation. Zn2+ ions are shown as spheres. The right panel illustrates the catalytic effect of the Arg linchpin in TRIM25, aligning Ub and Ubc13 (important hydrogen bonds are indicated as dashed lines). The corresponding RNF213 linchpin, Leu3986, cannot undergo such interactions. (c) E2 screen, monitoring RNF213 auto-ubiquitination with various E2 enzymes. The panel below shows the quantification of the RNF213-associated poly-Ub signal, revealing the pronounced E3 activity with UbcH7 relative to the indicated UbcH5 variants. (d) Auto-ubiquitination assay comparing the activities of wt and ΔRING RNF213 in the presence of UbcH7. Equivalent results are seen with UbcH5c (Figure 3—figure supplement 1).
Figure 3—figure supplement 1.
Figure 3—figure supplement 1.. Auto-ubiquitination activity of RNF213 in the presence of UbcH5c.
UbcH5c dependent auto-ubiquitination activity of R4753K MMD and ΔRING mutants. Like the wt protein, both mutants retain E3 activity with UbcH5c.
Figure 4.
Figure 4.. Structural analysis of MMD mutations.
(a) Arg4753 stabilizes the ‘omega’ motif (orange), located in the periphery of the E3 domain. Arg4753 and its partner residue Asp4806 are highlighted. (b) Focused cryo-EM maps of wt (top) and R4753K (bottom), showing that the introduced mutation disrupts the Arg4753-Asp4806 salt bridge (pink), leading to local structural changes. Affected side chains are labelled. (c) Auto-ubiquitination assay with UbcH7 comparing the wt and the R4753K mutant. The bar plot represents the quantification of the poly-ubiquitination signal (Ub*), resulting from ten replicated measurements. Error bars indicate standard deviation. (d) MMD-associated mutations (colored spheres) mapped on the cryo-EM structure of RNF213 cluster in the E3 domain, though separated in sequence by ~1000 residues. The zoomed-in window (right panel) shows that all four portions of the E3 module (core sub-domain shown in orange) carry MMD mutations. Residues are colored by CADD score (0–15 green, 15–20 cyan, 20+ blue; listed in Supplementary file 2). The most pathologic mutations (blue) are individually labeled in Figure 4—figure supplement 1.
Figure 4—figure supplement 1.
Figure 4—figure supplement 1.. Cryo-EM structure of RNF213 with labeled MMD mutations.
For clarity, only the most severe mutations with a CADD score >20 are labeled (blue). The left panel shows the overall structure, the right an enlarged view on the composite E3 module.
Author response image 1.
Author response image 1.. Full gel images used to quantify wt and R4753K RNF213 auto-ubiqitination activity.
(a) The ubiquitin signal (via DyLight 800 label, top panel) and the total protein signal (via tryptophan Stain-Free in-gel labeling, bottom panel) are shown separately. Yellow triangles point to ubiquitinated species. The shallow gradient on top indicates the concentration of RF213 used (80%-120% of the nominal value 0.4 µM). (b) Densitometric plot of the positive control, shown in lane 13:(+). Despite RNF213 being a minor protein component in the mix, the majority of ubiquitin is transfered onto RNF213 rather than on more abundant species like BSA or the E2. For the densitometry of the Ub signal, the saturated signal excluding free ubiquitin is shown in grey.

References

    1. Afonine PV, Poon BK, Read RJ, Sobolev OV, Terwilliger TC, Urzhumtsev A, Adams PD. Real-space refinement in PHENIX for cryo-EM and crystallography. Acta Crystallographica Section D Structural Biology. 2018;74:531–544. doi: 10.1107/S2059798318006551. - DOI - PMC - PubMed
    1. Ahel J. ClausenLab-ViennaBioCenter; 2020. https://github.com/ClausenLab-ViennaBioCenter/CrossLinkingVisualizer
    1. Banh RS, Iorio C, Marcotte R, Xu Y, Cojocari D, Rahman AA, Pawling J, Zhang W, Sinha A, Rose CM, Isasa M, Zhang S, Wu R, Virtanen C, Hitomi T, Habu T, Sidhu SS, Koizumi A, Wilkins SE, Kislinger T, Gygi SP, Schofield CJ, Dennis JW, Wouters BG, Neel BG. PTP1B controls non-mitochondrial oxygen consumption by regulating RNF213 to promote tumour survival during hypoxia. Nature Cell Biology. 2016;18:803–813. doi: 10.1038/ncb3376. - DOI - PMC - PubMed
    1. Barad BA, Echols N, Wang RY, Cheng Y, DiMaio F, Adams PD, Fraser JS. EMRinger: side chain-directed model and map validation for 3D cryo-electron microscopy. Nature Methods. 2015;12:943–946. doi: 10.1038/nmeth.3541. - DOI - PMC - PubMed
    1. Bhabha G, Cheng HC, Zhang N, Moeller A, Liao M, Speir JA, Cheng Y, Vale RD. Allosteric communication in the dynein motor domain. Cell. 2014;159:857–868. doi: 10.1016/j.cell.2014.10.018. - DOI - PMC - PubMed

Publication types

MeSH terms