. 2020 Nov 1;36(17):4649-4654.
doi: 10.1093/bioinformatics/btaa560.

BioModels Parameters: a treasure trove of parameter values from published systems biology models

Affiliations

BioModels Parameters: a treasure trove of parameter values from published systems biology models

Mihai Glont et al. Bioinformatics. .

Abstract

Motivation: One of the major bottlenecks in building systems biology models is identification and estimation of model parameters for model calibration. Searching for model parameters from published literature and models is an essential, yet laborious task.

Results: We have developed a new service, BioModels Parameters, to facilitate search and retrieval of parameter values from the Systems Biology Markup Language models stored in BioModels. Modellers can now directly search for a model entity (e.g. a protein or drug) to retrieve the rate equations describing it; the associated parameter values (e.g. degradation rate, production rate, Kcat, Michaelis-Menten constant, etc.) and the initial concentrations. Currently, BioModels Parameters contains entries from over 84,000 reactions and 60 different taxa with cross-references. The retrieved rate equations and parameters can be used for scanning parameter ranges, model fitting and model extension. Thus, BioModels Parameters will be a valuable service for systems biology modellers.

Availability and implementation: The data are accessible via web interface and API. BioModels Parameters is free to use and is publicly available at https://www.ebi.ac.uk/biomodels/parameterSearch.

Supplementary information: Supplementary data are available at Bioinformatics online.


Figures

Fig. 1.
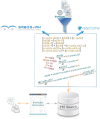
Fig. 1.
Graphical representation of the methodology employed in this work
Fig. 2.
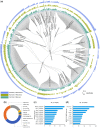
Fig. 2.
Content statistics for curated models. (a) Distribution of biological entities, reactions and parameters available in the BioModels Parameter search grouped by the biological process of the curated model they are defined in. The classification has been created using GO terms from the model level annotation. The end nodes of the dendrogram are individual models. The Y axis of the bar plots is represented in logarithmic scale. (b) Doughnut-chart illustrating the biological entity cross-references in the BioModels Parameter search grouped by the originating biomedical resource. (c) Top 10 UniProt entries referenced by the model entities in the BioModels Parameter search. (d) The 10 most frequent metabolites (from KEGG and ChEBI) cross-referenced in the BioModels Parameter search
Fig. 3.
Fig. 3.
Screenshot of the BioModels Parameter search landing page. Users can view the parameters for every biological entity participating in a reaction defined by a kinetic model hosted in BioModels
Fig. 4.
Fig. 4.
Use cases to demonstrate applications of BioModels Parameters (a) Entities concentration range: assessing the effect of various concentrations of TF (0.005–300 nM) on thrombin activation studied in BIOMD0000000332. (b) Parameter value range: assessing the effect of various Km (10–1 007 340 µM) on double phosphorylation of ERK by MEK, studied in BIOMD0000000010. (c) Model extension: a new model MODEL1911140002 was constructed by extending the TNF-NFkB model BIOMD0000000786 (Lipniacki et al., 2004, blue) from BioModels to study the cross-talk between ROS and NFkB signalling and incorporating new components from BioModels Parameters [extracted from BIOMD0000000560 (Hui et al., 2016, green)]. A subset of model pathway (left), simulation of TNF-induced SOD production (middle) and ROS-induced A20 production (right). Simulation conditions are same as the parent models and only indicated changes in entity concentration and model parameter are scanned. The COPASI representation of the models and their simulation experiment description (SED-ML) files for (a) and (b) that can be used to reproduce the figures are attached as Supplementary Information

References

    1. Aldridge B.B. et al. (2006) Physicochemical modelling of cell signalling pathways. Nat. Cell Biol., 8, 1195–1203. - PubMed
    1. Bornstein B.J. et al. (2008) LibSBML: an API Library for SBML. Bioinformatics, 24, 880–881. - PMC - PubMed
    1. Bungay S.D. et al. (2006) Modelling thrombin generation in human ovarian follicular fluid. Bull. Math. Biol., 68, 2283–2302. - PubMed
    1. Fabregat A. et al. (2018) The Reactome pathway knowledgebase. Nucleic Acids Res., 46, D649–D655. - PMC - PubMed
    1. Hoops S. et al. (2006) COPASI—a COmplex PAthway SImulator. Bioinformatics, 22, 3067–3074. - PubMed

Publication types