. 2020 Oct 15;136(16):1851-1862.
doi: 10.1182/blood.2019004229.

Molecular landscape and clonal architecture of adult myelodysplastic/myeloproliferative neoplasms

Affiliations

Molecular landscape and clonal architecture of adult myelodysplastic/myeloproliferative neoplasms

Laura Palomo et al. Blood. .

Abstract

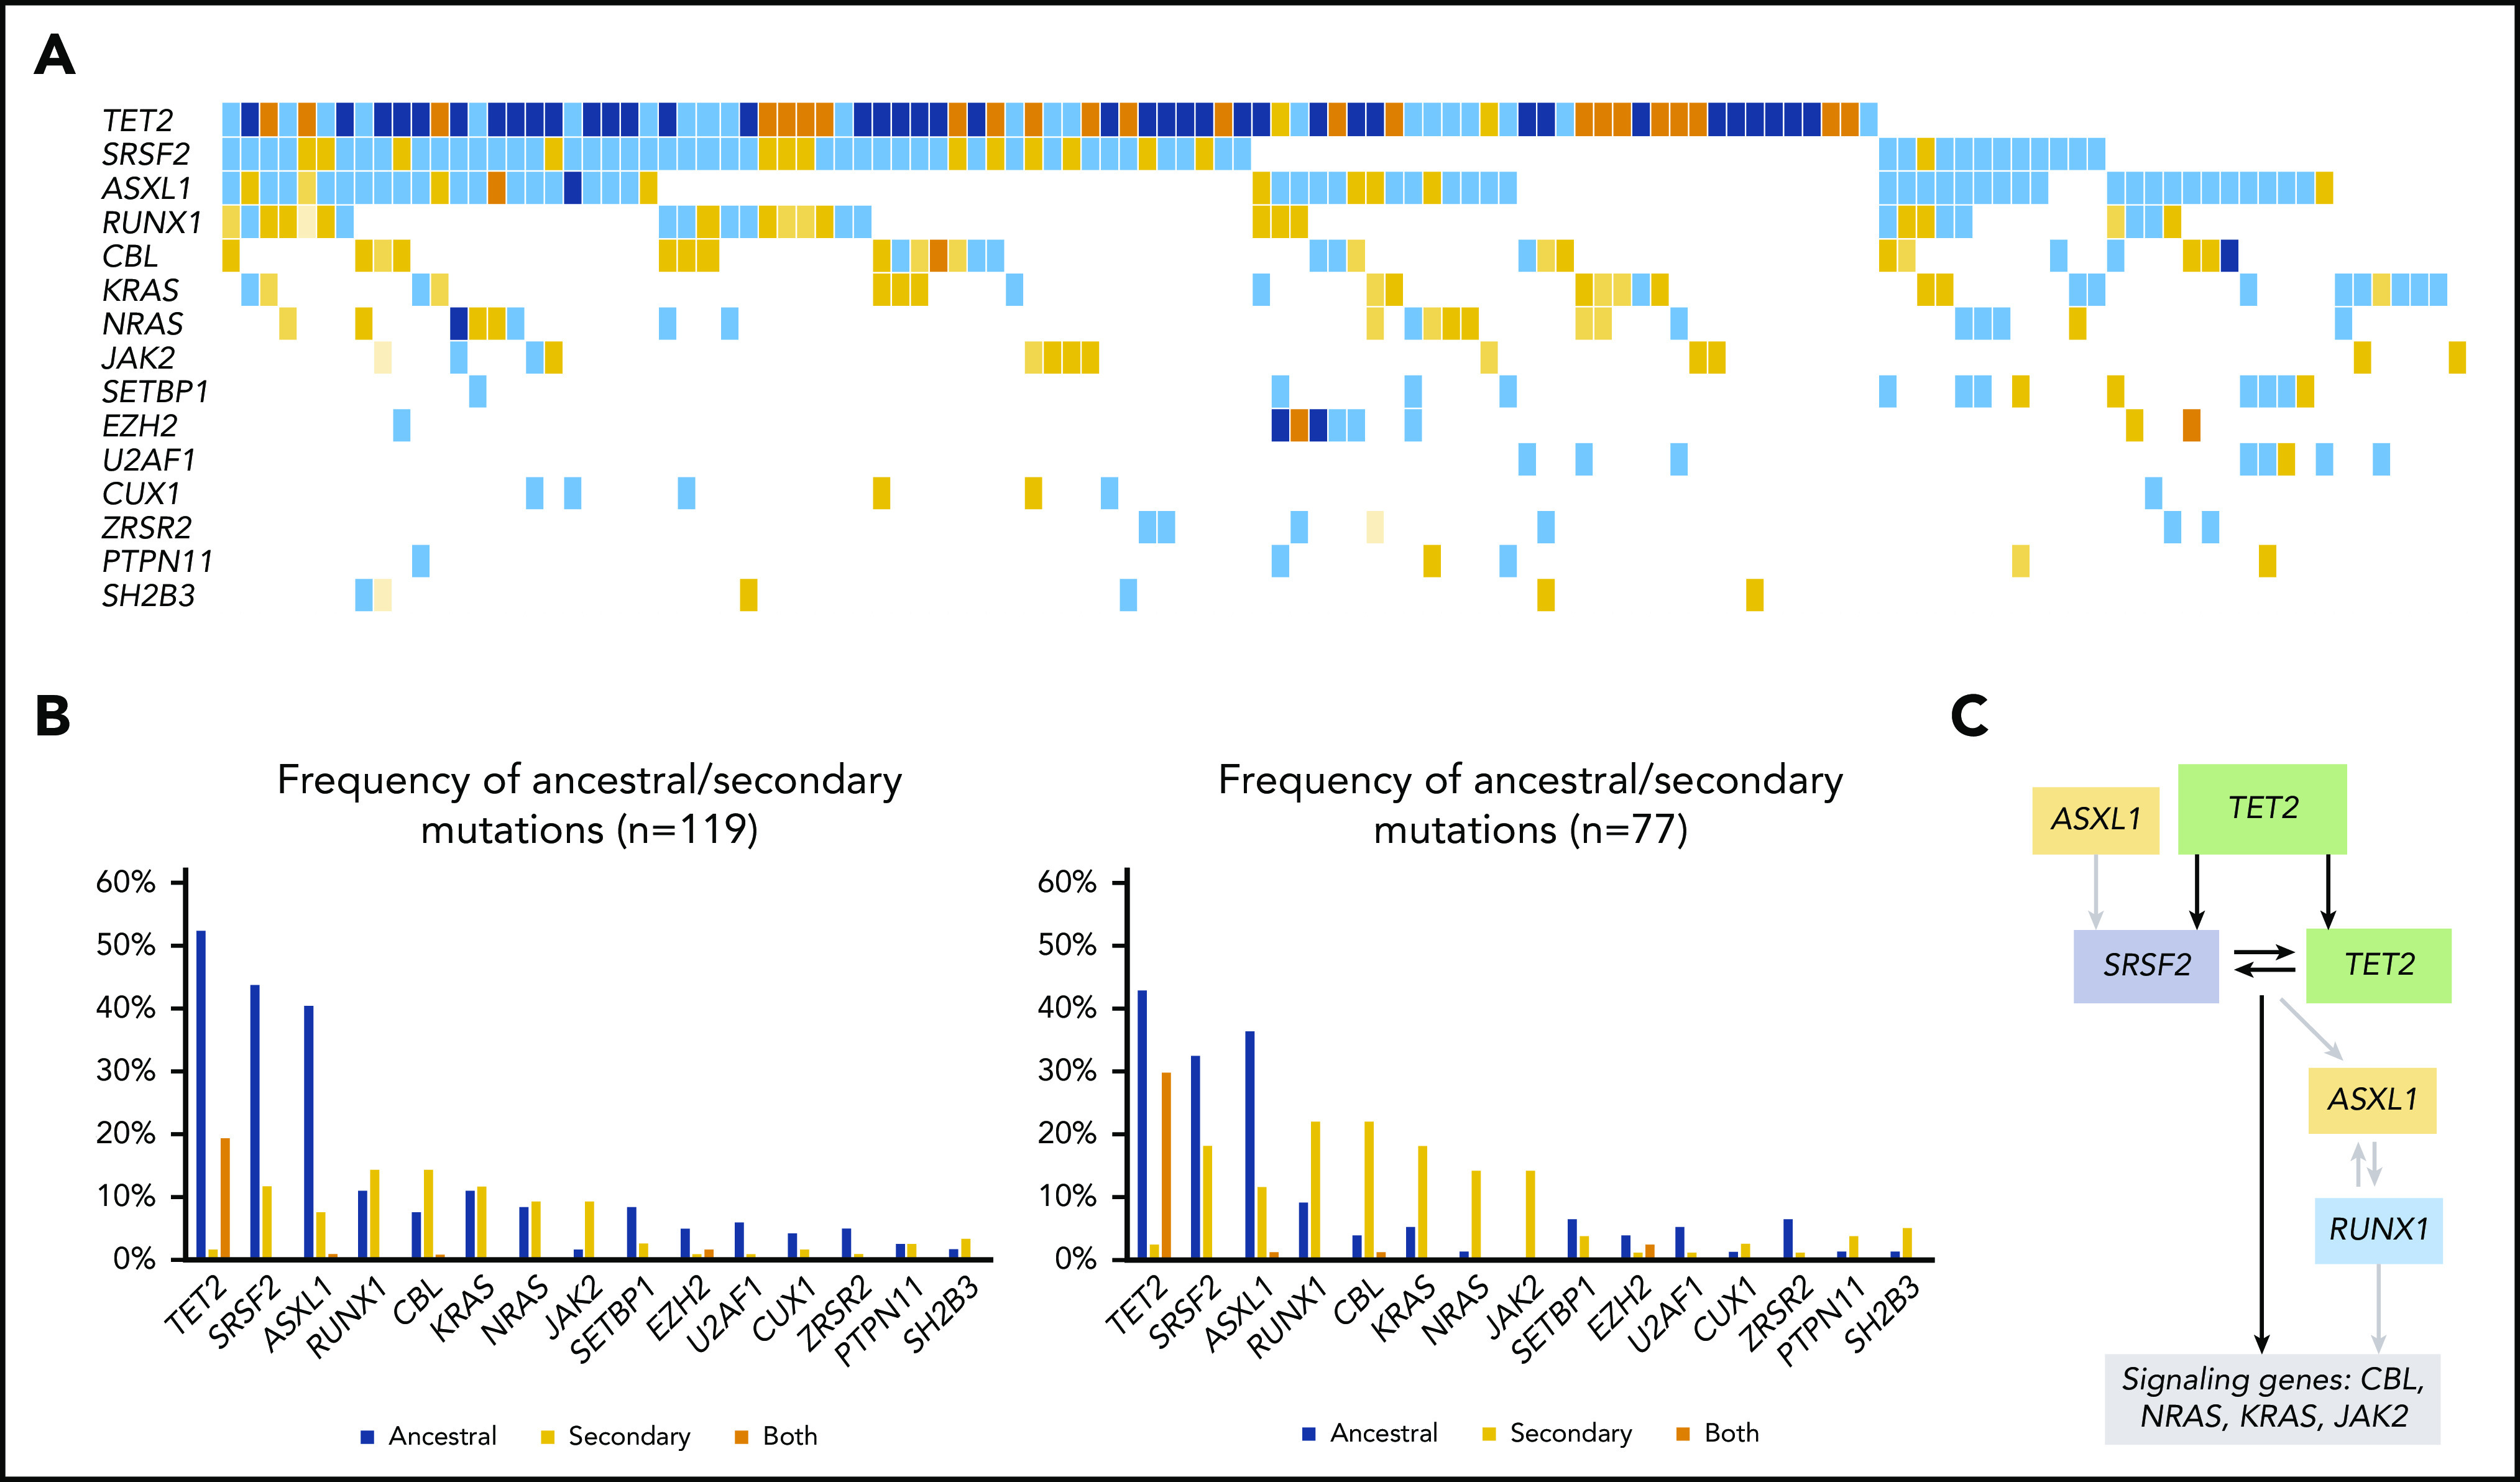
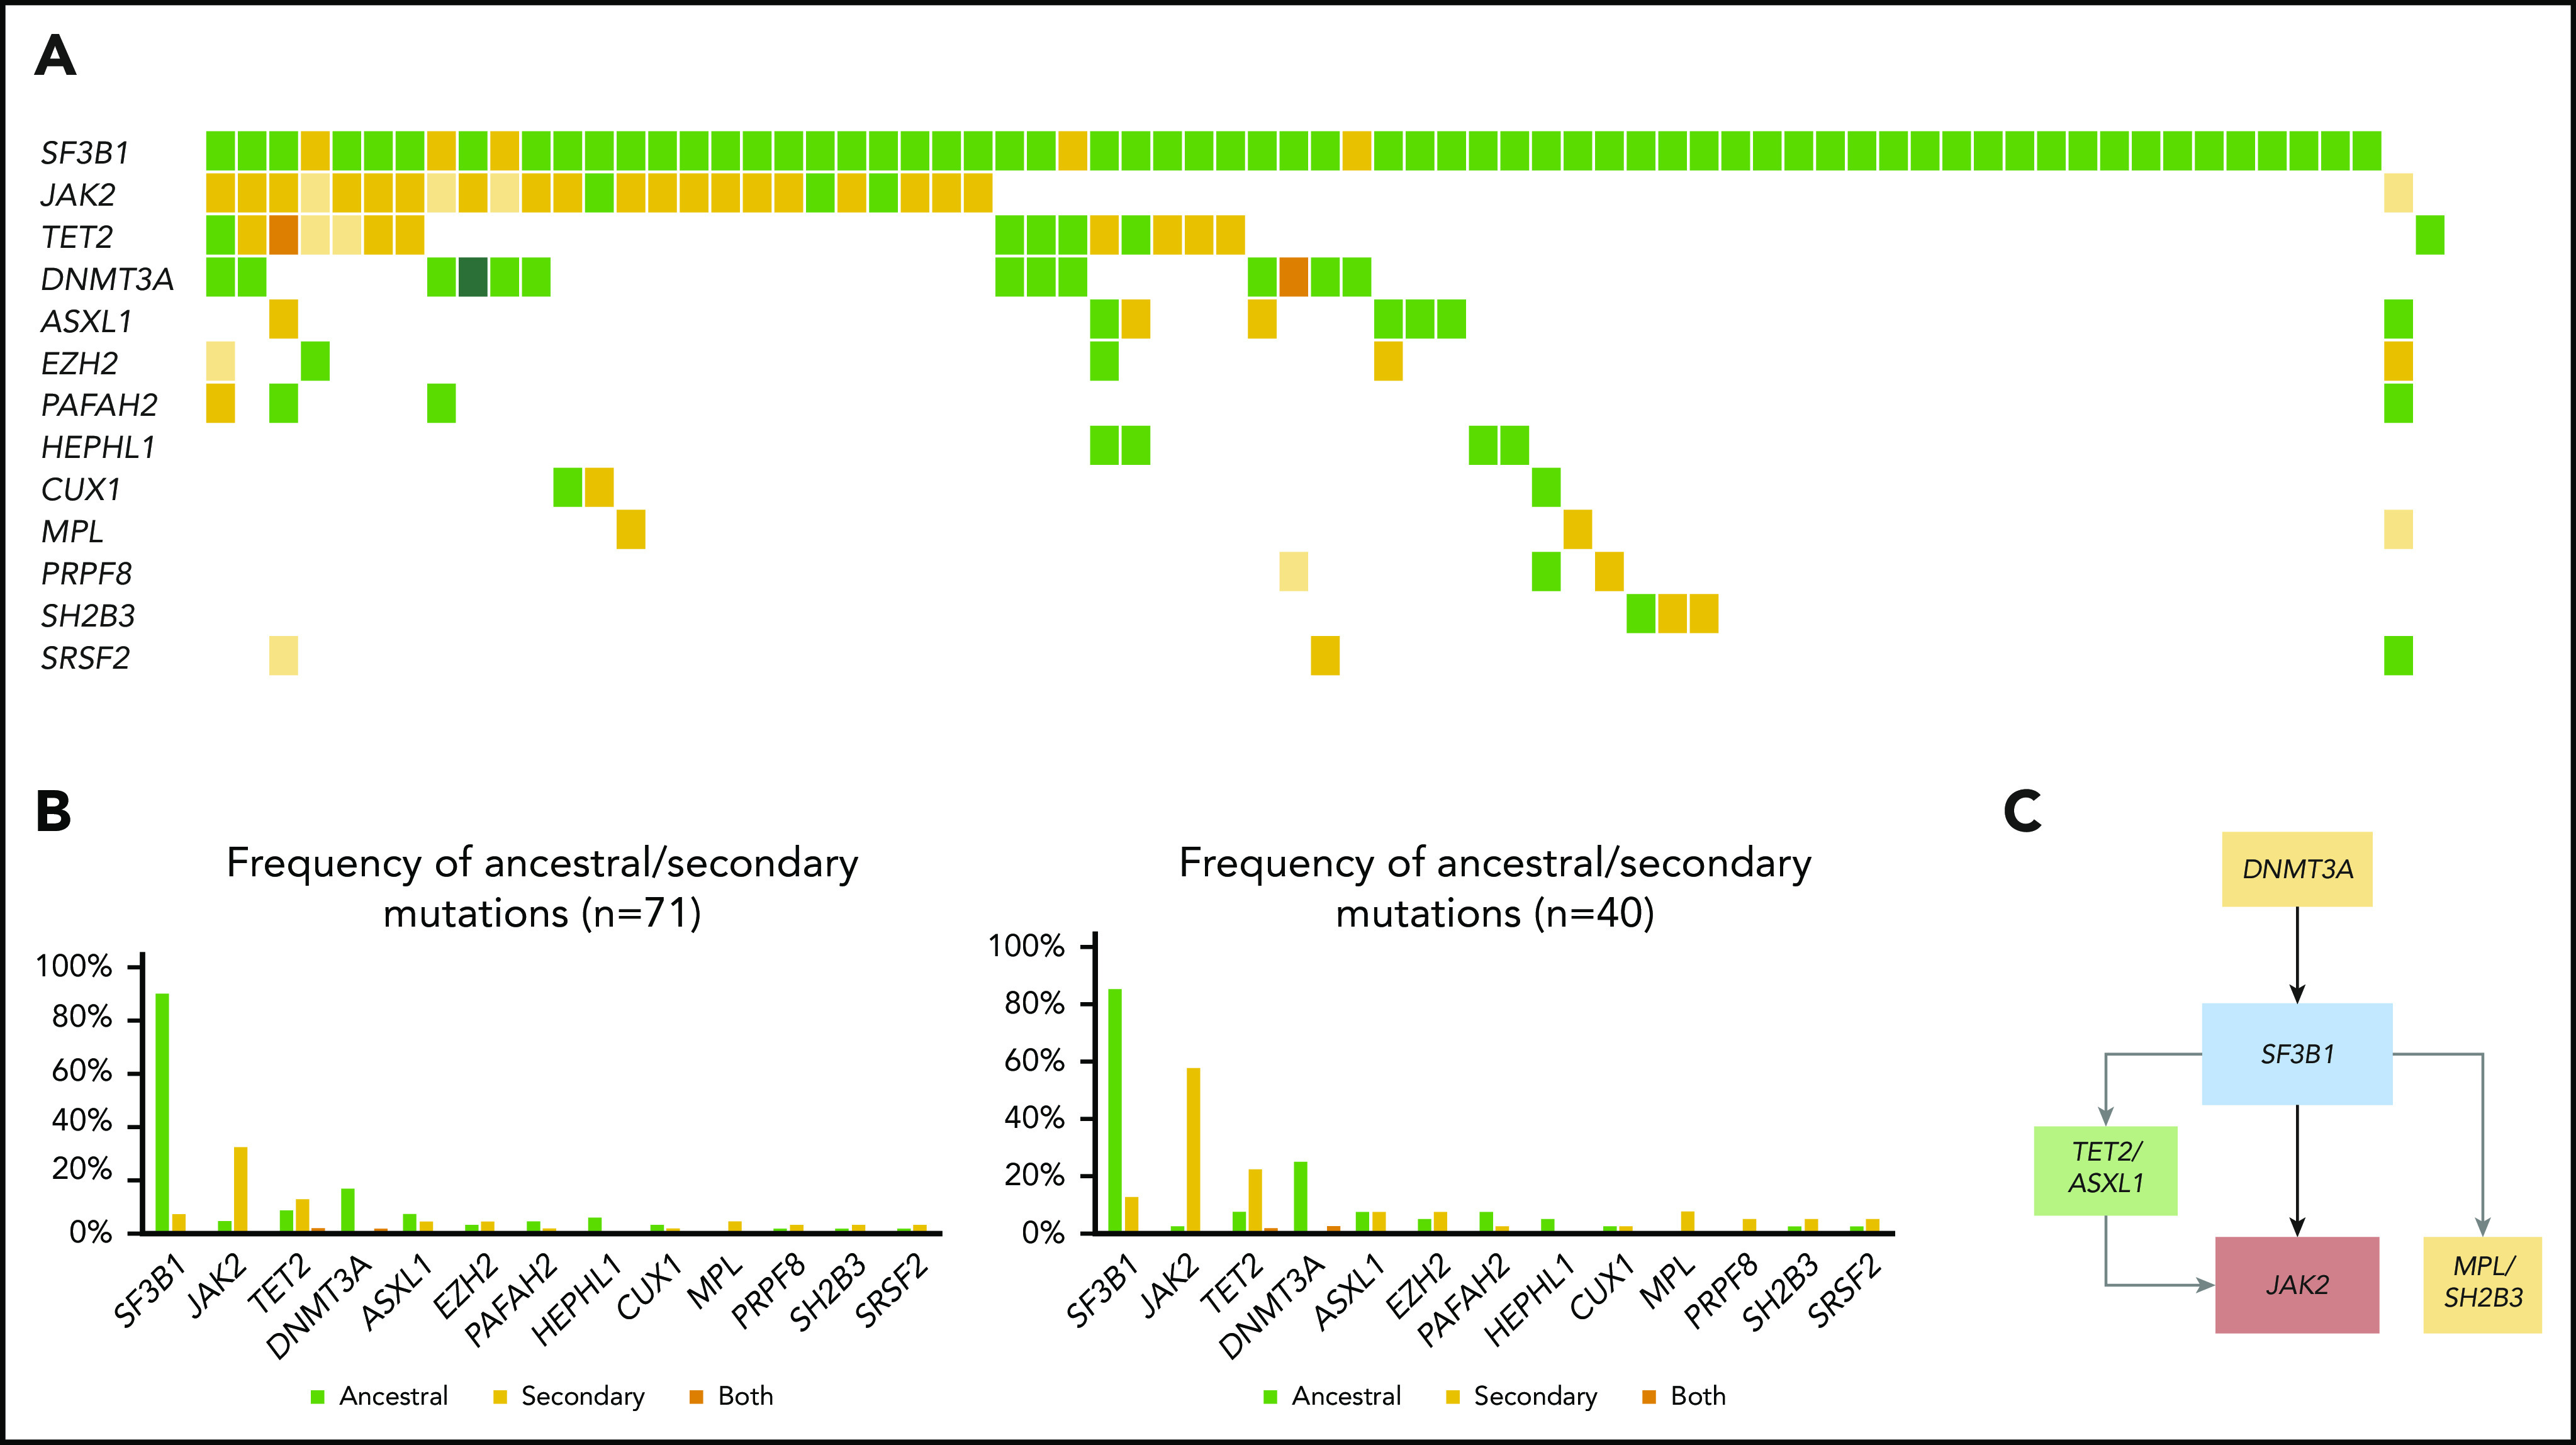
More than 90% of patients with myelodysplastic/myeloproliferative neoplasms (MDSs/MPNs) harbor somatic mutations in myeloid-related genes, but still, current diagnostic criteria do not include molecular data. We performed genome-wide sequencing techniques to characterize the mutational landscape of a large and clinically well-characterized cohort including 367 adults with MDS/MPN subtypes, including chronic myelomonocytic leukemia (CMML; n = 119), atypical chronic myeloid leukemia (aCML; n = 71), MDS/MPN with ring sideroblasts and thrombocytosis (MDS/MPN-RS-T; n = 71), and MDS/MPN unclassifiable (MDS/MPN-U; n = 106). A total of 30 genes were recurrently mutated in ≥3% of the cohort. Distribution of recurrently mutated genes and clonal architecture differed among MDS/MPN subtypes. Statistical analysis revealed significant correlations between recurrently mutated genes, as well as genotype-phenotype associations. We identified specific gene combinations that were associated with distinct MDS/MPN subtypes and that were mutually exclusive with most of the other MDSs/MPNs (eg, TET2-SRSF2 in CMML, ASXL1-SETBP1 in aCML, and SF3B1-JAK2 in MDS/MPN-RS-T). Patients with MDS/MPN-U were the most heterogeneous and displayed different molecular profiles that mimicked the ones observed in other MDS/MPN subtypes and that had an impact on the outcome of the patients. Specific gene mutations also had an impact on the outcome of the different MDS/MPN subtypes, which may be relevant for clinical decision-making. Overall, the results of this study help to elucidate the heterogeneity found in these neoplasms, which can be of use in the clinical setting of MDS/MPN.


Conflict of interest statement

Conflict-of-interest disclosure: T.H., C.H., and W.K. are part owners of MLL Munich Leukemia Laboratory. M.M., S.H., S.T., and I.F. are employed by MLL. The remaining authors declare no competing financial interests.

Figures

None
Graphical abstract
Figure 1.
Figure 1.
Recurrent gene mutations in MDS/MPN. (A) Distribution of adjusted VAFs across recurrently mutated genes individually (left) or grouped according to their functional category (right). The median-adjusted VAF of signaling genes was significantly lower than that of epigenetic regulators (P < .0001), splicing factors (P < .0001), transcription factors (0.0007), and other genes (P < .0001). The median-adjusted VAF of transcription factors was significantly lower than those of the epigenetic regulators (P < .0001) and splicing factors (P < .0001). (B) Bar plot showing the frequency of recurrently mutated genes among the different MDS/MPN subtypes.
Figure 2.
Figure 2.
Genotype-phenotype correlations. (A) Pairwise associations among recurrently mutated genes and cytogenetic abnormalities. Significant associations (adjusted P-value q < .05) are colored coded by odds ratio, where red depicts mutually exclusive gene pairs and green depicts gene pairs that are comutated more than expected by chance. Gene names are color coded according to their functional category. (B) Pairwise associations among recurrently mutated genes and hematological parameters. Significant associations (adjusted P-value q < .05) are colored by odds ratio, where green represents genotype-phenotype–positive associations and reds depict negative associations. NK, normal karyotype.
Figure 3.
Figure 3.
Molecular landscape and clonal architecture of CMML. (A) Oncoplot showing recurrently mutated genes and ancestry in CMML: blue depicts ancestral mutations (darker blue represents cases with 2 ancestral mutations in the same gene, mainly corresponding to biallelic TET2 mutations); yellow depicts secondary mutations and the intensity of the shade indicates the size of the VAF, where darker yellow represents mutations with higher VAFs that have probably been acquired earlier; orange depicts cases with 2 mutations in the same gene in which 1 mutation is ancestral and the other is secondary (mainly corresponding to biallelic TET2 mutations). (B) Frequency of ancestral/secondary mutations per gene in all patients with CMML (n = 1191; left) and in patients who present with at least 2 different clones (n = 77; right). (C) The clonal architecture of CMML. Black arrows depict most common events; gray arrows depict events that are recurrent but occur less frequently.
Figure 4.
Figure 4.
Molecular landscape and clonal architecture of aCML. (A) Oncoplot showing recurrently mutated genes and ancestry in aCML: pink depicts ancestral mutations (darker pink represents cases with 2 ancestral mutations in the same gene); yellow depicts secondary mutations, and the intensity of the shade indicates the size of the VAF (darker yellow represents mutations with higher VAFs that have probably been acquired earlier); purple depicts cases with 2 mutations in the same gene in which 1 mutation is ancestral and the other is secondary. (B) Frequency of ancestral/secondary mutations per gene in all patients with aCML (n = 71; left) and in patients who present with at least 2 different clones (n = 49; right). (C) The clonal architecture of aCML. Black arrows depict most common events; gray arrows depict events that are recurrent but occur less frequently.
Figure 5.
Figure 5.
Molecular landscape and clonal architecture of MDS/MPN-RS-T. (A) Oncoplot showing recurrently mutated genes and ancestry in MDS/MPN-RS-T: green depicts ancestral mutations (darker green represents cases with 2 ancestral mutations in the same gene); yellow depicts secondary mutations, and the intensity of the shade indicates the size of the VAF, where darker yellow represents mutations with higher VAF which have probably been acquired earlier; orange depicts cases with 2 mutations in the same gene, where 1 mutation is ancestral and the other is secondary. (B) Frequency of ancestral/secondary mutations per gene in all patients with MDS/MPN-RS-T (n = 71; left) and in patients who present with at least 2 different clones (n = 4; right). (C) The clonal architecture of MDS/MPN-RS-T. Black arrows depict most common events; gray arrows depict events that are recurrent but occur less frequently.
Figure 6.
Figure 6.
Molecular signatures in MDS/MPN. (A) Associations among MDS/MPN subtypes and specific gene combinations. Significant associations (adjusted P-value q < 0.05) are colored by odds ratio, where green depicts positive associations and red depicts negative associations. Gene combinations were used to classify cases of MDS/MPN-U according to molecular profile: CMML-, aCML-, and MDS/MPN-RS-T–like. (B) The proportion of MDS/MPN-U cases, classified according to the molecular profile. (C) Kaplan Meier curves showing the overall survival of MDS/MPN-U molecular subtypes.
Figure 7.
Figure 7.
Molecular landscape and clonal architecture of MDS/MPN-U. (A) Oncoplot showing recurrently mutated genes and ancestry in MDS/MPN-U: gray depicts ancestral mutations (darker gray represents cases with 2 ancestral mutations in the same gene); yellow depicts secondary mutations, and the intensity of the shade indicates the size of the VAF, where darker yellow represents mutations with higher VAFs that probably have been acquired earlier; orange depicts cases with 2 mutations in the same gene, where 1 mutation is ancestral and the other is secondary. Patients are divided according to their molecular subtype (top of the barplot). (B) Frequency of ancestral/secondary mutations per gene in all patients with MDS/MPN-U (n = 106; left) and in those who present with at least 2 different clones (n = 65; right).

Comment in

References

    1. Swerdlow SH, Campo E, Harris NL, et al. . WHO classification of tumours of haematopoietic and lymphoid tissues. Lyon, France: IARC; 2017.
    1. Itzykson R, Kosmider O, Renneville A, et al. . Prognostic score including gene mutations in chronic myelomonocytic leukemia. J Clin Oncol. 2013;31(19):2428-2436. - PubMed
    1. Jeromin S, Haferlach T, Weissmann S, et al. . Refractory anemia with ring sideroblasts and marked thrombocytosis cases harbor mutations in SF3B1 or other spliceosome genes accompanied by JAK2V617F and ASXL1 mutations. Haematologica. 2015;100(4):e125-e127. - PMC - PubMed
    1. Patnaik MM, Barraco D, Lasho TL, et al. . Targeted next generation sequencing and identification of risk factors in World Health Organization defined atypical chronic myeloid leukemia. Am J Hematol. 2017;92(6):542-548. - PMC - PubMed
    1. Bose P, Nazha A, Komrokji RS, et al. . Mutational landscape of myelodysplastic/myeloproliferative neoplasm-unclassifiable. Blood. 2018;132(19):2100-2103. - PMC - PubMed

Publication types

MeSH terms