. 2020 Sep 7;217(9):e20191430.
doi: 10.1084/jem.20191430.

Neuronal interleukin-1 receptors mediate pain in chronic inflammatory diseases

Affiliations

Neuronal interleukin-1 receptors mediate pain in chronic inflammatory diseases

Benoit Mailhot et al. J Exp Med. .

Abstract

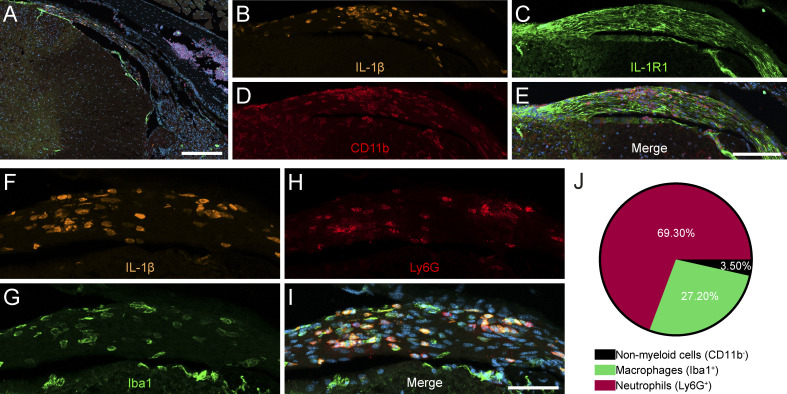
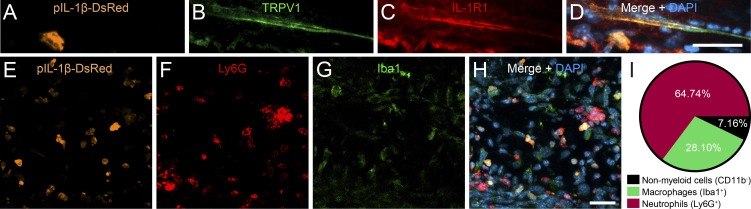
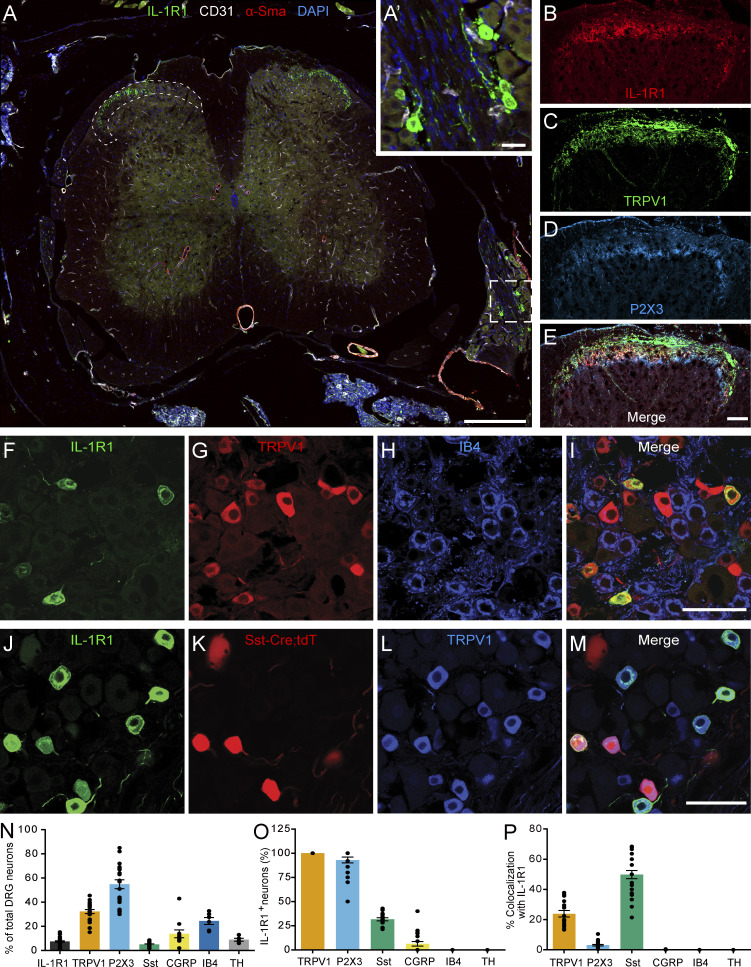
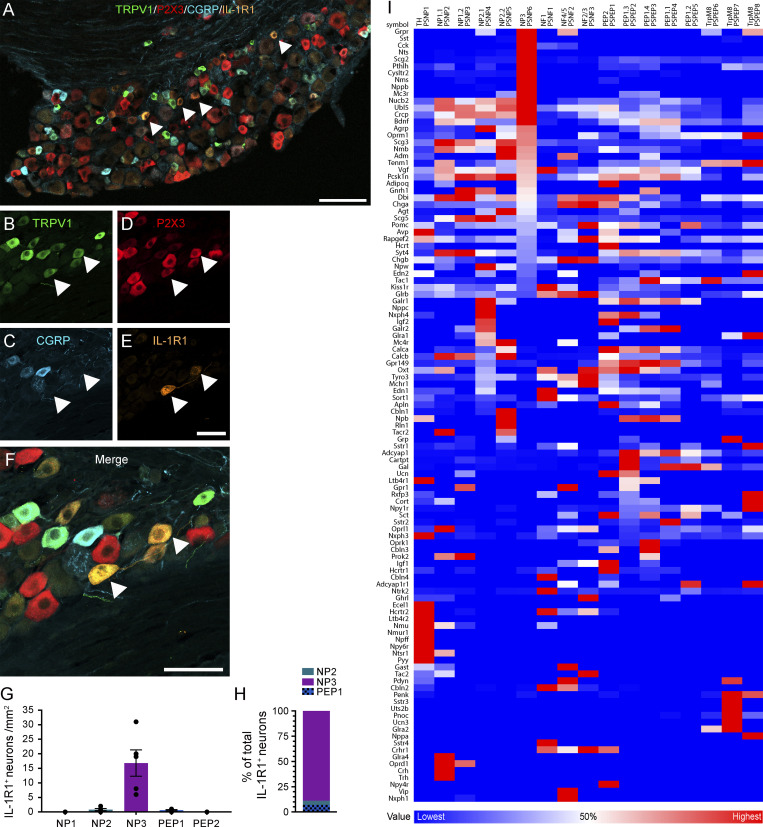
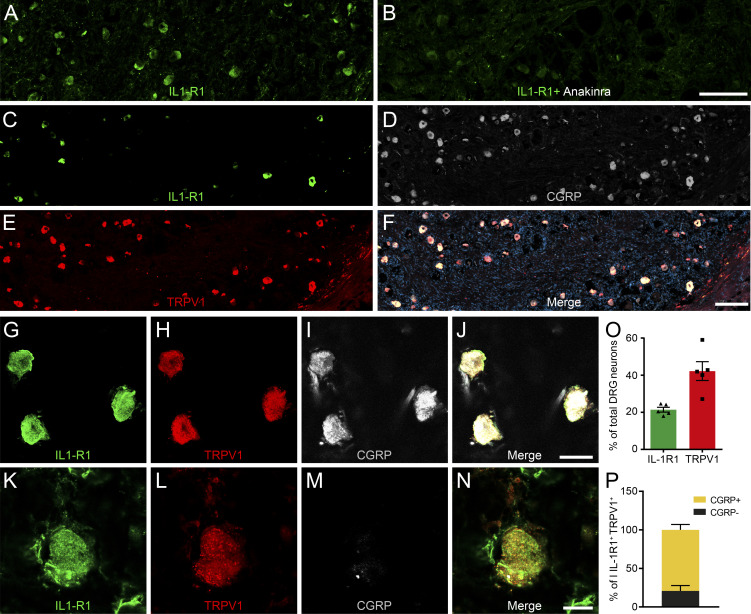
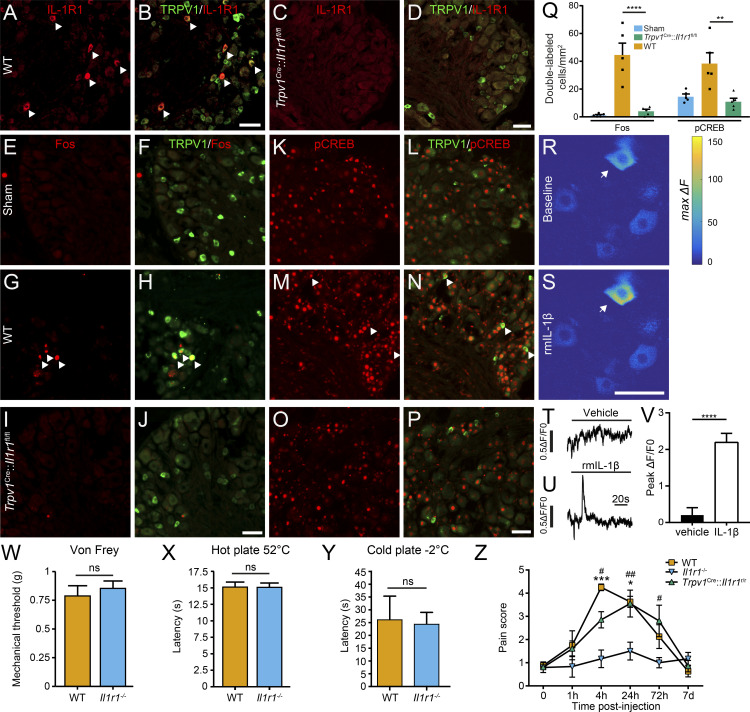
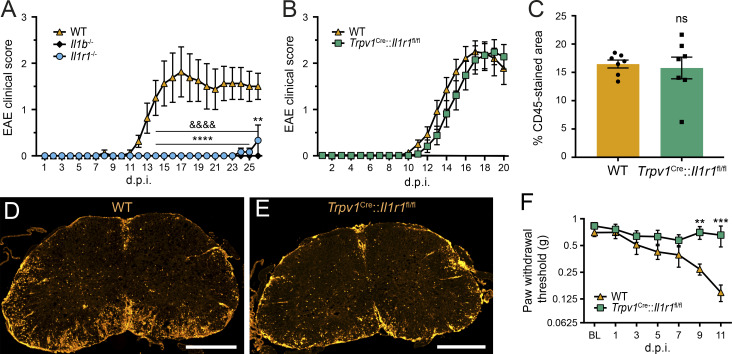
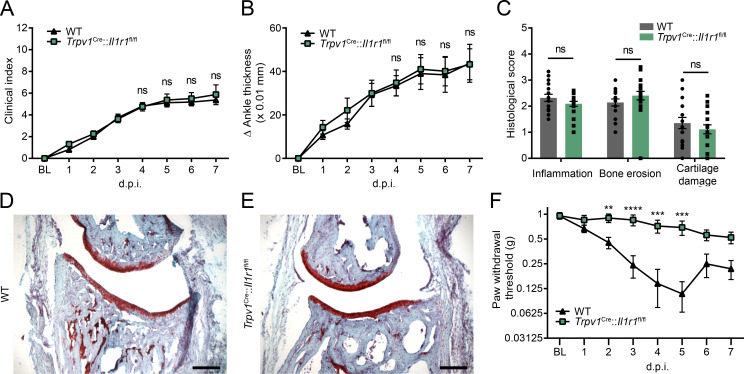
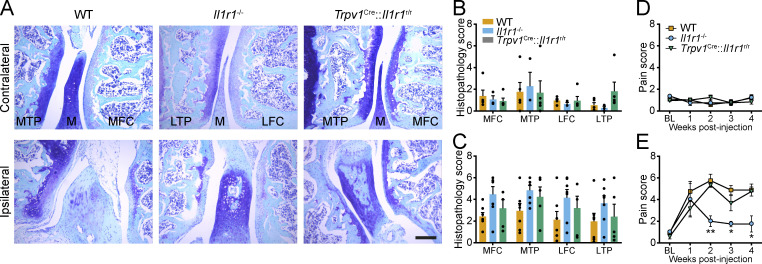
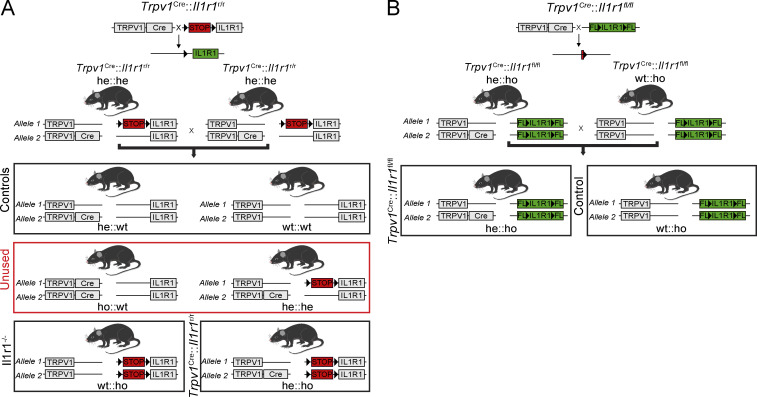
Chronic pain is a major comorbidity of chronic inflammatory diseases. Here, we report that the cytokine IL-1β, which is abundantly produced during multiple sclerosis (MS), arthritis (RA), and osteoarthritis (OA) both in humans and in animal models, drives pain associated with these diseases. We found that the type 1 IL-1 receptor (IL-1R1) is highly expressed in the mouse and human by a subpopulation of TRPV1+ dorsal root ganglion neurons specialized in detecting painful stimuli, termed nociceptors. Strikingly, deletion of the Il1r1 gene specifically in TRPV1+ nociceptors prevented the development of mechanical allodynia without affecting clinical signs and disease progression in mice with experimental autoimmune encephalomyelitis and K/BxN serum transfer-induced RA. Conditional restoration of IL-1R1 expression in nociceptors of IL-1R1-knockout mice induced pain behavior but did not affect joint damage in monosodium iodoacetate-induced OA. Collectively, these data reveal that neuronal IL-1R1 signaling mediates pain, uncovering the potential benefit of anti-IL-1 therapies for pain management in patients with chronic inflammatory diseases.


Conflict of interest statement

Disclosures: The authors declare no competing interests exist.

Figures

Figure 1.
Figure 1.
IL-1β–producing myeloid cells are located nearby IL-1R1–expressing sensory neurons and their projections during EAE. EAE was induced in pIl1b-DsRed mice, and immunofluorescence confocal microscopy imaging was performed to visualize the expression of IL-1β during the early phase (onset) of EAE. (A) IL-1β expression was detected in the dorsal root of spinal nerves projecting to the spinal cord. (B–E) Representative images showing the infiltration of CD11b-positive (+) myeloid cells (red cells in D) producing IL-1β (orange cells in B) in close proximity to IL-1R1+ sensory axons (green in C) in the spinal dorsal root. (F–I) IL-1β (orange in F) is expressed by Ly6G+ neutrophils (red in H) and Iba1+ macrophages (green in G) that infiltrated the spinal dorsal root at EAE onset. Nuclear staining (DAPI) is shown in blue (E and I) in the merged images. (J) Quantification of colocalization for DsRed (IL-1β) and markers of neutrophils (Ly6G) and macrophages (Iba1; n = 4 mice total). Data are presented as a percentage of all DsRed+ cells out of 500 DsRed+ cells. Scale bars: 200 µm (A); 100 µm (E); and 50 µm (I).
Figure 2.
Figure 2.
IL-1β is produced in close association to IL-1R1+ sensory innervation of the ankle joint in a mouse model of RA. RA was induced in pIl1b-DsRed mice by K/BxN serum transfer, and immunofluorescence microscopy was performed to visualize the expression of IL-1β and its receptor, IL-1R1, during the early phase of disease. (A–D) IL-1β–expressing cells in the periarticular region of the inflamed ankle joint are located near IL-1R1+ TRPV1+ fibers 4 d after serum transfer. (E–H) Representative confocal images showing that IL-1β (orange pseudocolor in E) is mainly expressed by infiltrating Ly6G+ neutrophils (red cells in F) and Iba1+ macrophages (green in G). Nuclear staining (DAPI) is shown in blue (D and H) in the merged images. (I) Quantification of colocalization for DsRed (IL-1β) and markers of neutrophils (Ly6G) and macrophages (Iba1). Data are presented as a percentage of all DsRed+ cells (n = 3 mice; a total of 500 DsRed+ cells spread across all animals were counted). Scale bars: 20 µm (D) and 25 µm (H).
Figure 3.
Figure 3.
IL-1R1 is expressed by TRPV1+ DRG neurons in mice. (A) Immunofluorescence confocal microscopy of spinal cord sections from C57BL/6 mice shows that IL-1R1 (green) is expressed by a subset of DRG neurons (inset A′) that projects to laminae I and II of the dorsal horn (delineated by dotted lines). Antibodies directed against CD31 (white) and α-smooth muscle actin (α-SMA; red) were respectively used to stain blood vessel endothelial cells and pericytes/fibroblasts, while cell nuclei were counterstained with DAPI (blue). (B–E) Representative confocal images showing IL-1R1 (B), TRPV1 (C), and P2X3 (D) expression in the spinal cord dorsal horn. (F–I) DRG sections from naive C57BL/6 mice were immunostained with antibodies against IL-1R1 (F), TRPV1 (G), and IB4 (H) to characterize the subtypes of neurons expressing IL-1R1. (J–M) The colocalization of IL-1R1 was also assessed in SstCre::Rosa26-tdTomato mice, in which tandem dimer Tomato fluorescence (tdT) is driven by the Sst promoter. (N) Quantification of the percentage of DRG neurons expressing IL-1R1, TRPV1, P2X3, Sst, CGRP, IB4, and TH. (O) Quantification of the percentage of IL-1R1+ DRG neurons coexpressing commonly used markers of sensory neuron subtypes. (P) Percentage of TRPV1+, P2X3+, Sst+, CGRP+, IB4+, and TH+ neurons coexpressing IL-1R1 (n = 15 mice). Data are shown as mean ± SEM. Scale bars: 200 µm (A); 25 µm (A′); 50 µm (E); 50 µm (I); and 50 µm (M).
Figure 4.
Figure 4.
IL-1R1 is expressed by a subset of NP nociceptive sensory neurons in mice. (A–F) Representative confocal images showing immunostaining of DRG sections with antibodies against TRPV1 (green), P2X3 (red), CGRP (blue), and IL-1R1 (orange). The white arrowheads point to examples of TRPV1+ P2X3+ IL-1R1+ neurons. (G) Quantification of the total number of IL-1R1–expressing neurons (per millimeter squared) in the L4-L6 DRGs, divided according to the sensory neuron classification proposed by Usoskin et al. (2015): NP1 (TRPV1 P2X3+ CGRP), NP2 (TRPV1+ P2X3+ CGRP+), NP3 (TRPV1+ P2X3+ CGRP), PEP1 (TRPV1+ P2X3 CGRP+), and PEP2 (TRPV1 P2X3 CGRP+); n = 5 mice. (H) The counts shown in G are expressed as a percentage ratio of the three subpopulations of sensory neurons expressing TRPV1 (n = 5 mice). Data are shown as mean ± SEM (G and H). (I) Bioinformatic analysis of genes associated with neuropeptides, neuromodulators, and neurotransmitters in the different DRG neuronal subtypes using scRNA-seq raw data from Zeisel et al (2018). The neuronal classification proposed by Usoskin et al. (2015) is also reported on top of the heatmap. For each gene, the heatmap shows the neuronal subtype with the highest (red) and lowest (blue) expression. White corresponds to 50% of the maximal expression for each gene. Sequential sorting was performed to visualize genes expressed specifically by the NP3 (PSNP6) population of DRG neurons. Scale bars: 100 µm (A); 50 µm (E); and 50 µm (F).
Figure 5.
Figure 5.
IL-1R1 is expressed by NP TRPV1+ sensory neurons of human DRGs. (A and B) Validation of the specificity of the anti–IL-1R1 antibody by the absence of IL-1R1 immunostaining in fresh frozen human DRG sections preincubated with the blocking agent anakinra. (C–N) Immunofluorescence confocal microscopy of a postmortem human lumbar DRG immunostained for IL-1R1 (C, G, and K), TRPV1 (E, H, and L), and CGRP (D, I, and M). (O) Quantification of the relative number of DRG neurons expressing IL-1R1 and TRPV1. Data are expressed as a percentage of the total HuC/D+ neuronal population in lumbar DRGs and represent means ± SEM of five individuals. (P) The expression of CGRP was assessed in the total IL-1R1+ TRPV1+ double-positive subpopulation (set at 100%). Data are shown as mean ± SEM. Scale bars: 200 µm (B and F); 25 µm (J); and 12.5 µm (N).
Figure 6.
Figure 6.
IL-1β activation of IL-1R1 in TRPV1+ sensory neurons induces pain-related behavior in mice. (A–D) Representative confocal images showing the specificity of the Trpv1Cre::Il1r1fl/fl mouse line, as demonstrated by the loss of IL-1R1 immunoreactivity (red signal) in TRPV1+ neurons (green) of Trpv1Cre::Il1r1fl/flmice (C and D) compared with their WT littermates (A and B).(E–P) WT (G, H, M, and N) and Trpv1Cre::Il1r1fl/fl(I, J, O, and P) mice were injected unilaterally in the sciatic nerve with rmIL-1β and killed at 4 h after injection to assess expression in the L4-L6 DRGs of the cellular activation markers Fos (E–Jin red) and pCREB (K–P in red) in TRPV1+ sensory neurons (green). Sham animals (E, F, K, and L) received the same surgery but without injection. White arrowheads point to double-labeled neurons. (Q) Total counts of Fos+ TRPV1+ cells and pCREB+ TRPV1+ cells are reported as a function of the total tissue area (in millimeter squared; n = 5 tissue sections per mouse, five mice per group). Trpv1WT/WT::Il1r1fl/fl mice were used as WT controls in A–Q.(R–V) The calcium response was measured in L4/L5 DRG neurons by means of in vivo video-rate two-photon functional imaging after direct application of rmIL-1β to the exposed DRG. Representative examples of neuronal responses (indicated by the arrows) after application of either vehicle or rmIL-1β are depicted as color-coded heatmaps of a typical imaging field (R and S) or as Ca2+ curves (T and U). Quantification showing the significant calcium response to rmIL-1β over the vehicle treatment is shown in V(n = 4 mice). (W–Y) Assessment of the nociceptive response to mechanical (W) and thermal (X and Y) stimuli in Il1r1−/− mice (n = 13) compared with WT mice (n = 7). (Z) Pain was assessed using the knee-bend test in WT (n = 4), Il1r1−/− (n = 6), and Trpv1Cre::Il1r1r/r (n = 10) mice following intra-articular injection of rmIL-1β in the knee. C57BL/6 mice served as control mice in W–Y, whereas Trpv1WT/WT::Il1r1WT/WT mice were used as WT controls in Z. Data are shown as mean ± SEM. Statistical significance was determined by a t test (V–Y) or by one-way (Q) or two-way repeated measures (Z) ANOVA followed by a Bonferroni post hoc test. *, P < 0.05; **, P < 0.01; ***, P < 0.001; ****, P < 0.0001; compared with the WT group (Q), vehicle treatment (V), or the Il1r1−/− group (Z). #, P < 0.05; ##, P < 0.01; Il1r1−/− mice compared with Trpv1Cre::Il1r1fl/flmice (Z). Scale bars: 50 µm (B); 50 µm (D); 50 µm (J); 50 µm (P); and 50 µm (S). ns, not significant.
Figure 7.
Figure 7.
IL-1R1 deficiency in nociceptors prevents the development of pain without affecting signs of inflammation and paralysis in EAE mice. (A and B) The clinical course of MOG35-55–induced EAE was analyzed in mice constitutively lacking IL-1β (n = 10) or IL-1R1 (n = 7, A; n = 14, B), mice with conditional deletion of IL-1R1 in TRPV1-expressing cells (Trpv1Cre::Il1r1fl/fl mice, n = 16), and their respective WT control group (n = 10, A; n = 16, B). C57BL/6 mice served as WT controls in A, whereas Trpv1WT/WT::Il1r1fl/fl mice were used as WT mice in B–F. (C) Quantification of leukocyte infiltration as determined by immunodetection of the CD45 pan-leukocyte marker in the spinal cord of WT and Trpv1Cre::Il1r1fl/fl mice at 21 d after immunization (d.p.i.; n = 7 mice/group). (D and E) Representative photomicrographs showing CD45 immunostaining in the spinal cord of EAE mice. (F) The development of mechanical allodynia was assessed using von Frey filaments in the two groups following EAE immunization (n = 16–24 mice/group; two independent experiments were pooled). Data are shown as mean ± SEM. Statistical significance was determined by two-way (C) or two-way repeated-measures (A, B, and F) ANOVA followed by a Bonferroni post hoc test. **, P < 0.01; ***, P < 0.001; ****, P < 0.0001; Il1r1/ mice compared with the WT group in A. &&&&, P < 0.0001; Il1b/ mice compared with the WT group in A. **, P < 0.01; ***, P < 0.001; Trpv1Cre::Il1r1fl/fl mice compared with the WT group in B and F. Data in B and Fare representative of two independent pooled experiments. Scale bars: 500 µm (D and E). BL, baseline; ns, not significant.
Figure 8.
Figure 8.
Deletion of the Il1r1 gene from nociceptors prevents allodynia without affecting ankle inflammation and swelling in the K/BxN arthritis model. (A and B) The clinical course (A) and signs of arthritis (B) were monitored in mice with conditional deletion of IL-1R1 in TRPV1-expressing cells and their WT control mice (n = 16 mice/group; two independent experiments were pooled). (C) Quantification of safranin-O staining in the arthritic ankle of Trpv1Cre::Il1r1fl/fl and WT mice at 7 d after K/BxN serum injection (n = 10 mice/group). (D and E) Representative examples of histochemical staining (safranin-O/hematoxylin/Fast green) showing the overall cytoarchitecture of articular cartilage of the tibiotalar joint at day 7. (F) The development of mechanical allodynia was assessed in arthritic Trpv1Cre::Il1r1fl/fl and WT mice at various times after K/BxN serum transfer (n = 16 mice/group; two independent experiments). Trpv1WT/WT::Il1r1fl/fl mice were used as WT controls in A–F. Data are shown as mean ± SEM. Statistical significance was determined using a one-way (C) or two-way repeated-measures (A, B, and F) ANOVA followed by a Bonferroni post hoc test. **, P < 0.01; ***, P < 0.001; ****, P < 0.0001 compared with the WT group. Scale bars: 200 µm (D and E). Abbreviations: BL, baseline; d.p.i., days postinjection; ns, not significant.
Figure 9.
Figure 9.
Restoration of the Il1r1 gene in nociceptors induces allodynia without affecting knee joint damage in the MIA OA model. (A–C) Representative photomicrographs of histological sections of the knee joint of WT (n = 6), Il1r1/ (n = 7), and Trpv1Cre::Il1r1r/r (n = 5) mice at 4 wk after injection of MIA. Tissue sections were stained with Toluidine blue and Fast green to identify the articular cartilage, and cartilage damage was quantified in the main structures of the knee joint in both the ipsilateral (B) and contralateral (C) knee. (D and E) Mechanical allodynia assessment in the contralateral (D) and ipsilateral (E) knee joint following intra-articular injection of MIA in WT (n = 6), Il1r1/ (n = 7), and Trpv1Cre::Il1r1r/r (n = 5) mice. Trpv1WT/WT::Il1r1WT/WT mice were used as WT controls in AE. Data are shown as mean ± SEM. Statistical significance was determined by two-way (B and C) or two-way repeated-measures (D and E) ANOVA followed by a Bonferroni post hoc test. *, P < 0.05; **, P < 0.01; Il1r1/ mice compared with the other two groups. BL, baseline; LFC, lateral femoral condyle; LTP, lateral tibial plateau; M, meniscus; MFC, medial femoral condyle; MTP, medial tibial plateau. Scale bar: 200 µm (A).
Figure S1.
Figure S1.
Breeding strategy used to generate nociceptor-specific IL-1R1 restored and knockout mouse lines. (A and B) Schematic representation of the breeding strategy used in the present study to generate cell-specific IL-1R1 restored (A) and knockout (B) mouse lines, as well as their respective WT littermates. A shows the breeding strategy used to generate Trpv1Cre::Il1r1r/r mice, whereas B shows how Trpv1Cre::Il1r1fl/fl mice were generated by taking advantage of the Cre-LoxP system. The Trpv1Cre::Il1r1r/r mouse line was used to restore IL-1R1 expression specifically and only in TRPV1+ cells, while the Trpv1Cre::Il1r1fl/fl line was used to knock out the Il1r1 gene specifically in TRPV1-expressing cells. FL, floxed allele; he, heterozygous; ho, homozygous.

References

    1. Allan S.M., Tyrrell P.J., and Rothwell N.J.. 2005. Interleukin-1 and neuronal injury. Nat. Rev. Immunol. 5:629–640. 10.1038/nri1664 - DOI - PubMed
    1. Arima Y., Harada M., Kamimura D., Park J.H., Kawano F., Yull F.E., Kawamoto T., Iwakura Y., Betz U.A., Márquez G., et al. . 2012. Regional neural activation defines a gateway for autoreactive T cells to cross the blood-brain barrier. Cell. 148:447–457. 10.1016/j.cell.2012.01.022 - DOI - PubMed
    1. Arima Y., Kamimura D., Atsumi T., Harada M., Kawamoto T., Nishikawa N., Stofkova A., Ohki T., Higuchi K., Morimoto Y., et al. . 2015. A pain-mediated neural signal induces relapse in murine autoimmune encephalomyelitis, a multiple sclerosis model. eLife. 4 e08733 10.7554/eLife.08733 - DOI - PMC - PubMed
    1. Aubé B., Lévesque S.A., Paré A., Chamma É., Kébir H., Gorina R., Lécuyer M.A., Alvarez J.I., De Koninck Y., Engelhardt B., et al. . 2014. Neutrophils mediate blood-spinal cord barrier disruption in demyelinating neuroinflammatory diseases. J. Immunol. 193:2438–2454. 10.4049/jimmunol.1400401 - DOI - PubMed
    1. Balasingam V., Tejada-Berges T., Wright E., Bouckova R., and Yong V.W.. 1994. Reactive astrogliosis in the neonatal mouse brain and its modulation by cytokines. J. Neurosci. 14:846–856. 10.1523/JNEUROSCI.14-02-00846.1994 - DOI - PMC - PubMed

Publication types

MeSH terms