

doi: 10.1093/jmcb/mjaa028.
Transcriptional output, cell-type densities, and normalization in spatial transcriptomics
Affiliations
- PMID: 32573704
- PMCID: PMC7883818
- DOI: 10.1093/jmcb/mjaa028
Item in Clipboard
Transcriptional output, cell-type densities, and normalization in spatial transcriptomics
J Mol Cell Biol.
.
No abstract available
Figures
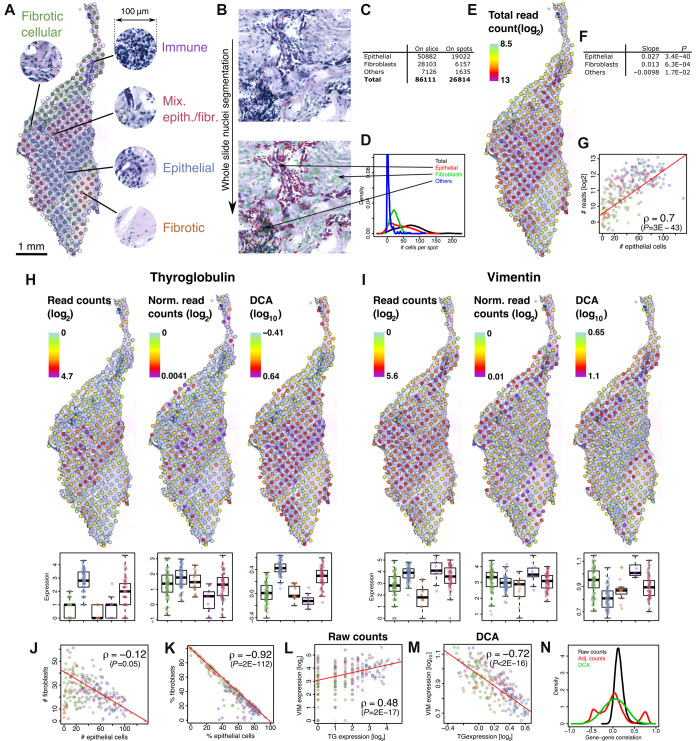
Variation of total read counts is related to morphology and number of cells of different types. (A) Five types of morphological regions were determined from pathology. The transcriptome was measured in each spot with ST. (B) The nuclei on the H&E image were segmented and classified with a machine learning-based algorithm (Supplementary material). (C) Nuclei counts. (D) Distributions of the number of cells per ST spot. (E) Total read count per spot. (F) Multivariate analysis of association between cell numbers and the log2 of total read count per spot. (G) Each point represents a ST spot with same color code as in A. ρ denotes the Spearman’s correlation. (H and I) Expression of TG (H) and VIM (I) without normalization (left), with adjustment for total read counts (center), and with DCA normalization (right). Boxplots represent the expression of spots in the regions shown in A (same color code). (J and K) Points represent spots (same color code as before) with the absolute number (J) and cell-type proportion (K) of epithelial cells (x-axis) and fibroblasts (y-axis). The large negative correlation stems from the low number of ‘others’ in C. (L and M) Expressions of TG and VIM are compared using raw counts or auto-encoder-based normalization. (N) Distribution of gene–gene correlation across spots for raw counts and normalized data.
References
-
- Coclet J., Lamy F., Rickaert F., et al. (1991). Intermediate filaments in normal thyrocytes: modulation of vimentin expression in primary cultures. Mol. Cell. Endocrinol. 76, 135–148. - PubMed
-
- Giacomello S., Salmén F., Terebieniec B.K., et al. (2017). Spatially resolved transcriptome profiling in model plant species. Nat. Plants 3, 17061. - PubMed
Publication types
MeSH terms
Substances
LinkOut - more resources
Full Text Sources
Research Materials
