. 2020 Sep 10;136(11):1317-1329.
doi: 10.1182/blood.2020007214.

Platelet gene expression and function in patients with COVID-19

Affiliations

Platelet gene expression and function in patients with COVID-19

Bhanu Kanth Manne et al. Blood. .

Abstract

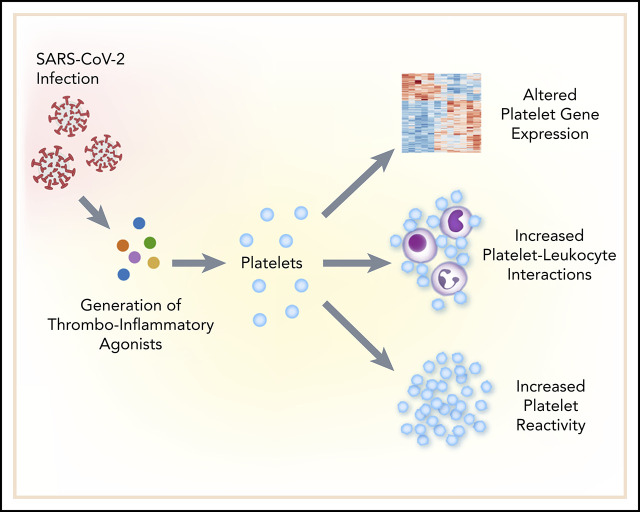
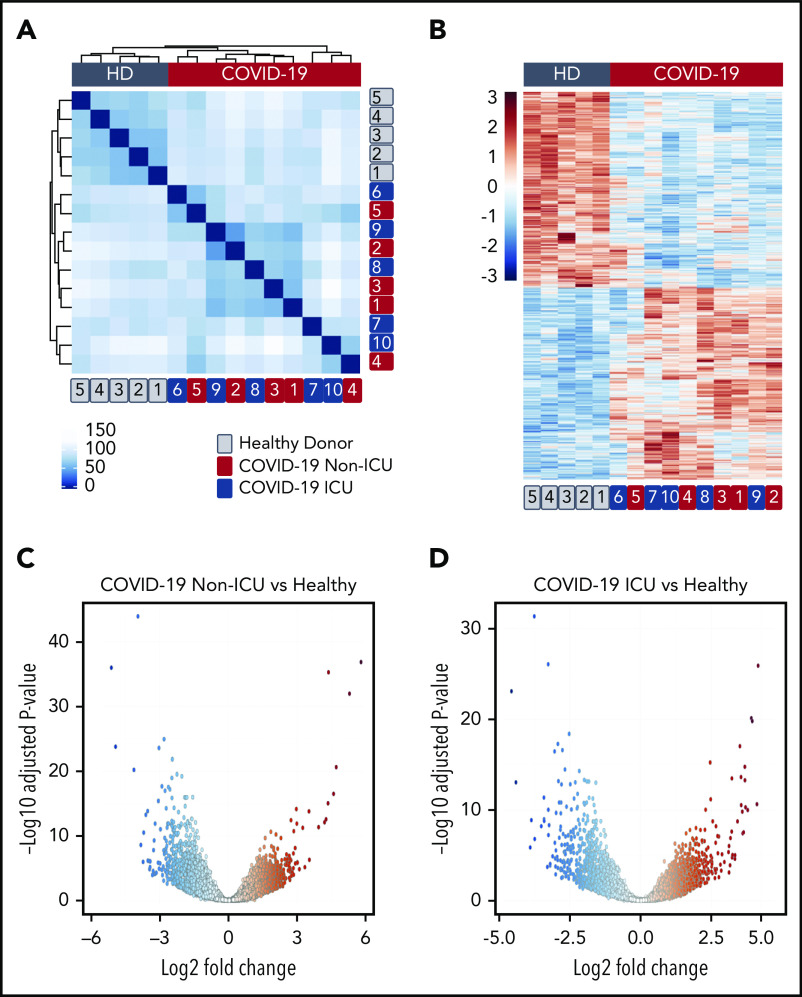
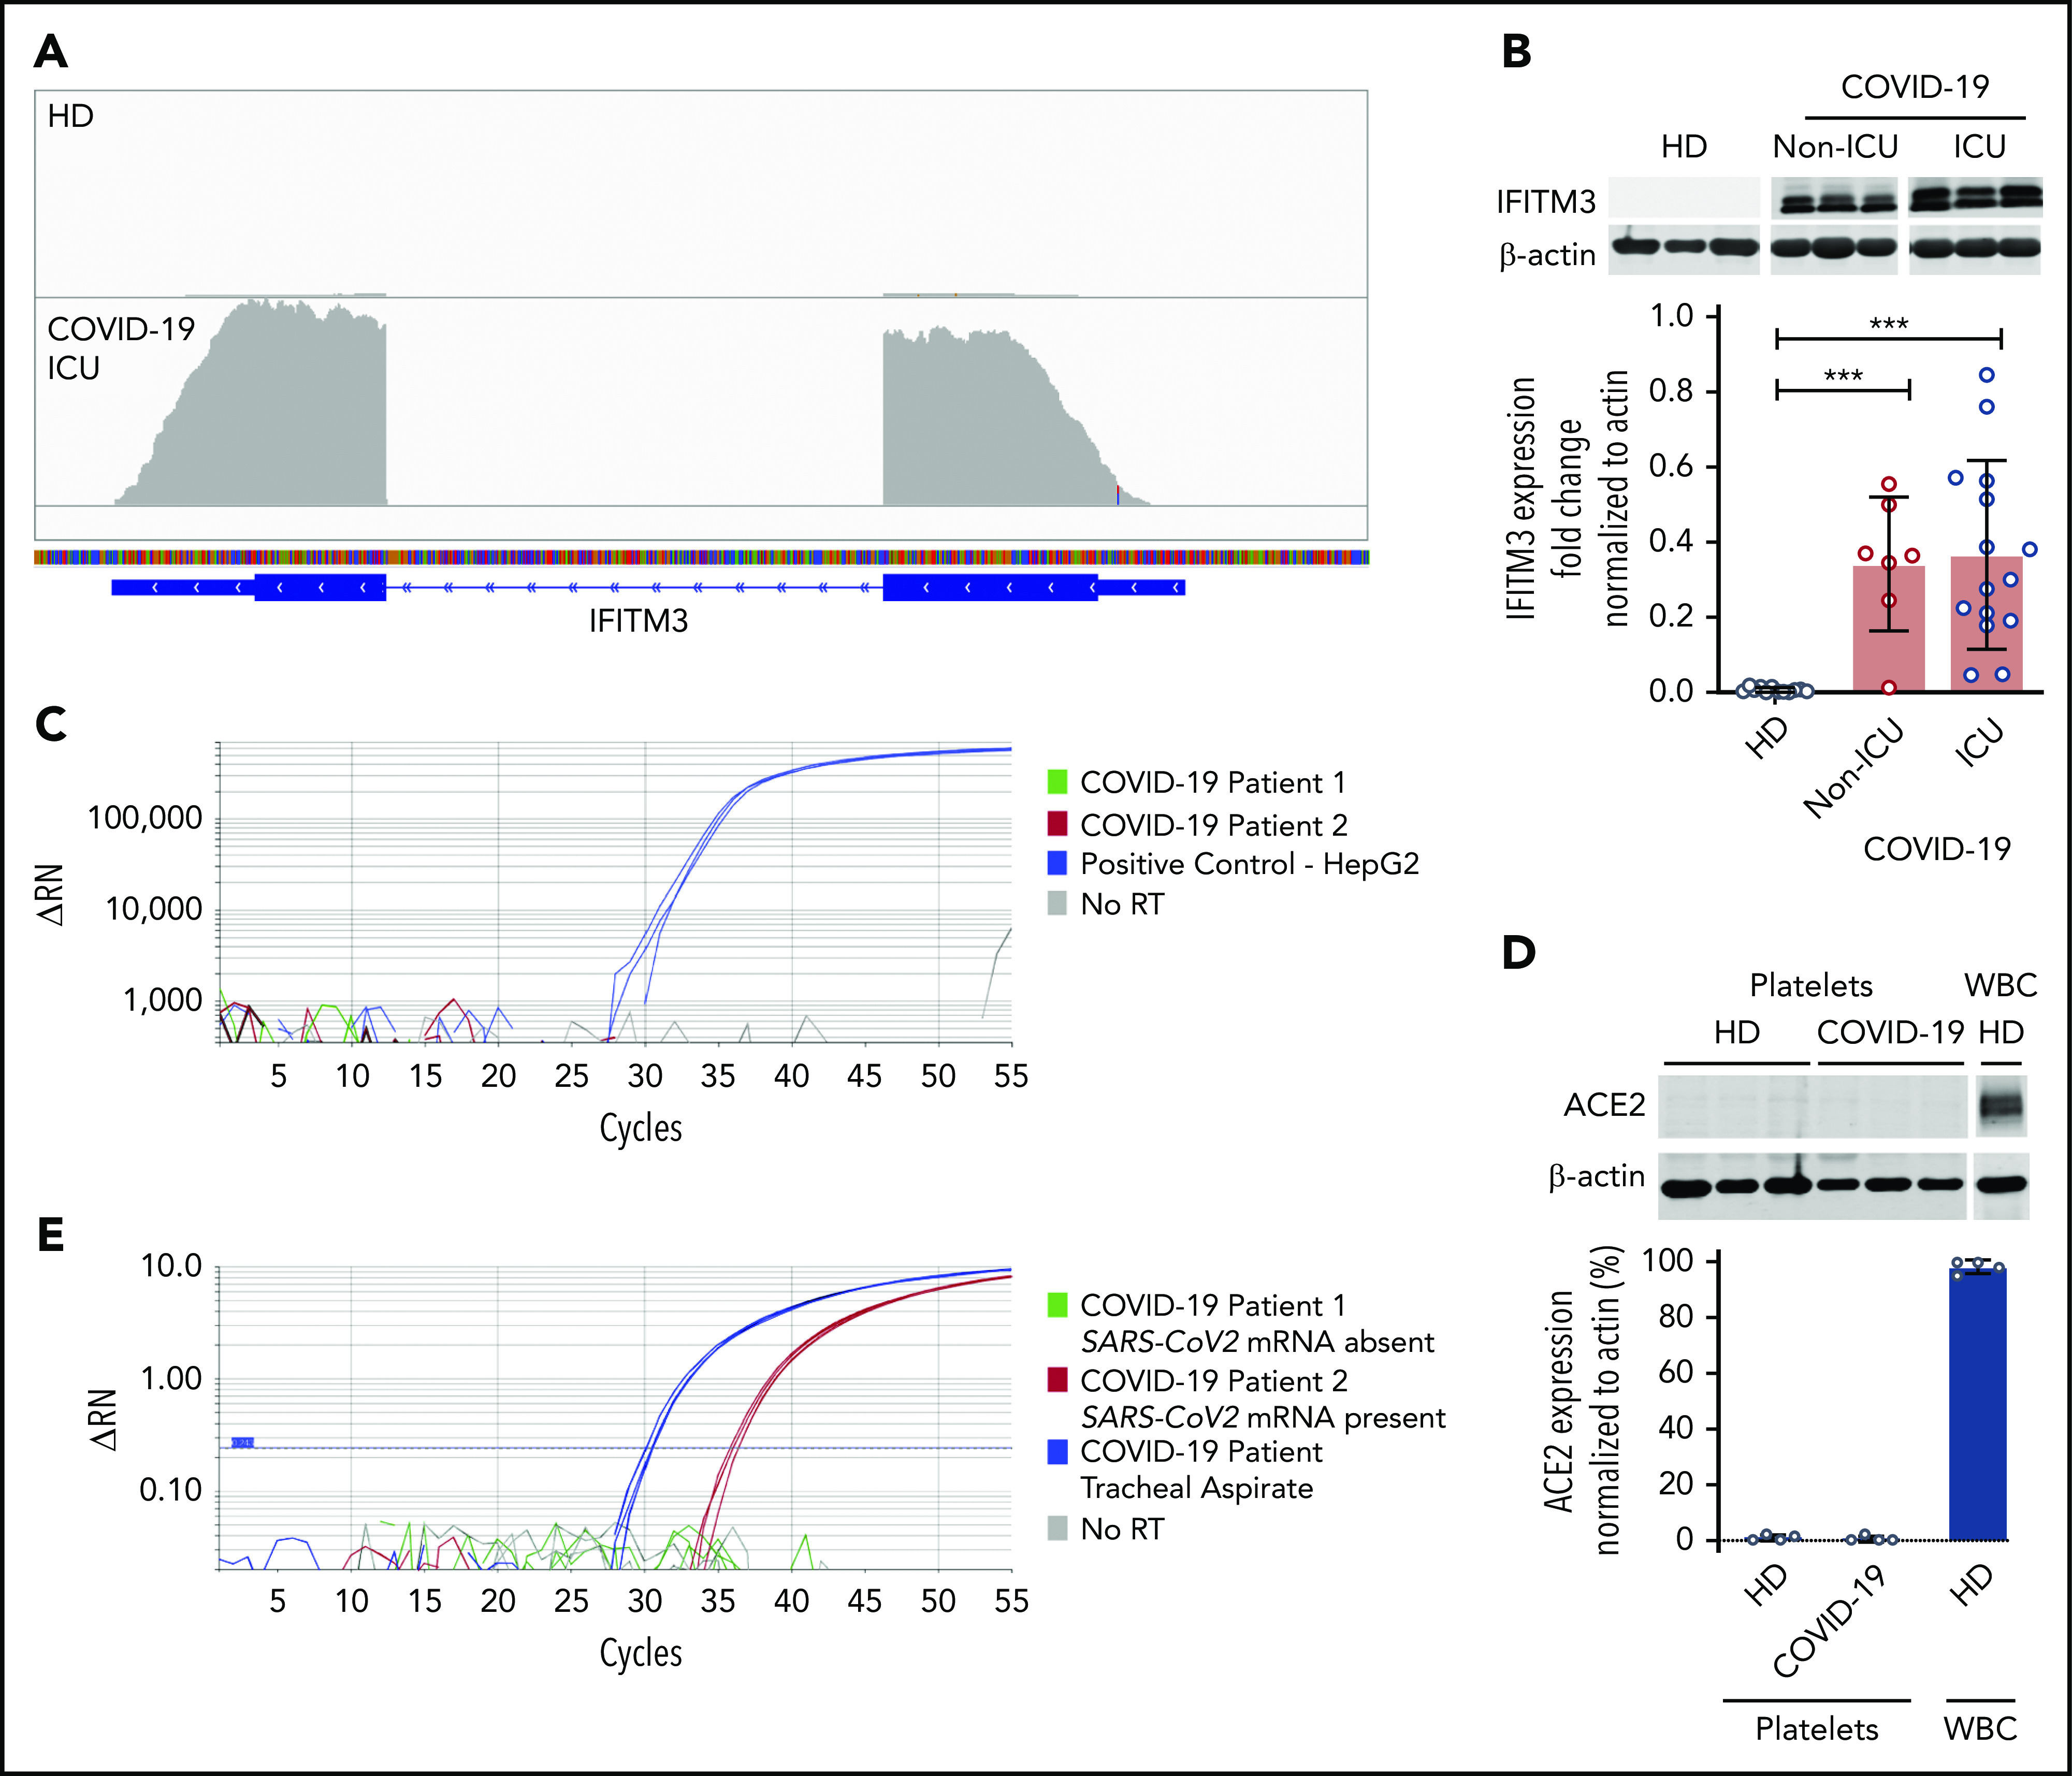
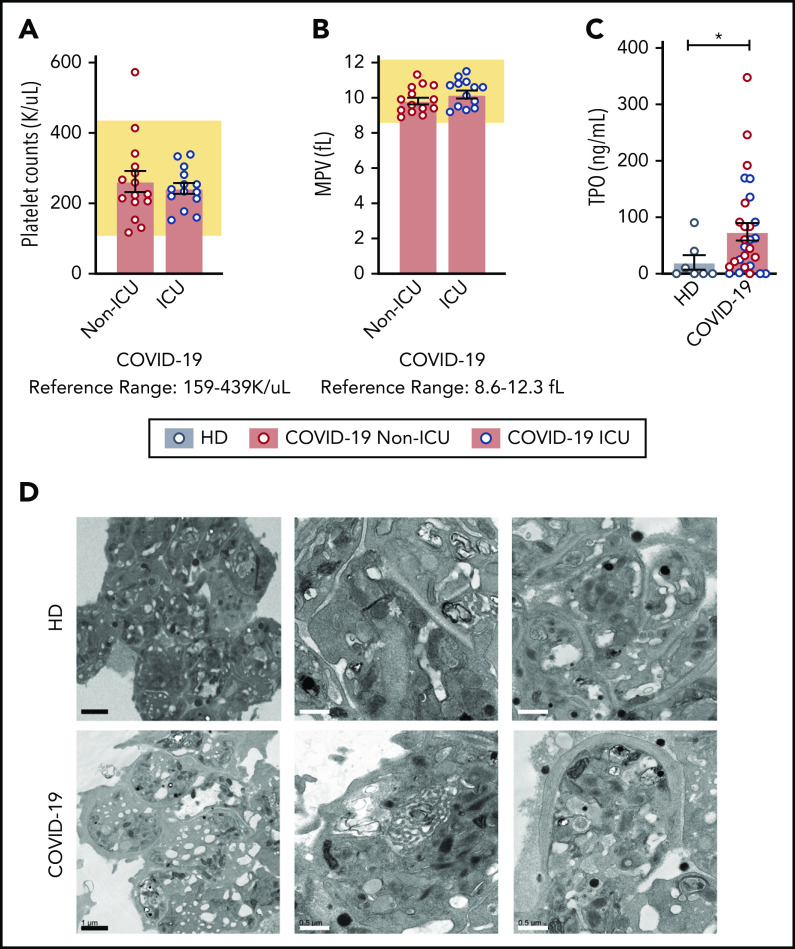
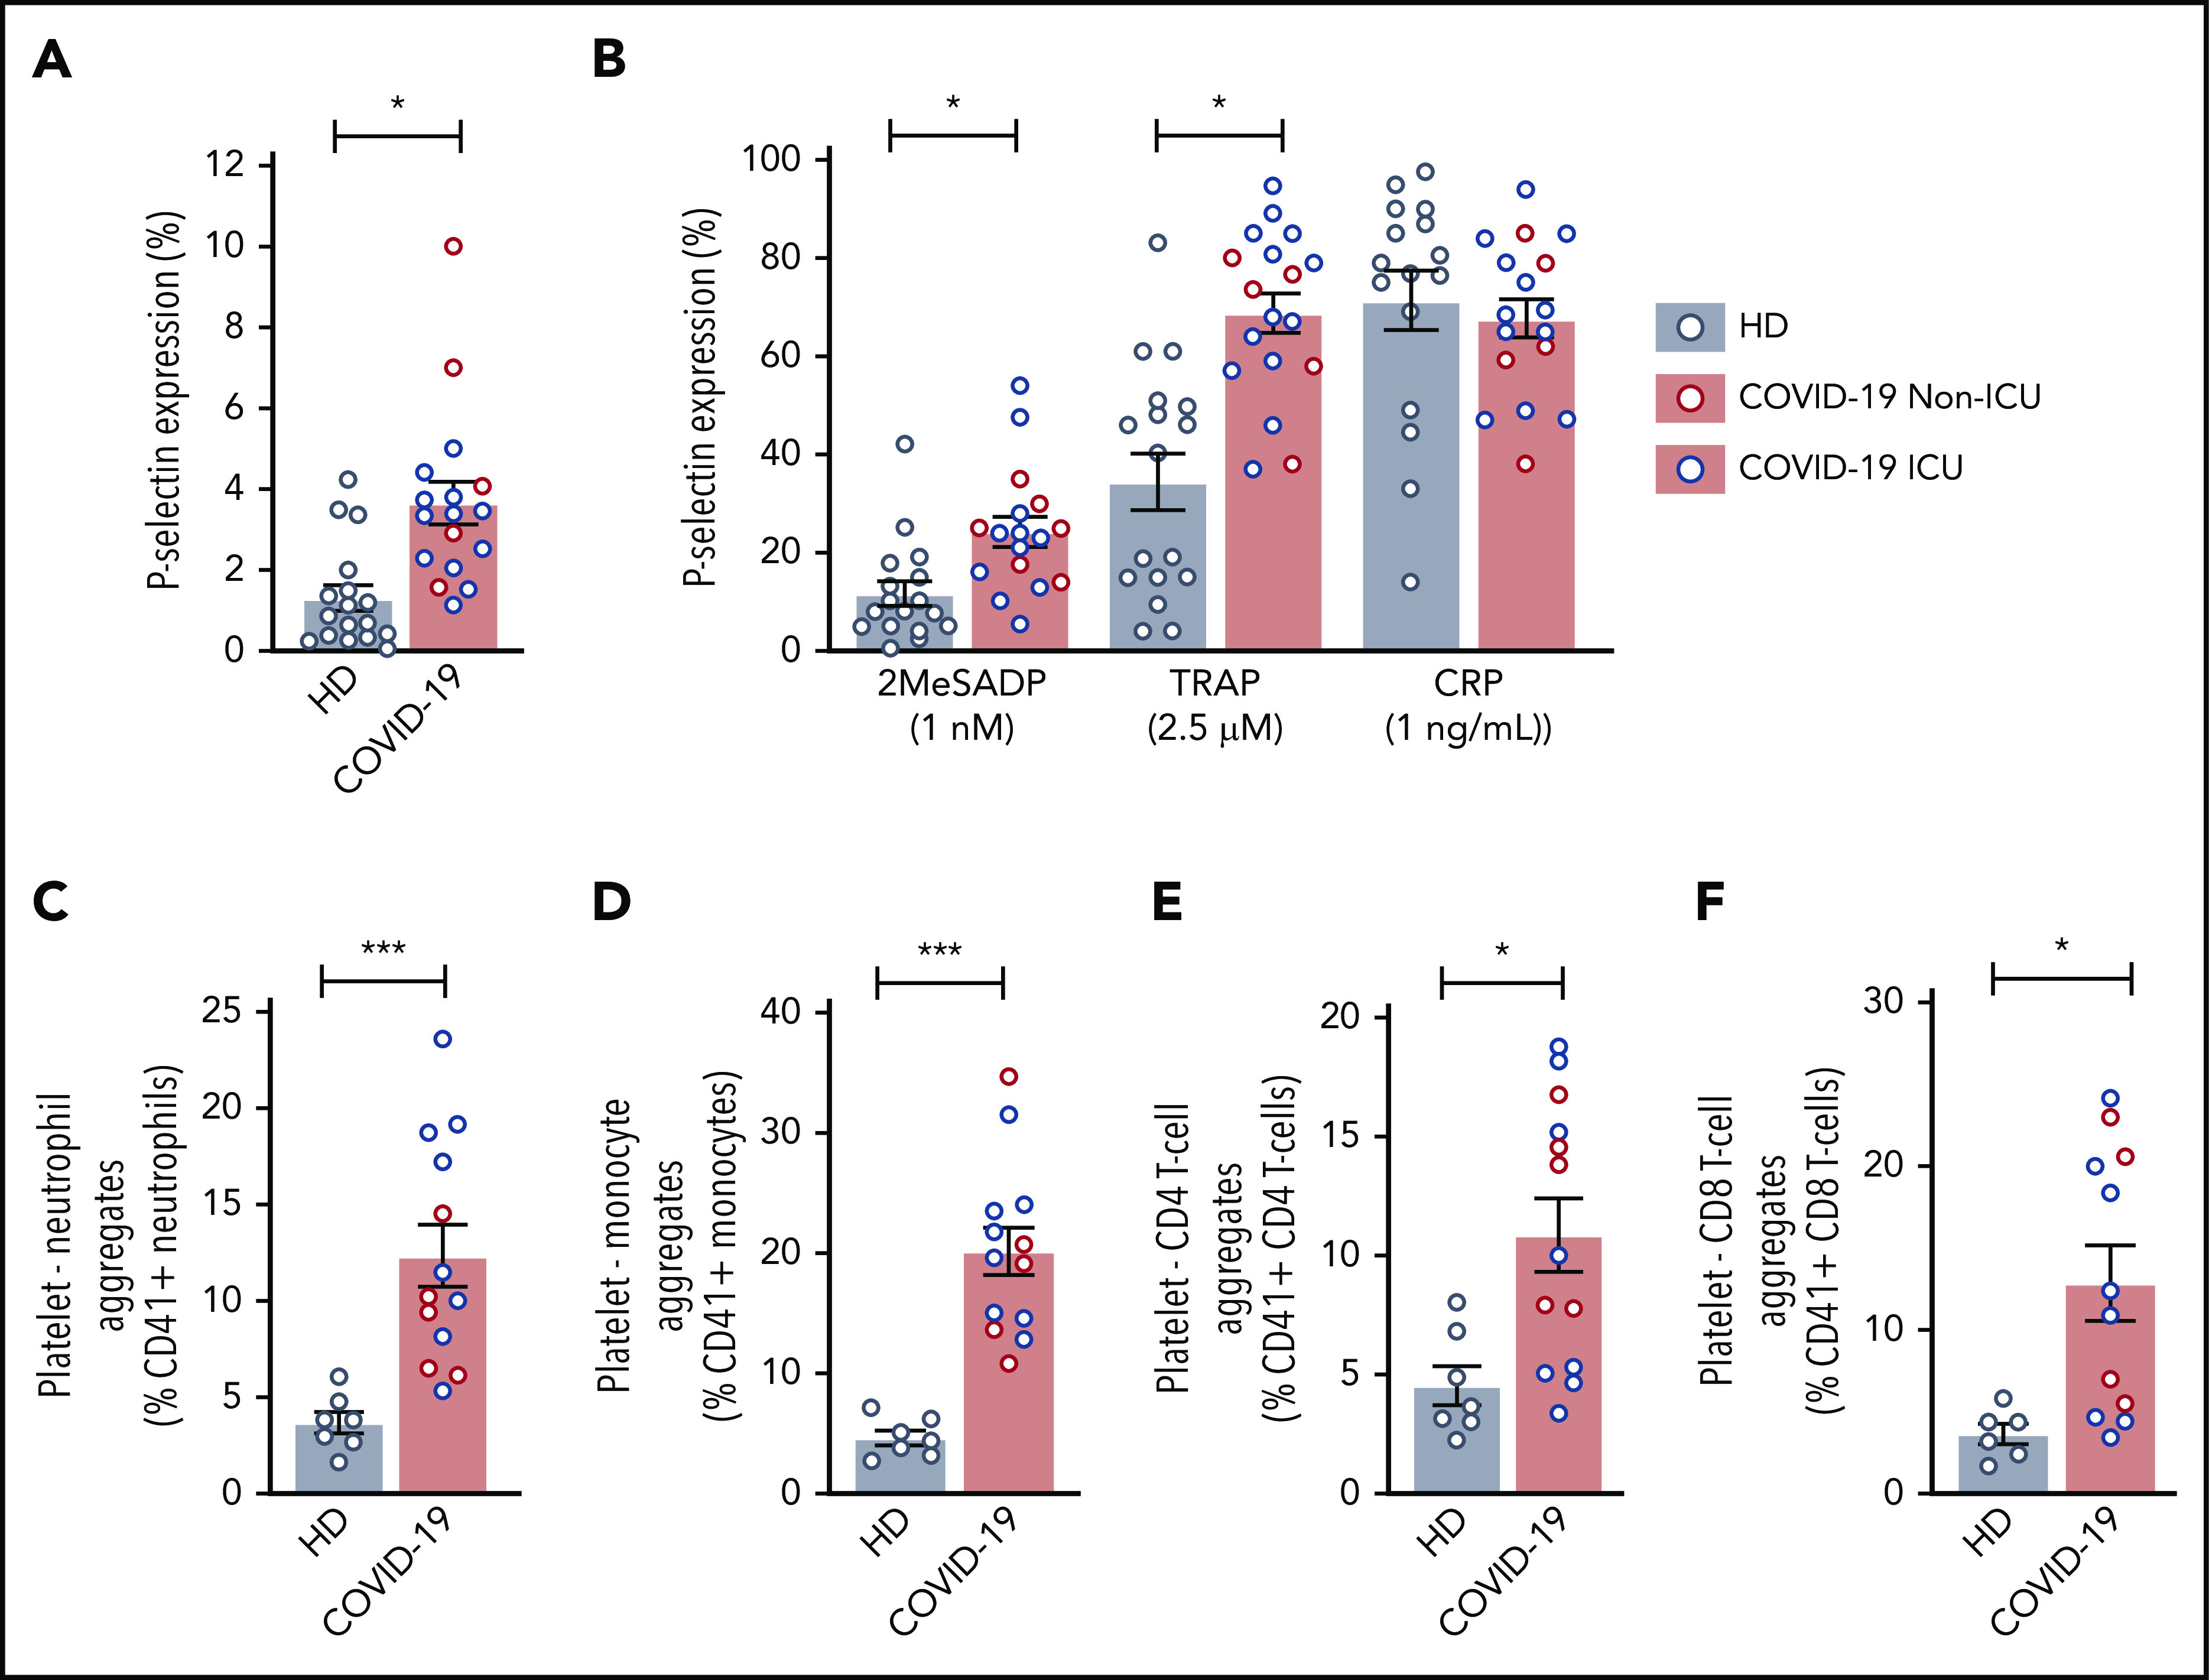
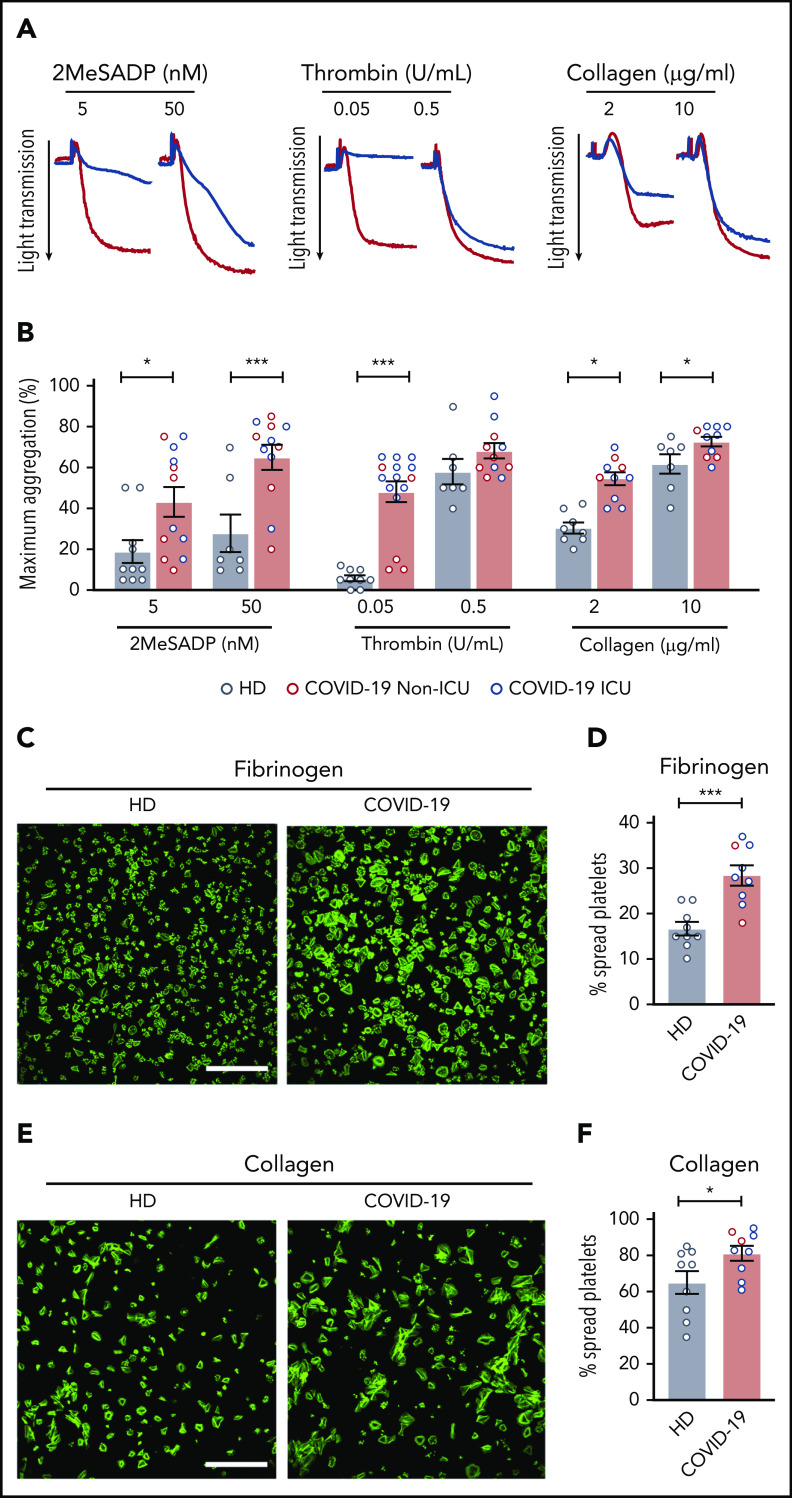
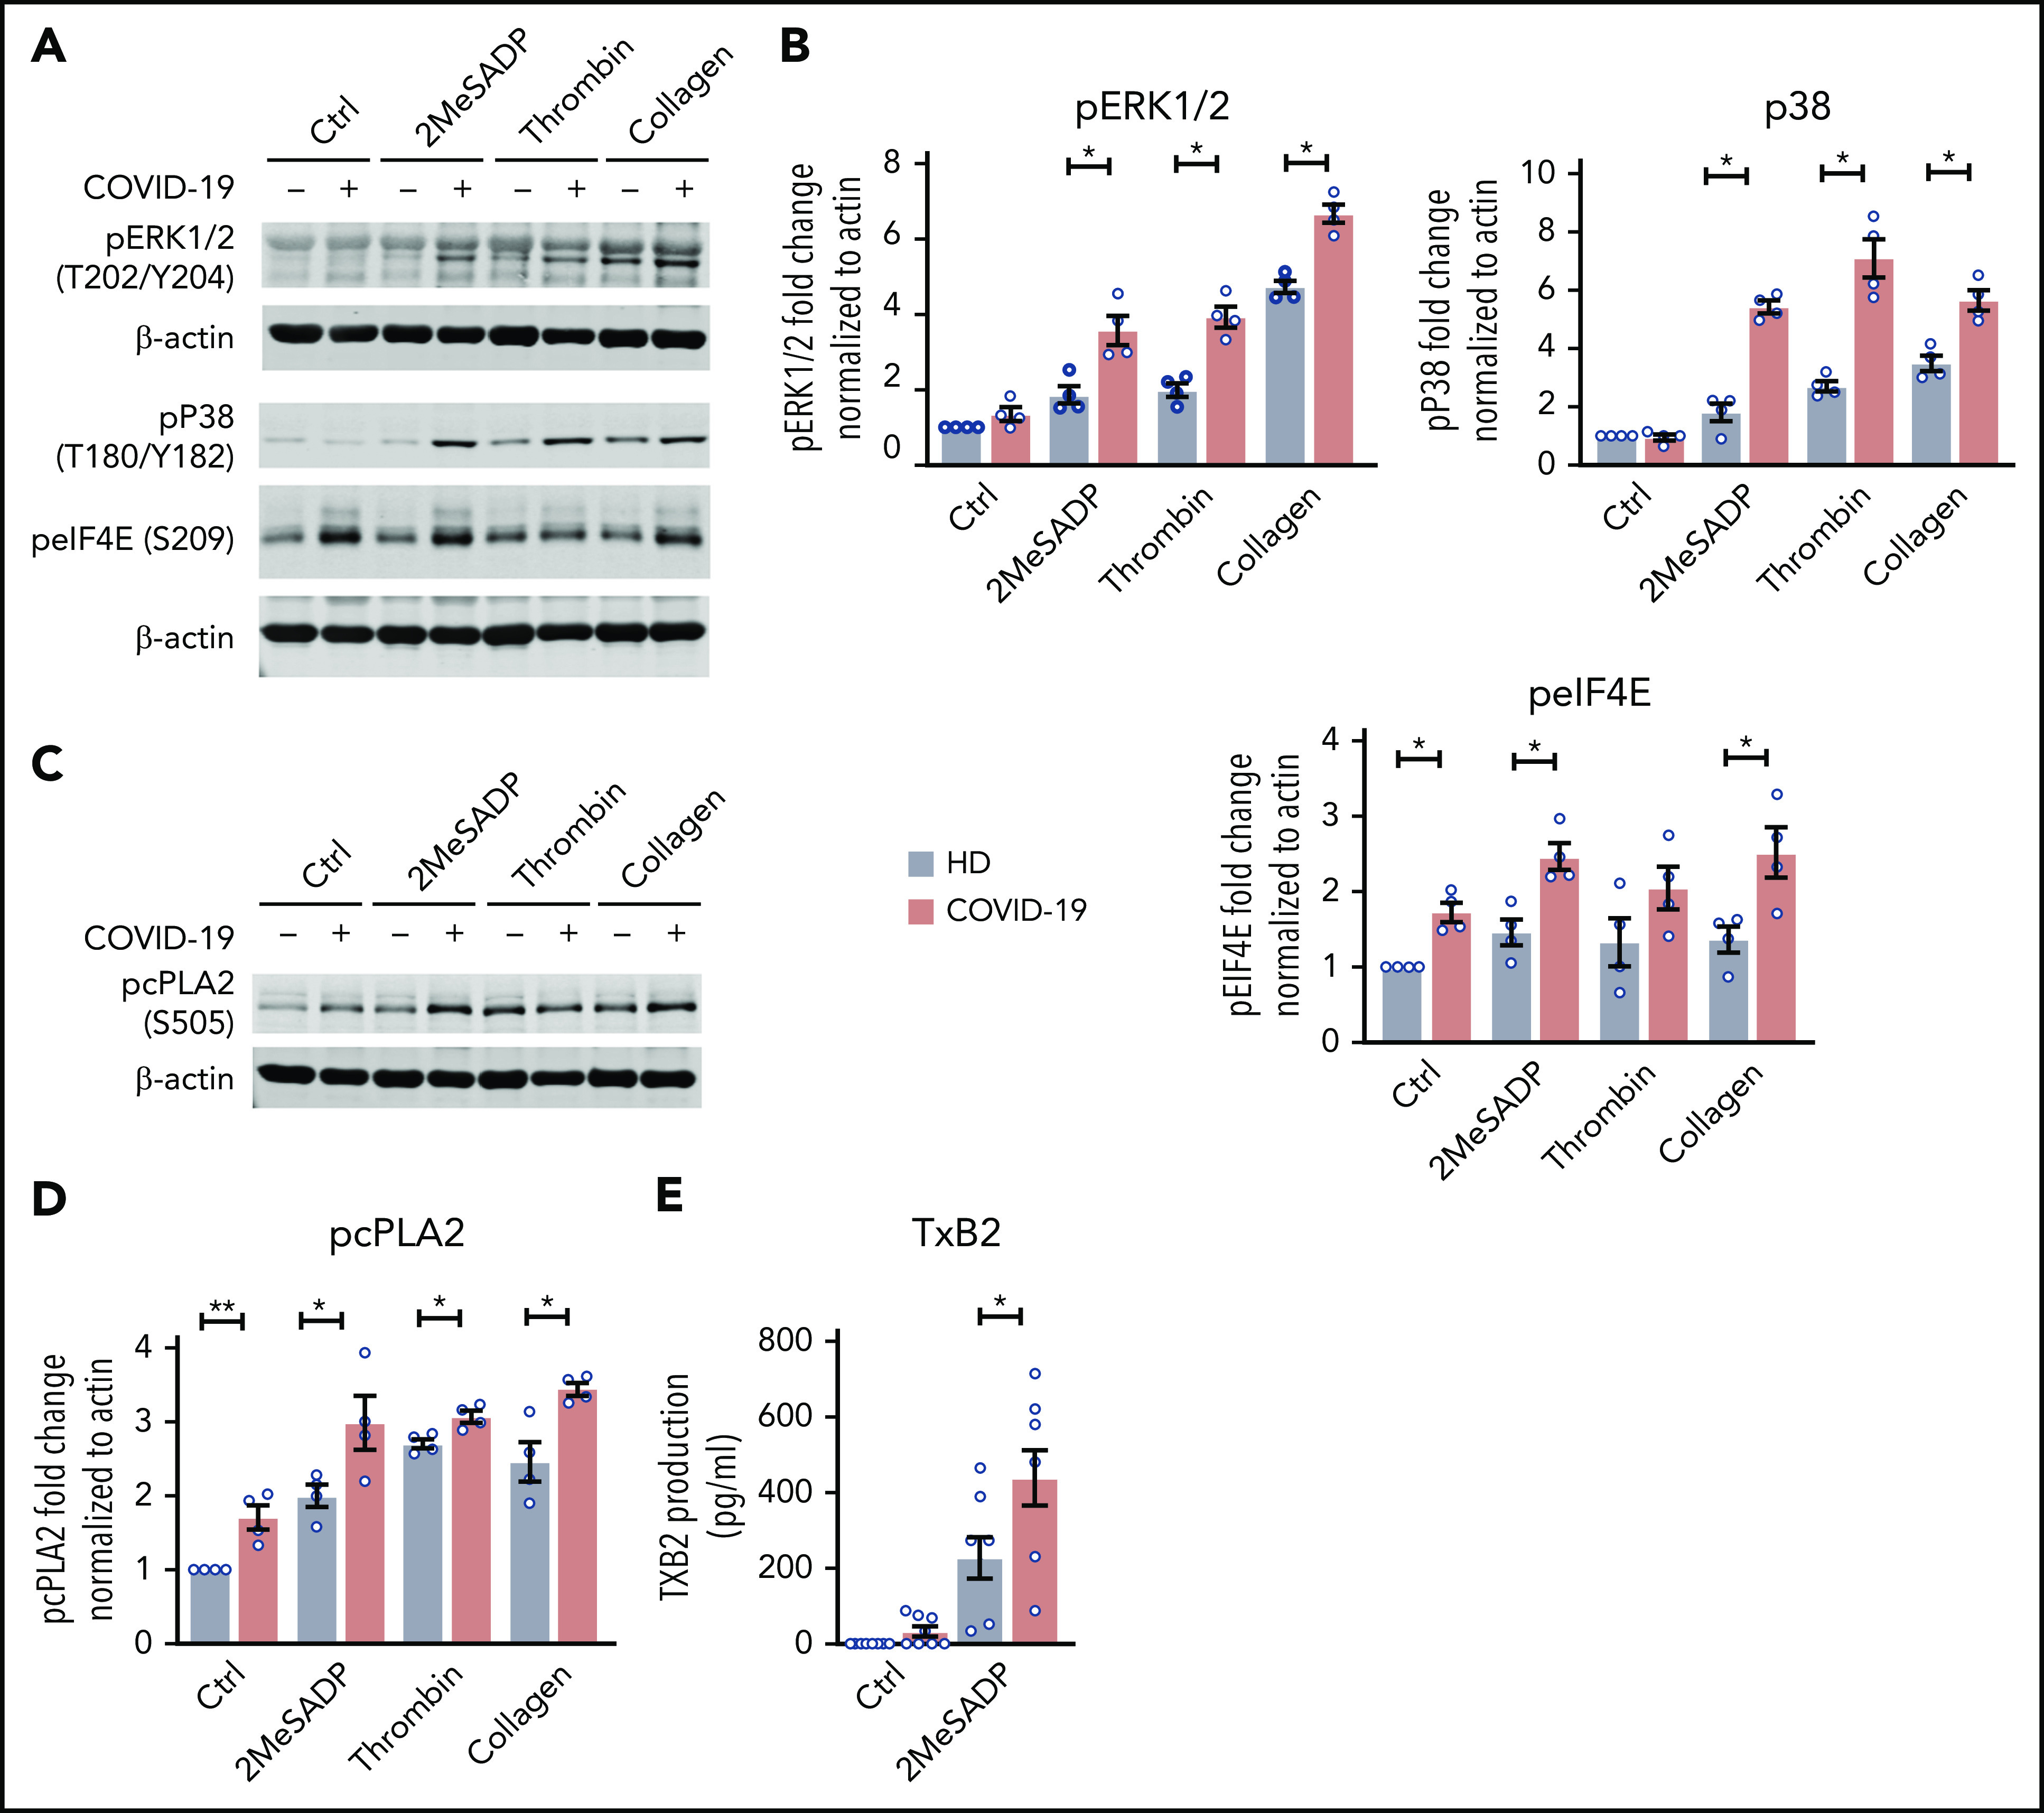
There is an urgent need to understand the pathogenesis of coronavirus disease 2019 (COVID-19). In particular, thrombotic complications in patients with COVID-19 are common and contribute to organ failure and mortality. Patients with severe COVID-19 present with hemostatic abnormalities that mimic disseminated intravascular coagulopathy associated with sepsis, with the major difference being increased risk of thrombosis rather than bleeding. However, whether severe acute respiratory syndrome coronavirus 2 (SARS-CoV-2) infection alters platelet function to contribute to the pathophysiology of COVID-19 remains unknown. In this study, we report altered platelet gene expression and functional responses in patients infected with SARS-CoV-2. RNA sequencing demonstrated distinct changes in the gene-expression profile of circulating platelets of COVID-19 patients. Pathway analysis revealed differential gene-expression changes in pathways associated with protein ubiquitination, antigen presentation, and mitochondrial dysfunction. The receptor for SARS-CoV-2 binding, angiotensin-converting enzyme 2 (ACE2), was not detected by messenger RNA (mRNA) or protein in platelets. Surprisingly, mRNA from the SARS-CoV-2 N1 gene was detected in platelets from 2 of 25 COVID-19 patients, suggesting that platelets may take-up SARS-COV-2 mRNA independent of ACE2. Resting platelets from COVID-19 patients had increased P-selectin expression basally and upon activation. Circulating platelet-neutrophil, -monocyte, and -T-cell aggregates were all significantly elevated in COVID-19 patients compared with healthy donors. Furthermore, platelets from COVID-19 patients aggregated faster and showed increased spreading on both fibrinogen and collagen. The increase in platelet activation and aggregation could partially be attributed to increased MAPK pathway activation and thromboxane generation. These findings demonstrate that SARS-CoV-2 infection is associated with platelet hyperreactivity, which may contribute to COVID-19 pathophysiology.


Conflict of interest statement

Conflict-of-interest disclosure: The authors declare no competing financial interests.

Figures

None
Graphical abstract
Figure 1.
Figure 1.
SARS-CoV-2 infection alters the platelet transcriptome. RNA-seq was performed on RNA isolated from highly purified platelets from 6 non-ICU and 4 ICU SARS-CoV-2 patients and 5 matched healthy donors (HD) as described in “Methods”. (A) Hierarchical clustering of samples according to global gene expression demonstrates non-ICU SARS-CoV-2–infected patients (red numbers) and ICU (blue numbers) cluster together whereas healthy donors (gray numbers) segregate together. (B) Heat map of significantly differentially expressed platelet transcripts from SARS-CoV-2–infected ICU and non-ICU patients and healthy control donors. Red indicates increased relative expression, and blue indicates decreased relative expression. Only coding mRNAs were examined in this analysis. (C-D) Volcano plot with significantly increased (red) and decreased (blue) transcripts from non-ICU and ICU COVID-19 patients.
Figure 2.
Figure 2.
Platelets from COVID-19 patients express the antiviral protein IFITM3 but not the ACE2 receptor. (A) Integrated Genome Viewer plots demonstrating expression of IFITM3 from the RNA-seq data set. A representative healthy donor and COVID-19 patient are shown. The height of the bars indicates expression level. (B) Immunoblot and densitometric quantification of IFITM3 and β-actin expression in platelets isolated from healthy donors (n = 12) and SARS-CoV-2–infected non-ICU patients (n = 7) and COVID-19 ICU patients (n = 14). (C) RT-PCR analysis of ACE2 was performed on platelets from COVID-19 patients (5 healthy donors and 25 COVID-19 patients). Representative tracing from 2 COVID-19 patients (green and red). HepG2 cells served as a positive control (blue). No reverse transcriptase (RT) served as a negative control (gray). Reactions were performed in triplicate. (D) Immunoblot and densitometric quantification of ACE2 and β-actin expression in platelets isolated from healthy donors and ICU COVID-19 patients (n = 4). Leukocytes (white blood cells [WBC]) served as a positive control. (E) RT-PCR analysis of the SARS-CoV-2 N1 gene in platelets from non-ICU and ICU SARS-CoV-2–infected patients (n = 25). Representative tracing from 1 COVID-19 patient positive for SARS-CoV-2 mRNA presence (red) and 1 patient with SARS-CoV-2 mRNA absence (green). mRNA isolated from tracheal aspirates served as a positive control (blue). No reverse transcriptase served as a negative control (gray). Reactions were performed in triplicate. One PCR band at the correct size was observed in the tracheal aspirates and in the positive platelet samples. The PCR band in the platelet sample was confirmed by Sanger sequencing to be the N1 gene. ***P < .001. ΔRN, fluorescence intensity normalized to baseline.
Figure 3.
Figure 3.
Platelet counts, MPV, and platelet morphology in COVID-19 patients are normal. (A) Platelet counts and (B) MPV are represented from COVID-19 non-ICU (red, n = 17) and ICU (blue, n = 12) patients. The reference range provided by ARUP is below the figure and represented by the shaded region. (C) TPO levels were measured by enzyme-linked immunosorbent assay (ELISA) in healthy donors (n = 7) and COVID-19 patients (non-ICU, n = 15; ICU, n = 14,). Blue dots indicate ICU patients whereas red dots indicate non-ICU patients. (D) Platelets were isolated from healthy donors (n = 4; HD; top panel) and COVID-19 patients (n = 4; COVID-19; bottom panel) and adhered to Acylar coated with poly-lysine and imaged with a JEOL JEM-1011 electron microscope. Digital images were captured with a side-mounted Advantage HR CCD camera. Lower power magnifications are provided on the left with representative images from 2 separate donors or patients on the right at a higher magnification. Scale bars: black bars = 1 μm; white bars = 0.5 μm. *P < .05. K/uL indicates ×103/μL.
Figure 4.
Figure 4.
COVID-19 alters platelet activation and increases PLAs. (A) Platelet P-selectin expression was measured in whole blood by flow cytometry at baseline in 17 healthy donors and 5 non-ICU and 12 ICU COVID-19 patients. Blue dots indicate ICU patients; red dots indicate non-ICU patients. (B) P-selectin expression was measured after activation by platelet agonists. P2Y12 activation was induced by 1 ng/mL 2MeSADP, PAR1 was activated through 2.5 μM SFLLRN (TRAP), and GPVI was activated with 1 ng/mL CRP (N = 17-18 per group). Blue dots indicate ICU patients; red dots indicate non-ICU patients. (C-F) PLAs were measured in whole blood by flow cytometry. N = 7 for the healthy donors and N = 12-13 for COVID-19 patients. Blue dots indicate ICU patients; red dots indicate non-ICU patients. (C) PNAs were identified as CD66b+CD41+ leukocytes. (D) Platelet-monocyte aggregates were identified as CD14+CD41+ leukocytes. (E) Platelet-CD4 T-cell aggregates were identified as CD3+CD4+CD41+ leukocytes. (F) Platelet-CD8 T-cell aggregates were identified as CD3+CD8+CD41+ leukocytes. *P < .05; ***P < .001
Figure 5.
Figure 5.
Platelets from COVID-19 patients are hyperreactive. Platelets were isolated from healthy donors and COVID-19 patients. (A) Representative aggregation traces of washed platelets from ICU COVID-19 patients or healthy donors treated with 2MeSADP (5 nM or 50 nM), thrombin (0.05 U/mL or 0.5 U/mL), or collagen (2 μg/mL or 10 μg/mL) under stirring conditions at 37°C. (B) Quantification of maximal aggregation (N = 7-10 for healthy donors; N = 10-15 for SARS-CoV-2–infected patients). Blue dots indicate ICU patients; red dots indicate non-ICU patients. (C) Washed platelets were allowed to spread on fibrinogen (scale bar, 50 μm; phalloidin stain). (D) After 30 minutes, platelets were fixed and platelet spreading was quantified. (E) Washed platelets were allowed to spread on collagen (scale bar, 50 μm; phalloidin stain). (F) After 30 minutes, platelets were fixed and platelet spreading was quantified. Images are representative for 9 independent experiments. Blue dots indicate ICU patients; red dots indicate non-ICU patients. *P < .05; **P < .01; ***P < .001.
Figure 6.
Figure 6.
The MAPK-signaling pathway is upregulated in COVID-19 ICU patient platelets. (A) Washed platelets were stimulated with 2MeSADP (1 ng/mL), thrombin (0.05 U/mL), collagen (2 μg/mL), or vehicle under stirring conditions for 5 minutes. Platelet proteins were separated by sodium dodecyl sulfate polyacrylamide gel electrophoresis (SDS-PAGE), subsequent western blots were probed for phosphorylated extracellular signal-regulated kinase 1/2 (ERK1/2) (T202/Y204), phosphorylated p38 (T180/Y182), and phosphorylated eIF4E (Ser209). β-actin was used as loading control. (B) Quantification of phosphorylation normalized to β-actin (n = 4). (C) Washed platelets were stimulated with 2MeSADP (1 ng/mL), thrombin (0.05 U), collagen (2 μg/mL), or vehicle under stirring conditions for 5 minutes. Platelet proteins were separated by SDS-PAGE, subsequent western blots were probed for phosphorylated cytosolic phospholipase A2 (cPLA2) (Ser505). (D) Quantification of phosphorylation normalized to β-actin (n = 4). (E) Thromboxane B2 (TXB2) generation was measured as described in “Methods” (n = 8). *P < .05; **P < .01.

Comment in

References

    1. Connors JM, Levy JH. COVID-19 and its implications for thrombosis and anticoagulation. Blood. 2020;135(23):2033-2040. - PMC - PubMed
    1. Lax SF, Skok K, Zechner P, et al. . Pulmonary arterial thrombosis in COVID-19 with fatal outcome: results from a prospective, single-center, clinicopathologic case series [published online ahead of print 14 May 2020]. Ann Intern Med. doi:10.7326/M20-2566. - PMC - PubMed
    1. Stefan N, Birkenfeld AL, Schulze MB, Ludwig DS. Obesity and impaired metabolic health in patients with COVID-19. Nat Rev Endocrinol. 2020;16(7):341-342. - PMC - PubMed
    1. Poissy J, Goutay J, Caplan M, et al. ; Lille ICU Haemostasis COVID-19 group . Pulmonary embolism in patients with COVID-19: awareness of an increased prevalence. Circulation. 2020;142(2):184-186. - PubMed
    1. Guo L, Rondina MT. The era of thromboinflammation: platelets are dynamic sensors and effector cells during infectious diseases. Front Immunol. 2019;10:2204. - PMC - PubMed

Publication types

MeSH terms