. 2020 Oct 22;136(17):1907-1918.
doi: 10.1182/blood.2019004560.

Mutational and phenotypic characterization of hereditary hemorrhagic telangiectasia

Affiliations

Mutational and phenotypic characterization of hereditary hemorrhagic telangiectasia

Claire L Shovlin et al. Blood. .

Abstract

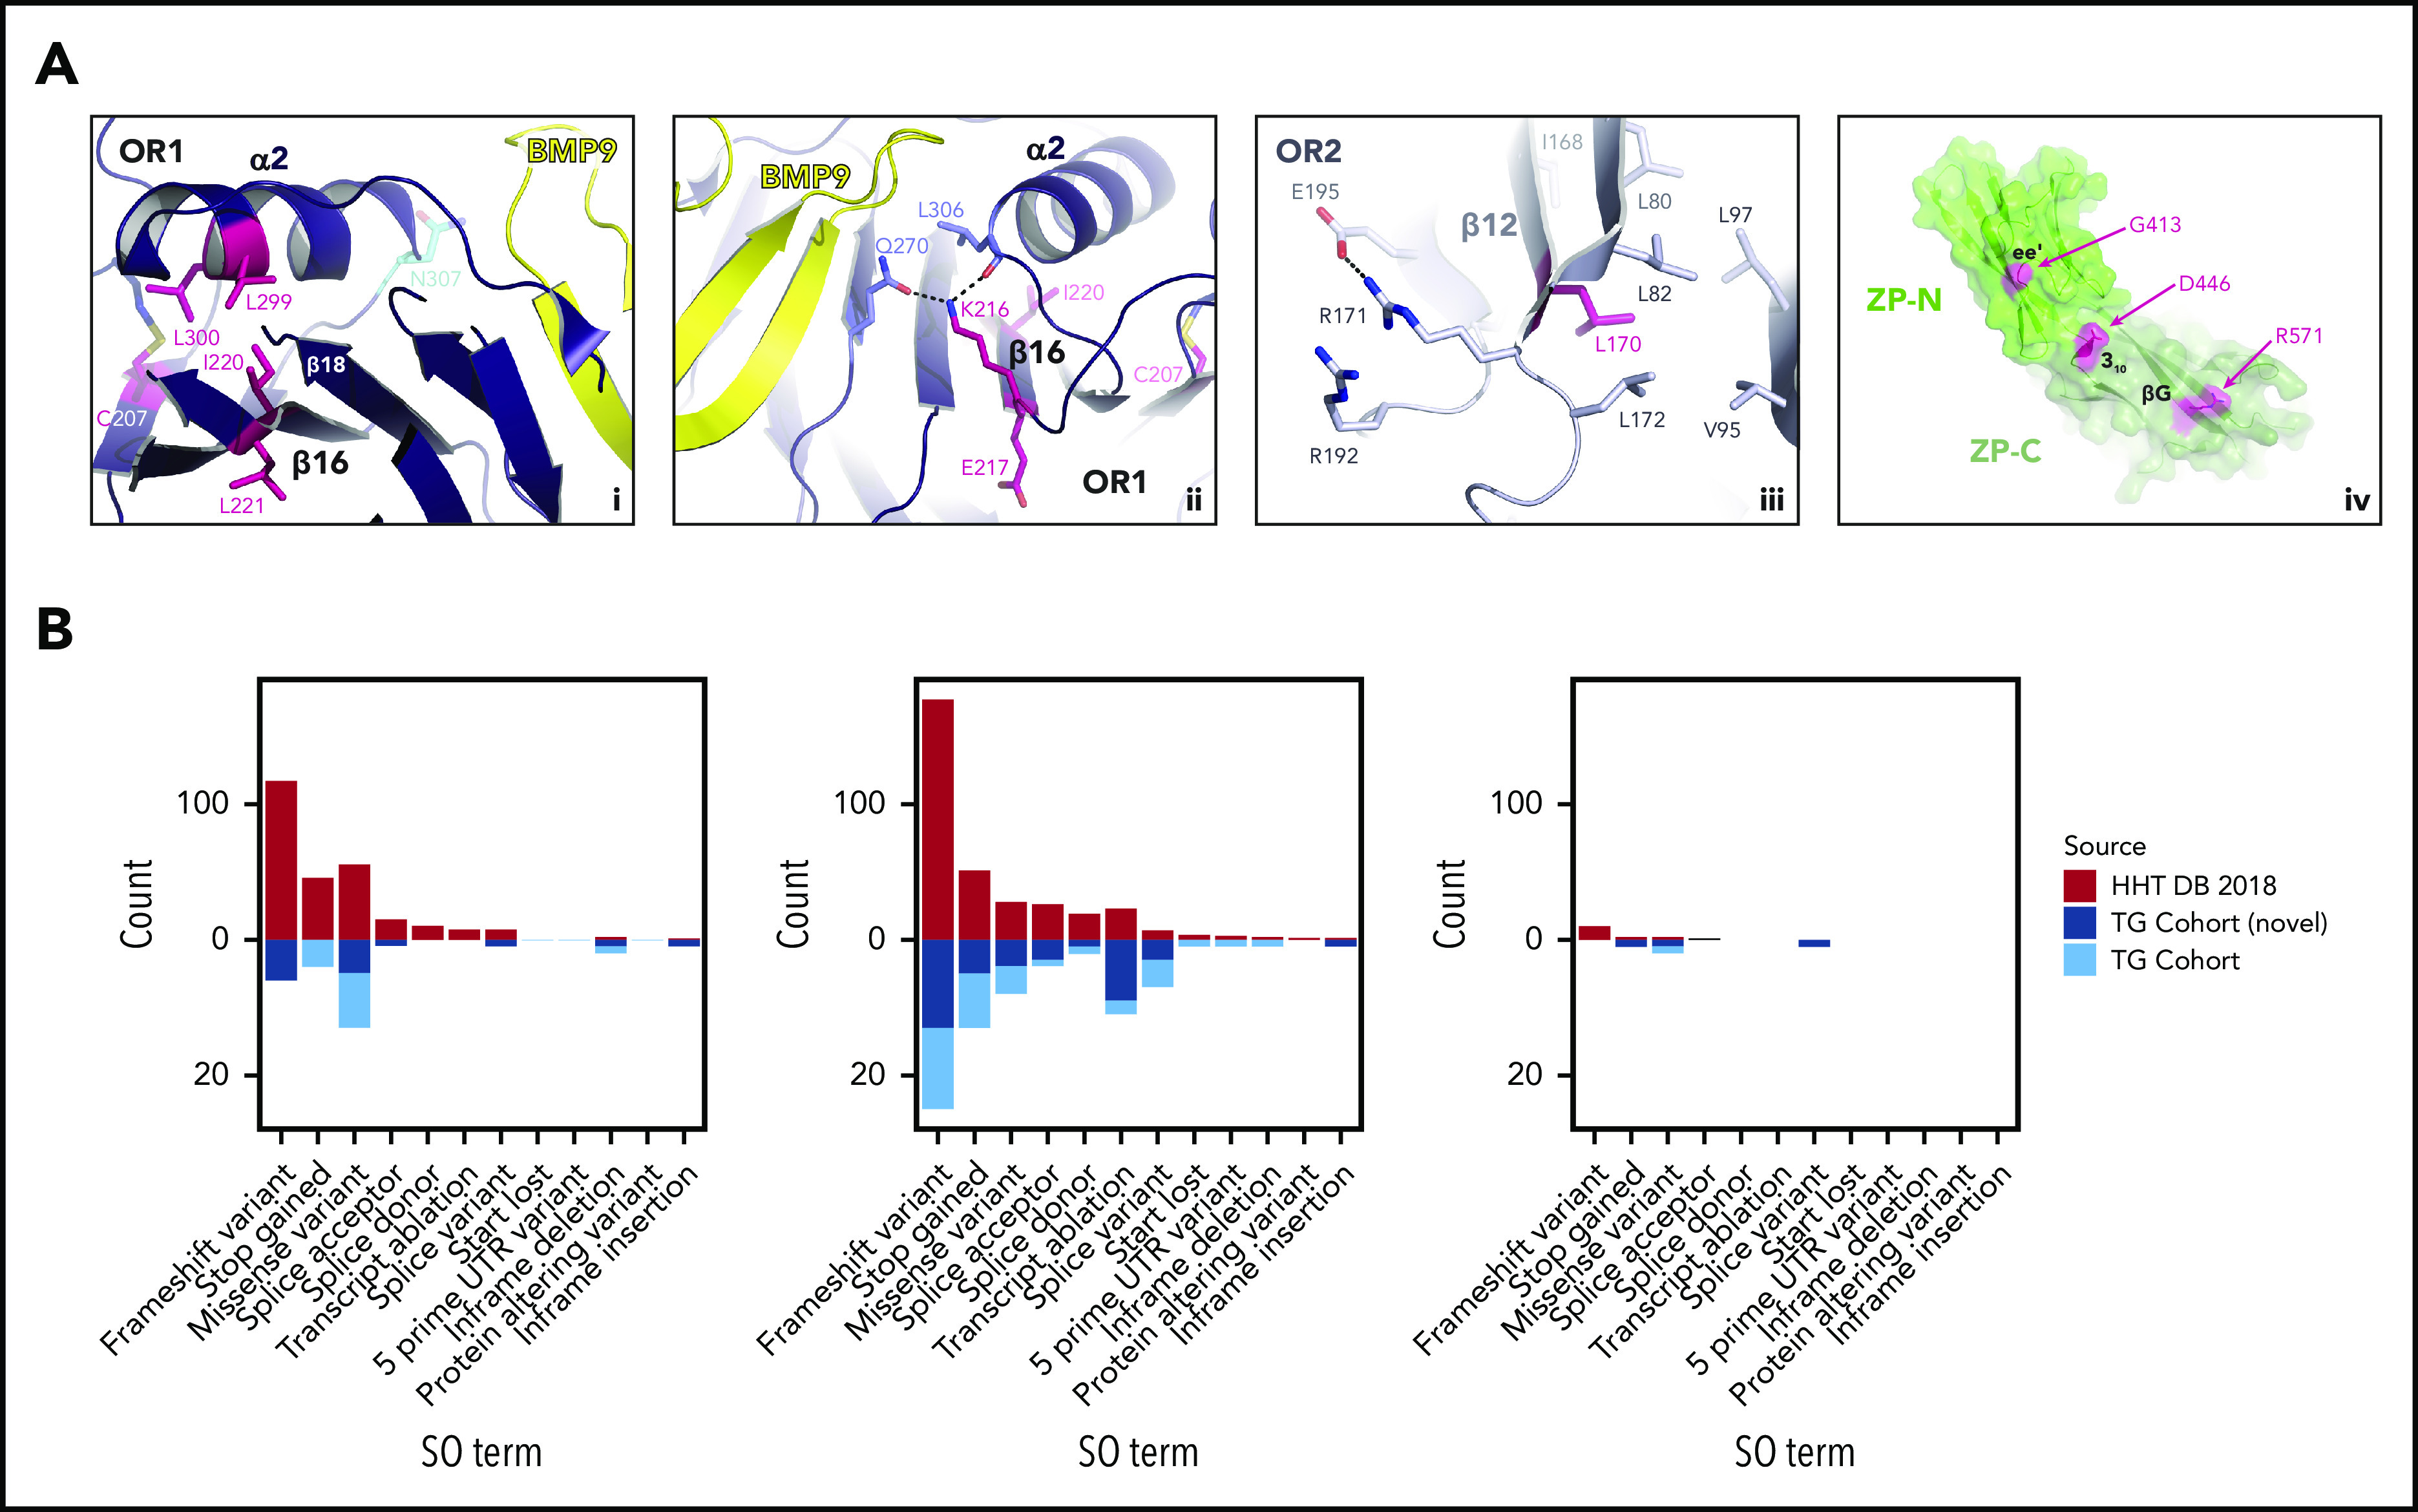
Hereditary hemorrhagic telangiectasia (HHT) is an autosomal dominant vascular dysplasia. Care delivery for HHT patients is impeded by the need for laborious, repeated phenotyping and gaps in knowledge regarding the relationships between causal DNA variants in ENG, ACVRL1, SMAD4 and GDF2, and clinical manifestations. To address this, we analyzed DNA samples from 183 previously uncharacterized, unrelated HHT and suspected HHT cases using the ThromboGenomics high-throughput sequencing platform. We identified 127 rare variants across 168 heterozygous genotypes. Applying modified American College of Medical Genetics and Genomics Guidelines, 106 variants were classified as pathogenic/likely pathogenic and 21 as nonpathogenic (variant of uncertain significance/benign). Unlike the protein products of ACVRL1 and SMAD4, the extracellular ENG amino acids are not strongly conserved. Our inferences of the functional consequences of causal variants in ENG were therefore informed by the crystal structure of endoglin. We then compared the accuracy of predictions of the causal gene blinded to the genetic data using 2 approaches: subjective clinical predictions and statistical predictions based on 8 Human Phenotype Ontology terms. Both approaches had some predictive power, but they were insufficiently accurate to be used clinically, without genetic testing. The distributions of red cell indices differed by causal gene but not sufficiently for clinical use in isolation from genetic data. We conclude that parallel sequencing of the 4 known HHT genes, multidisciplinary team review of variant calls in the context of detailed clinical information, and statistical and structural modeling improve the prognostication and treatment of HHT.


Conflict of interest statement

Conflict-of-interest disclosure: The authors declare no competing financial interests.

Figures

None
Graphical abstract
Figure 1.
Figure 1.
Technical evaluation and output from the HHT panel of the ThromboGenomics platform. (A) Histogram of mean coverage in 183 samples over the targeted regions of the 4 targeted genes (ENG, ACVRL1, SMAD4, and GDF2). (B) The fraction of targeted exonic bases covered at the specified depth (0×-50×) or more, averaged over samples. The solid black line indicates exonic bases and demonstrates that on average, 99.99% of the targeted exonic bases are covered by at least 50 sequencing reads. The dashed red line indicates bases that lie within Human Genome Mutation Database (HGMD) variants and demonstrates that they are all covered by at least 50 sequencing reads. (C) Coverage profile for the GDF2 gene encoding BMP9 on chromosome 10, mapped against the corresponding transcript (orange), which indicates the position and size of the 2 GDF2 exons. The pale blue bars indicate the targeted region, and the 3 traces above indicate the median and 5th and 95th percentile coverage across the locus. Despite the high coverage, no pathogenic variants were identified in the cohort. Equivalent plots for ENG, ACVRL1, and SMAD4 are provided in supplemental Figure 2. (D) Schematic of the classification of the 127 distinct candidate variants identified by the platform. VUS, variant of uncertain significance.
Figure 2.
Figure 2.
Normalized amino acid conservation scores across ENG, ALK1, and SMAD4. The degree of evolutionary conservation of each amino acid in the human protein sequences of ENG (NM_0011147, 658 amino acids), ACVRL1 (NM_000020.2, 503 amino acids), and SMAD4 (NM_005359.5, 552 amino acids), plotted against the respective amino acid position. The conservation, reflecting the retention of macromolecular function, was plotted as normalized conservation scores and 95% confidence intervals (CIs) obtained using ConSurf. Lower scores indicate greater conservation. In all 6 plots, the selected amino acids are plotted in red, and all other amino acids are plotted in black. (A) Amino acid sites of pathogenic or likely pathogenic HHT missense substitutions from current cohort 1 (n = 18), cohort 2 (n = 15), and the 2018 HHT Mutation Database (n = 64) are plotted in red, and all other amino acids are plotted in black. Amino acids in which pathogenic or likely pathogenic variants were located were more conserved than amino acids with nonpathogenic variants (ENG mean difference, −0.52 [95% CI, −0.81 to −0.24; P = .00072]; ACVRL1, −0.77 [95% CI, −0.94 to −0.61; P = 6.6x10⁻¹⁵]; SMAD4, −0.80 [95% CI, −0.89 to −0.72; P = 3.9 × 10−61]). Notably, however, not all pathogenic or likely pathogenic variants were at conserved sites, and for endoglin, the normalized conservation scores and CIs were highly variable in regions other than the transmembrane domain (near amino acid 600) and the C terminal cytoplasmic tail (amino acids 635-658). (B) Amino acid sites of likely benign missense substitutions in the gnomAD database plotted in red vs all other amino acids, plotted in black. Amino acids in which benign variants were sited were less conserved than other amino acids (ENG mean difference, 0.34 [95% CI, 0.19-0.50; P = 1.6 × 10⁻⁵]; ACVRL1, 0.48 [95% CI, 0.30-0.66; P = 3.2 × 10⁻⁷]; SMAD4, 0.54 [95% CI, 0.32-0.77; P = 3.0 × 10⁻⁶]).
Figure 3.
Figure 3.
Molecular characterization of sequence variants. (A) Mapping of ENG missense substitutions in cohorts 1 and 2 onto the crystal structures of ENG and its complex with BMP9. Proteins are shown in cartoon representation (BMP9, yellow), with specific ENG amino acids depicted as sticks and carbon atoms colored dark magenta and N-glycosylation site N307 colored cyan. (i) The relative position of 6 pathogenic or likely pathogenic variants described in the present report (Cys[C]207Tyr, Leu[L]300Pro, Leu[L]299Arg, Ile[I]220Asn, Leu[L]221Gln, and Asn[N]307Leu) defines a hotspot for pathogenic or likely pathogenic missense variants, which includes the α-helix 2 of the ENG OR1 domain, the C-terminal end of which lies close to the BMP9 binding site. (ii) A second hotspot for pathogenic or likely pathogenic variants (Lys[K]216Glu and Glu[E]217delinsGluAla) affects residues at the N-terminal end of OR1 β-strand 16, including Lys216, which connects the C-terminal end of α-helix 2 to Gln270 at the ENG/BMP9 interface via hydrogen bond interactions. This view, which depicts amino acid contacts as observed in the high-resolution structure of ENG OR, also shows the location of the Cys(c)207Tyr and Ile(I)220Asn mutations from a different perspective. (iii) The duplication of Leu(L)170 affects residues in the core of ENG OR2, where Leu170 is involved in a number of hydrophobic interactions. The duplication most likely affects the folding of ENG, rather than directly affecting its function; the insertion could either disrupt the register of the N-terminal part of OR2 β-strand 12 or, more likely, cause an additional residue to be accommodated in the loop that follows the same β-strand. In the latter case, the extra Leu would take the place of Arg(R)171, disrupting a hydrogen bond with Glu(E)195 as well as a stacking interaction with Arg(R)192. Moreover, by shifting Arg(R)171 to take the place of Leu(L)172, the duplication would replace a hydrophobic residue with a charged residue at the bottom of the hydrophobic core of the OR2 β-sandwich. (iv) Three variants that are benign in terms of HHT pathogenesis (Gly413Asp, Asp446Gly, and Arg571His) affect residues that are all exposed on the same face of the ENG ZP module. The 3 variants were independently assigned as benign without reference to the tertiary structure because of their presence in the same HHT DNA as an ENG nonsense (stop), splice, or frameshift variant, respectively. (B) Bar plot of the number of pathogenic or likely pathogenic variants in the HHT Mutation Database (DB) and in cohort 1, broken down by sequence ontology (SO) term in ENG, ACVRL1, and SMAD4. The upper bars give the number in the HHT Mutation DB in 2018 (620 variants in total); the lower bars give the number in cohort 1, with novel variants highlighted in dark blue (106 variants in total). TG, ThromboGenomics; UTR, untranslated region.
Figure 4.
Figure 4.
Phenotypic prediction accuracy for samples with pathogenic variants. (A) The predicted (triangle) and observed (circle) frequencies of 8 a priori discriminatory HPO terms in cohorts 1 and 2. (B) Predicted causal gene displayed for each of the observed HHT genotypes in cohort 1, for clinician prediction using all HPO terms (upper panel; additional details in supplemental Table 5), and automated prediction through Bayesian modeling of the 8 discriminatory HPO terms (lower panel; additional details in supplemental Methods, supplemental Figure 4, and supplemental Table 6).
Figure 5.
Figure 5.
Quantitative red cell traits. (A) Distributions of quantitative red cell traits in HHT and control populations: total red blood cell count (left), hematocrit (center), and hemoglobin (right) plotted for the HHT patients (1 measurement per patient, proband, and affected family members from cohorts 1 and 2) above the respective INTERVAL population distribution from 50 000 blood donors (1 result per donor). Upper panel, males; lower panel, females. Although the median values are similar, it should be noted that HHT cases had a higher proportion of extreme red cell values (both high and low) relative to healthy controls; for red cell count, hematocrit, and hemoglobin, respectively, the proportion of HHT patients within the fifth to 95th sex-stratified percentiles of the INTERVAL ranges were only 66%, 61%, and 50% for males and 64%, 55%, and 48% for females, respectively (all P values <.0001). (B) Relationships with bleeding and hypoxemia in HHT cohort. Patients with more severe blood losses (bleeders) were defined by a bleeding score ≥4 and subcategorized by the presence (purple symbols) or absence (blue symbols) of pulmonary AVMs (PAVMs), which impair gas exchange, resulting in lower arterial partial pressure of oxygen and hence lower SaO2. Patients with lower bleeding scores were also categorized by the presence (green) and absence (red) of PAVMs. The graphs (upper panel, males; lower panel, females) plot total red blood cell count (left), hematocrit (center), and hemoglobin (right) against same-day SaO2 measured by finger oximetry for 10 minutes standing using 1 measurement per patient (proband and affected family members). Note that in all 6 analyses, the patients with greater bleeding (red and purple) tended to have lower red blood cell indices (P < .0001 in all cases), and there was a superimposed anticorrelation between the red cell indices and SaO2 (P < .0001 in all cases). (C) SaO2 in HHT patients. Histograms of SaO2 in ACVRL1 and ENG cases. (D) Bleeding score in HHT patients. Histograms of bleeding scores in ACVRL1 and ENG cases.

References

    1. VASCERN-HHT European Reference Network For Vascular Diseases Hereditary hemorrhagic telangiectasia. www.orpha.net/consor/cgi-bin/Disease_Search.php?lng=EN&data_id=236. Accessed 24 August 2020.
    1. Bideau A, Brunet G, Heyer E, Plauchu H, Robert J-M. An abnormal concentration of cases of Rendu-Osler disease in the Valserine valley of the French Jura: a genealogical and demographic study. Ann Hum Biol. 1992;19(3):233-247. - PubMed
    1. Dakeishi M, Shioya T, Wada Y, et al. . Genetic epidemiology of hereditary hemorrhagic telangiectasia in a local community in the northern part of Japan. Hum Mutat. 2002;19(2):140-148. - PubMed
    1. Kjeldsen AD, Vase P, Green A. Hereditary haemorrhagic telangiectasia: a population-based study of prevalence and mortality in Danish patients. J Intern Med. 1999;245(1):31-39. - PubMed
    1. Donaldson JW, McKeever TM, Hall IP, Hubbard RB, Fogarty AW. The UK prevalence of hereditary haemorrhagic telangiectasia and its association with sex, socioeconomic status and region of residence: a population-based study. Thorax. 2014;69(2):161-167. - PubMed

Publication types

MeSH terms