. 2020 Dec;68(12):2613-2630.
doi: 10.1002/glia.23873. Epub 2020 Jun 23.

ASCL1 regulates neurodevelopmental transcription factors and cell cycle genes in brain tumors of glioma mouse models

Affiliations

ASCL1 regulates neurodevelopmental transcription factors and cell cycle genes in brain tumors of glioma mouse models

Tou Yia Vue et al. Glia. 2020 Dec.

Abstract

Glioblastomas (GBMs) are incurable brain tumors with a high degree of cellular heterogeneity and genetic mutations. Transcription factors that normally regulate neural progenitors and glial development are aberrantly coexpressed in GBM, conferring cancer stem-like properties to drive tumor progression and therapeutic resistance. However, the functional role of individual transcription factors in GBMs in vivo remains elusive. Here, we demonstrate that the basic-helix-loop-helix transcription factor ASCL1 regulates transcriptional targets that are central to GBM development, including neural stem cell and glial transcription factors, oncogenic signaling molecules, chromatin modifying genes, and cell cycle and mitotic genes. We also show that the loss of ASCL1 significantly reduces the proliferation of GBMs induced in the brain of a genetically relevant glioma mouse model, resulting in extended survival times. RNA-seq analysis of mouse GBM tumors reveal that the loss of ASCL1 is associated with downregulation of cell cycle genes, illustrating an important role for ASCL1 in controlling the proliferation of GBM.

Keywords: ASCL1; brain tumor; glioma development; mouse model; transcription factor function.


Conflict of interest statement

The authors declare no potential conflict of interest.

Figures

FIGURE 1
FIGURE 1
Neurodevelopmental transcription factors ASCL1, OLIG2, and SOX2 are highly expressed in the majority of GBMs. (a) Schematic of PDX‐GBMs (R548 and R738) grown orthotopically in the brains of NOD‐SCID mice. (b and c) H&E staining showing tumor is a high‐grade glioma and is migrating across the corpus callosum (CC). (d–m) Immunofluorescence showing coexpression of ASCL1 with OLIG2 (e‐g), SOX2 (h‐j), and Ki67 (k‐m) in the PDX‐GBMs. (n and o) Quantification of the percentage of DAPI+ tumor cells that are ASCL1+, OLIG2+, or SOX2+ (n), and the percentage of ASCL1+ tumor cells that are also Ki67+, OLIG2+, or SOX2+ (n). N = 4 PDX‐GBM. (p–r) Box whisker plot of RNA‐seq data from 164 TCGA Primary GBMs and 5 normal brain samples (Brennan et al., 2013) demonstrating that ASCL1 (p), OLIG2 (q), and SOX2 (r) are highly expressed in the majority of GBM subtypes but are low in MS subtype and normal brain (Br). GBM subtype was determined using the 840 GBM Subtype Signature Genes (Verhaak et al., 2010). CL, classical; MS, mesenchymal; NE, neural; PN, proneural. Mixed GBM subtype express multiple subtype signatures. Scale bar is 1 mm for (b) and 50 μm for (c–m), and 12.5 μm for all insets in (d–m) [Color figure can be viewed at wileyonlinelibrary.com]
FIGURE 2
FIGURE 2
ASCL1 binds to target genes in GBMs involved in glial development, cell cycle progression, and cancer. (a) Heatmap of ASCL1 ChIP‐seq signal intensity ±2.5 kb around 13,457 combined peaks identified in the genome of the PDX‐GBMs. Blue rectangles indicate statistically significant peaks called by Homer. See Supporting Information Table S1 for genomic coordinates of the ASCL1 binding sites. (b) ChIP‐seq tracks of genomic regions surrounding canonical ASCL1 target genes DLL1, DLL3, NOTCH1, HES5, HES6, and INSM1. Asterisks indicate ASCL1 binding peaks meeting statistical criteria. (c) De novo motif analysis shows enrichment of bHLH E‐box, SOX, and FOXO motifs directly beneath ASCL1 binding peaks. (d) Venn diagram of intersecting genes (8,791, red oval) associated with ASCL1 binding peaks in the PDX‐GBMs with the top 10% of genes (2,136, green oval) positively correlated (Spearmann corr < 0.4) with ASCL1 expression using RNA‐seq data of 164 TCGA GBM samples. The overlap of 1,106 genes (yellow area) defines ASCL1 target genes, which included all the canonical ASCL1 target genes. See Supporting Information Tables [Link], [Link]. (e–h) ChIP‐seq tracks of ASCL1 binding peaks at loci of neurodevelopmental and glial transcription factors (e), cell cycle and mitotic genes (f), chromatin modifying genes (g), and oncogenic signal transduction genes (h). (i) Heatmap and dendrogram illustrating relative expression of 1,106 ASCL1 putative target genes in GBM subtypes using RNA‐seq of 164 TCGA primary GBM samples (Brennan et al., 2013). Note that ASCL1 target‐positive GBMs include all subtypes except mesenchymal, while ASCL1 target‐negative GBMs include all mesenchymal and some neural and mixed GBM subtypes. (j) Gene set over‐representation analysis of 1,106 ASCL1 putative‐target genes using ConsensusPathDB (cpdb.molgen.mpg.de). Biologically relevant enriched pathways are illustrated. Size of circle indicates the number of genes per pathway, size of edge indicates degree of gene overlaps between the pathways, and color indicates database sources. The number of ASCL1 putative‐target genes over‐represented in each pathway, and respective p‐value are indicated. See Supporting Information Table S5 for complete gene set over‐representation analysis [Color figure can be viewed at wileyonlinelibrary.com]
FIGURE 3
FIGURE 3
ASCL1, OLIG2, and SOX2 are highly expressed in early stage tumor cells of the glioma mouse model. (a–c) A neonatal pup from Glast CreERT2/+ crossed with R26R LSL‐tdTomato reporter administered with tamoxifen at E14.5. Note that tdTomato fluorescence is specific to the CNS and highest in the cerebral cortex (a and c). (d) Schematic of an early stage brain tumor surrounding the right subventricular zone (SVZ) of a Glast CreERT2/+ ;Nf1 F/F ; F/F ;R26R LSL‐YFP mouse, administered with tamoxifen at E14.5 and harvested at P45. (e–l) Immunofluorescence shows high YFP reporter expression (e–h), OPC marker PDGFRα (i and j) and astrocyte marker GFAP (k and l) in tumor areas indicated in (d). (m–w) Higher magnification of tumor area indicated in (h) showing ASCL1 (m and n), OLIG2 (o and p), SOX2 (q and r), and PDGFRα (s and t) colocalized with YFP in tumor cells, but not GFAP (u) or the neuronal marker NEUN (v, w). (x) H&E staining of an early stage tumor exhibiting characteristic feature of glioma. Scale bar is 5 mm for (a and b); 3 mm for (c); 100 μm for (e–l); 25 μm for (m–t, v–x); and 12.5 μm for (u) [Color figure can be viewed at wileyonlinelibrary.com]
FIGURE 4
FIGURE 4
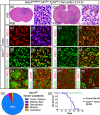
Expression of ASCL1, OLIG2, and SOX2 are maintained in mice with terminal stage glioma tumors. (a and b) H&E staining of Ascl1 WT terminal stage tumors harvested at P90 and P120. Higher magnification insets show that tumors are high‐grade gliomas. Arrowheads indicate pseudopalisading cellular features consistent with GBM. (c–n) Immunofluorescence of Ascl1 WT tumor tissue. ASCL1 is present in the majority of DAPI+ tumor cells (c and d) and colocalizes with Ki67 (e and f), OLIG2 (g and h), and SOX2 (I and j). PDGFRα (k) and GFAP (l) are also coexpressed in ASCL1+ or SOX2+ tumor cells respectively, but not S100β (m) and NEUN (n). (o) Incidence of tumors observed in different brain regions is indicated. Over 90% of tumors are found in the cortex and striatum (N = 29). (p) Survival curve of Ascl1 WT tumor (N = 29) bearing mice and Cre‐negative control mice (N = 19). Dotted line indicates median survival of 102 days for Ascl1 WT tumor mice. Scale bar is 1 mm for whole brain section and 30 μm for insets in (a and b); and 25 μm for (c–n) [Color figure can be viewed at wileyonlinelibrary.com]
FIGURE 5
FIGURE 5
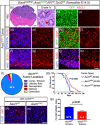
Survival of glioma tumor bearing mice is increased in the absence of ASCL1. (a) H&E staining of an Ascl1 CKO tumor exhibiting pseudopalisading cellular features of Grade IV glioma (arrowheads, insets). (b–k) Immunofluorescence of Ascl1 CKO tumor. GFP, driven by an Ascl1 GFP knock‐in allele, is present in tumor cells but ASCL1 is absent (b and c), indicating efficient deletion of Ascl1 Floxed allele. Expression of OLIG2 and PDGFRα (d and e), SOX10 and NG2 (f and g), GFAP (h and i), and SOX2 (j and k) are unaffected. (l) Incidence of Ascl1 CKO tumors observed in the different brain regions. Over 90% of tumors are found in the cortex and striatum area similar to Ascl1 WT tumors. (m) Survival curve of Ascl1 CKO versus Ascl1 HET tumor mice. Median survival is significantly improved for Ascl1 CKO (122 days) compared to Ascl1 HET (104 days) tumor mice (dotted lines). Note that survival of Ascl1 HET is very similar to Ascl1 WT tumor mice (note blue line is the same as Figure 4p). (n–p) Immunofluorescence (n and o) and quantification of the percentage of Ki67+/DAPI+ tumor cells (p) for Ascl1 WT and Ascl1 CKO tumors. Scale bar is 1 mm for whole brain section and 30 μm for insets in (a); 25 μm for (b–k); and 50 μm for (n and o) [Color figure can be viewed at wileyonlinelibrary.com]
FIGURE 6
FIGURE 6
Cell cycle genes are downregulated in Ascl1 CKO glioma tumors of the mouse model. (a) RNA‐seq tracks at the Ascl1 locus of Ascl1 WT and Ascl1 CKO tumors isolated from brain regions indicated. Note that Exon 1 and 2 of the Ascl1 mRNA, flanked by Lox P sites, are absent in Ascl1 CKO tumors. (b) Multidimensional scaling (MDS) plot of RNA‐seq of Ascl1 WT and Ascl1 CKO tumors versus CNS cell types (Zhang et al., 2014). Ascl1 WT and Ascl1 CKO tumors are more similar to each other than to any of the CNS cell types. AS, astrocytes; OPC, oligodendrocyte precursor cells; NFO, newly formed oligodendrocytes; MO, myelinating oligodendrocytes; WC, whole cortex. See Table S6 for normalized gene expression (RPKM) in Ascl1 WT and Ascl1 CKO tumors. (c) Heatmap and dendrograms using the top 50 CNS cell lineage signature genes for each cell type (Zhang et al., 2014). Dendrograms on top show that Ascl1 WT and Ascl1 CKO tumors express signature genes that are more similar to OPCs than to the other CNS cell types. (d–g) Box and whisker plots of ASCL1 putative‐target genes in Ascl1 WT and Ascl1 CKO tumors. Canonical targets of ASCL1 (d), glial transcription factors (e), and mitotic, chromatin modifying, and cell cycle genes (g) are expressed at lower level while neural stem cell/Sox genes (f) are bidirectionally affected in Ascl1 CKO compared to Ascl1 WT tumors. Asterisks indicate target genes significantly altered (p < .05, Wilcox test). (h–i) Heatmap and dendrograms of differentially expressed genes (DEGs) in Ascl1 WT and Ascl1 CKO GBMs. DEGs consist of ASCL1 putative direct targets (h) (see Table S7) and indirect target DEGs (FDR < 0.05) (i) (see Table S8). (j) Gene‐set‐enrichment‐analysis (GSEA) showing that cell cycle genes are enriched in the downregulated genes in Ascl1 CKO compared to Ascl1 WT tumors [Color figure can be viewed at wileyonlinelibrary.com]

Similar articles

Cited by

References

    1. Alcantara Llaguno, S. , Chen, J. , Kwon, C. H. , Jackson, E. L. , Li, Y. , Burns, D. K. , … Parada, L. F. (2009). Malignant astrocytomas originate from neural stem/progenitor cells in a somatic tumor suppressor mouse model. Cancer Cell, 15(1), 45–56. 10.1016/j.ccr.2008.12.006 - DOI - PMC - PubMed
    1. Alcantara Llaguno, S. R. , Wang, Z. , Sun, D. , Chen, J. , Xu, J. , Kim, E. , … Parada, L. F. (2015). Adult lineage‐restricted CNS progenitors specify distinct glioblastoma subtypes. Cancer Cell, 28(4), 429–440. 10.1016/j.ccell.2015.09.007 - DOI - PMC - PubMed
    1. Andersen, J. , Urban, N. , Achimastou, A. , Ito, A. , Simic, M. , Ullom, K. , … Guillemot, F. (2014). A transcriptional mechanism integrating inputs from extracellular signals to activate hippocampal stem cells. Neuron, 83(5), 1085–1097. 10.1016/j.neuron.2014.08.004 - DOI - PMC - PubMed
    1. Babu, R. , Komisarow, J. M. , Agarwal, V. J. , Rahimpour, S. , Iyer, A. , Britt, D. , … Adamson, C. (2016). Glioblastoma in the elderly: The effect of aggressive and modern therapies on survival. Journal of Neurosurgery, 124(4), 998–1007. 10.3171/2015.4.JNS142200 - DOI - PubMed
    1. Bao, S. , Wu, Q. , McLendon, R. E. , Hao, Y. , Shi, Q. , Hjelmeland, A. B. , … Rich, J. N. (2006). Glioma stem cells promote radioresistance by preferential activation of the DNA damage response. Nature, 444(7120), 756–760. 10.1038/nature05236 - DOI - PubMed

Publication types

MeSH terms

Substances