. 2020 Jun 23;17(6):e1003132.
doi: 10.1371/journal.pmed.1003132. eCollection 2020 Jun.

Distinct subtypes of polycystic ovary syndrome with novel genetic associations: An unsupervised, phenotypic clustering analysis

Affiliations

Distinct subtypes of polycystic ovary syndrome with novel genetic associations: An unsupervised, phenotypic clustering analysis

Matthew Dapas et al. PLoS Med. .

Abstract

Background: Polycystic ovary syndrome (PCOS) is a common, complex genetic disorder affecting up to 15% of reproductive-age women worldwide, depending on the diagnostic criteria applied. These diagnostic criteria are based on expert opinion and have been the subject of considerable controversy. The phenotypic variation observed in PCOS is suggestive of an underlying genetic heterogeneity, but a recent meta-analysis of European ancestry PCOS cases found that the genetic architecture of PCOS defined by different diagnostic criteria was generally similar, suggesting that the criteria do not identify biologically distinct disease subtypes. We performed this study to test the hypothesis that there are biologically relevant subtypes of PCOS.

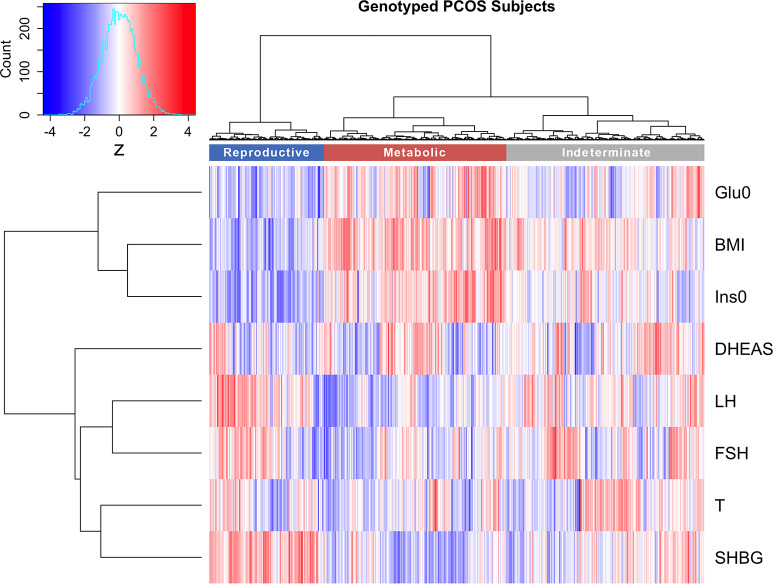
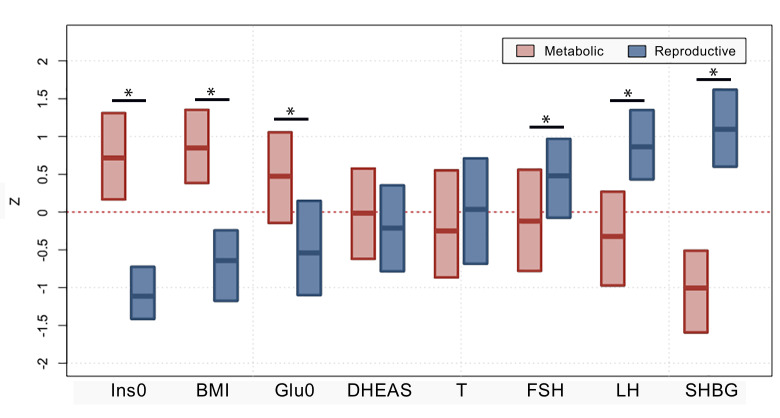
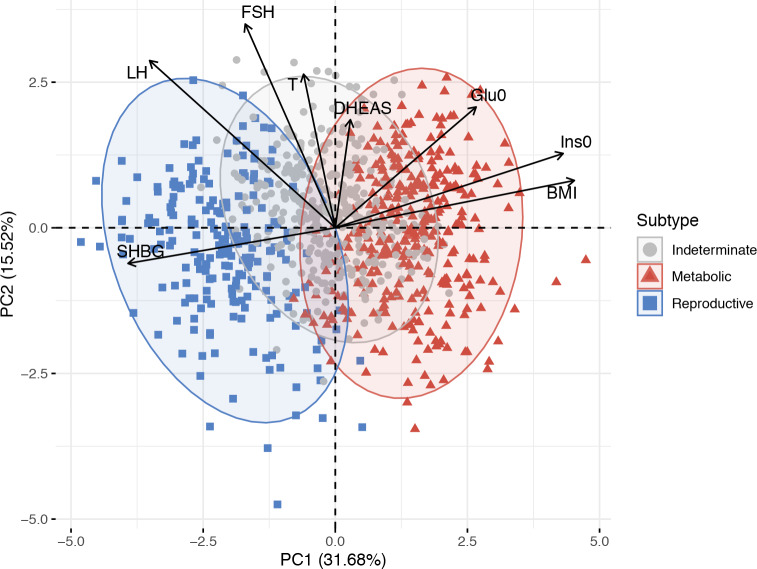
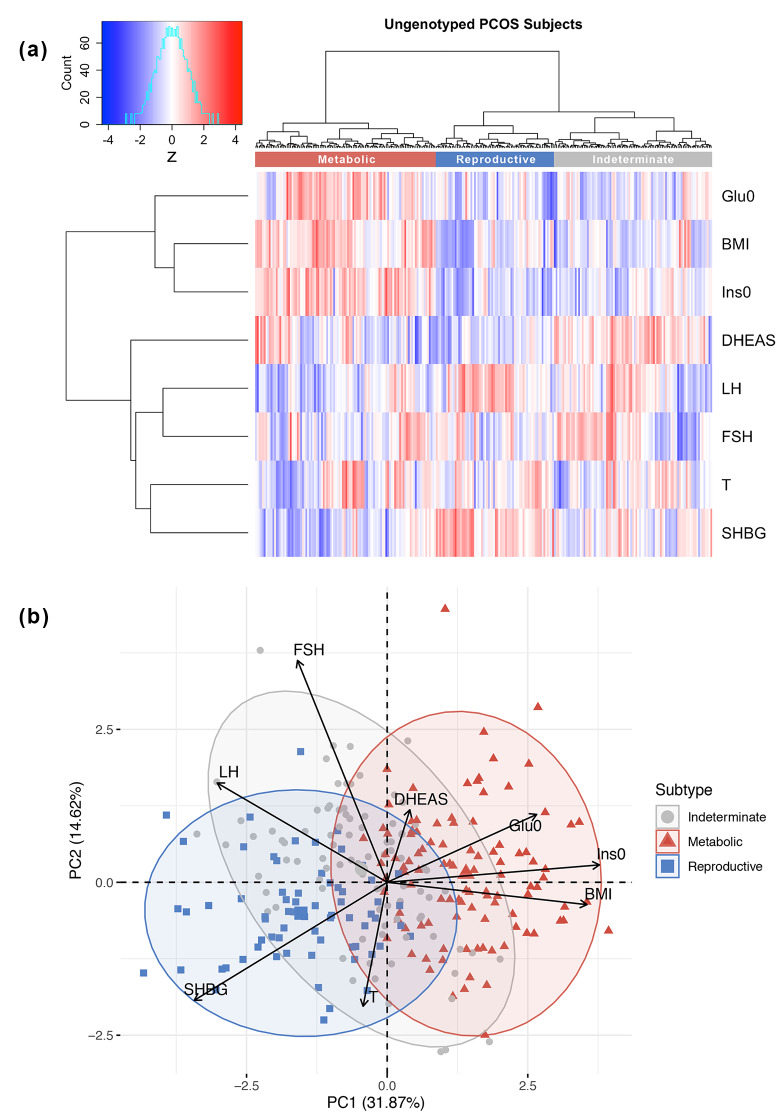
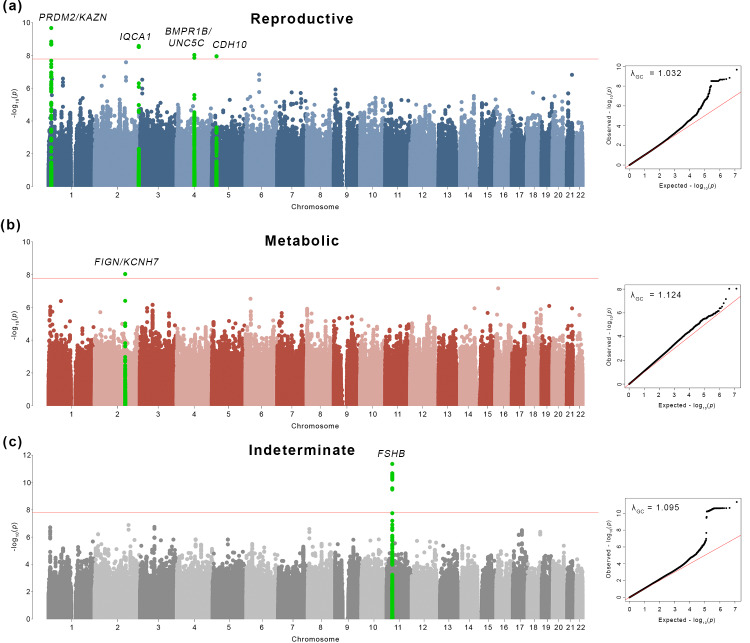
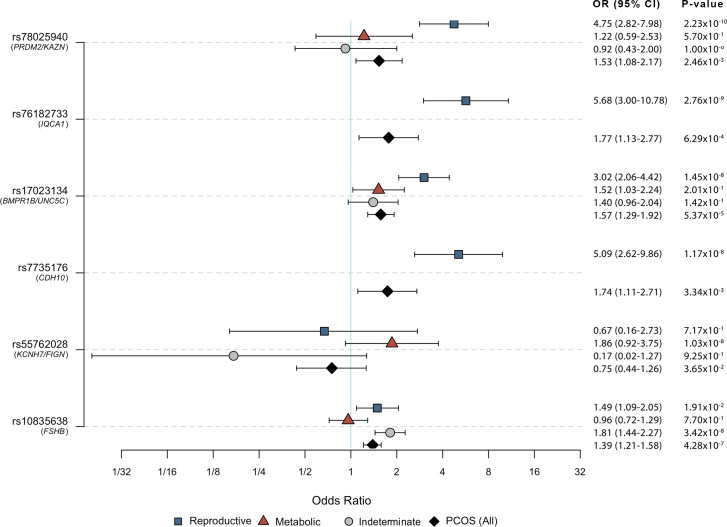
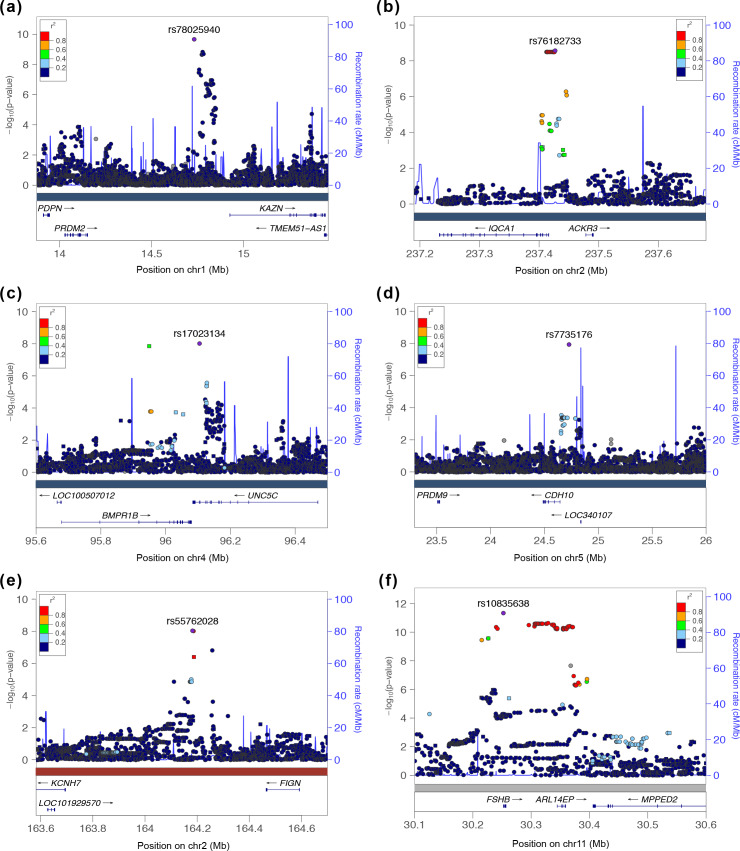
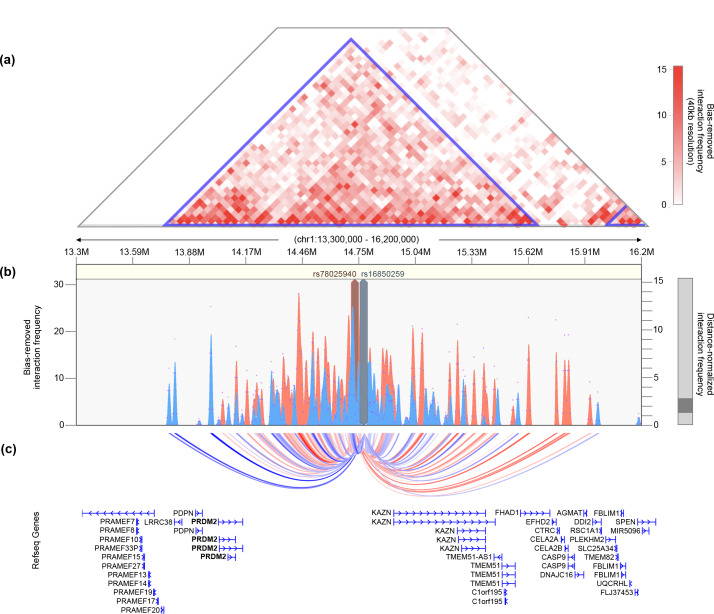
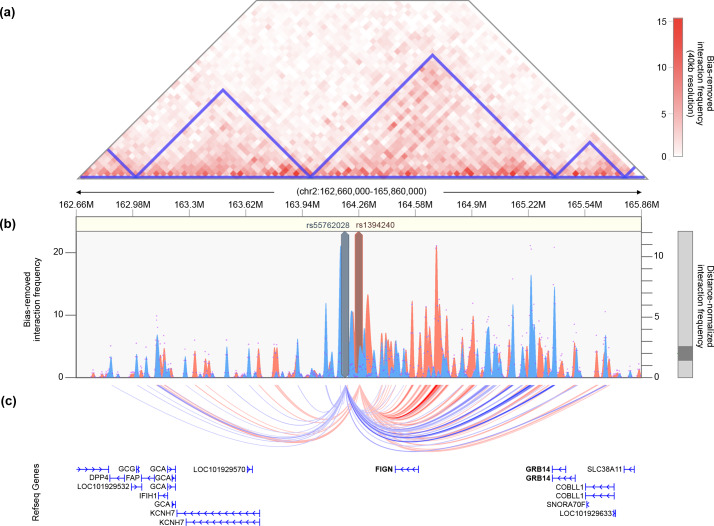
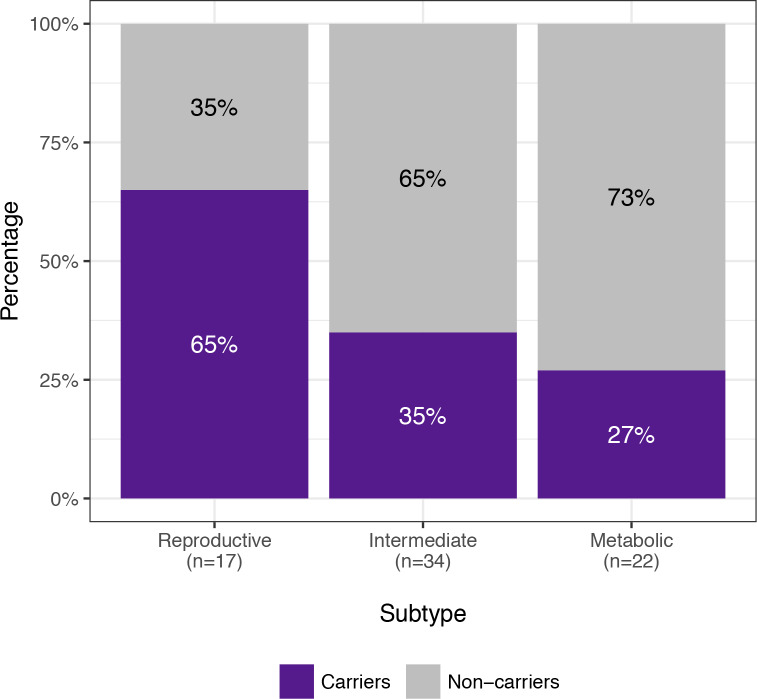
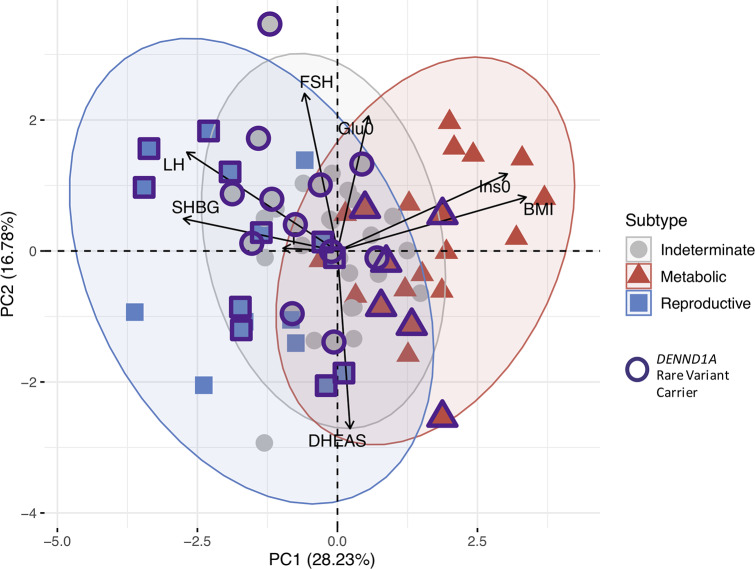
Methods and findings: Using biochemical and genotype data from a previously published PCOS genome-wide association study (GWAS), we investigated whether there were reproducible phenotypic subtypes of PCOS with subtype-specific genetic associations. Unsupervised hierarchical cluster analysis was performed on quantitative anthropometric, reproductive, and metabolic traits in a genotyped cohort of 893 PCOS cases (median and interquartile range [IQR]: age = 28 [25-32], body mass index [BMI] = 35.4 [28.2-41.5]). The clusters were replicated in an independent, ungenotyped cohort of 263 PCOS cases (median and IQR: age = 28 [24-33], BMI = 35.7 [28.4-42.3]). The clustering revealed 2 distinct PCOS subtypes: a "reproductive" group (21%-23%), characterized by higher luteinizing hormone (LH) and sex hormone binding globulin (SHBG) levels with relatively low BMI and insulin levels, and a "metabolic" group (37%-39%), characterized by higher BMI, glucose, and insulin levels with lower SHBG and LH levels. We performed a GWAS on the genotyped cohort, limiting the cases to either the reproductive or metabolic subtypes. We identified alleles in 4 loci that were associated with the reproductive subtype at genome-wide significance (PRDM2/KAZN, P = 2.2 × 10⁻¹⁰; IQCA1, P = 2.8 × 10⁻⁹; BMPR1B/UNC5C, P = 9.7 × 10⁻⁹; CDH10, P = 1.2 × 10⁻⁸) and one locus that was significantly associated with the metabolic subtype (KCNH7/FIGN, P = 1.0 × 10⁻⁸). We developed a predictive model to classify a separate, family-based cohort of 73 women with PCOS (median and IQR: age = 28 [25-33], BMI = 34.3 [27.8-42.3]) and found that the subtypes tended to cluster in families and that carriers of previously reported rare variants in DENND1A, a gene that regulates androgen biosynthesis, were significantly more likely to have the reproductive subtype of PCOS. Limitations of our study were that only PCOS cases of European ancestry diagnosed by National Institutes of Health (NIH) criteria were included, the sample sizes for the subtype GWAS were small, and the GWAS findings were not replicated.

Conclusions: In conclusion, we have found reproducible reproductive and metabolic subtypes of PCOS. Furthermore, these subtypes were associated with novel, to our knowledge, susceptibility loci. Our results suggest that these subtypes are biologically relevant because they appear to have distinct genetic architecture. This study demonstrates how phenotypic subtyping can be used to gain additional insights from GWAS data.


Conflict of interest statement

I have read the journal's policy and the authors of this manuscript have the following competing interests: GNN owns equity in RenalytixAI, Inc., and receives financial compensation as a consultant and advisory board member for RenalytixAI. GNN has received operational funding from Goldfinch Bio and consulting fees from BioVie Inc. and GLG consulting in the past three years. GNN is a former member of the advisory board of PulseData and received consulting fees for their services and continues to hold equity interests in PulseData.

Figures

Fig 1
Fig 1. Hierarchical clustering of genotyped PCOS clustering cohort.
Hierarchical clustering of 893 genotyped PCOS cases according to adjusted quantitative traits revealed 2 distinct phenotypic subtypes, a “reproductive” cluster, and a “metabolic” cluster; the remaining cases were designated as “indeterminate.” The reproductive, metabolic, and indeterminate clusters are shown in the color bar as dark blue, dark red, and gray, respectively. Heatmap colors correspond to trait z-scores, as shown in the frequency histogram in which red indicates high values and blue indicates low values for each trait. The row-based dendrogram represents relative distances between trait distributions and was calculated using the same approach as the subject-based clustering. BMI, body mass index; DHEAS, dehydroepiandrosterone sulfate; FSH, follicle-stimulating hormone; Glu0, fasting glucose; Ins0, fasting insulin; LH, luteinizing hormone; PCOS, polycystic ovary syndrome; SHBG, sex hormone binding globulin; T, testosterone.
Fig 2
Fig 2. Phenotypic trait distributions in reproductive and metabolic subtypes.
Median and IQRs are shown for normalized, adjusted quantitative trait distributions of genotyped PCOS cases with reproductive or metabolic subtype. The figure illustrates the traits for which the subtypes differ significantly with an asterisk (*Bonferroni adjusted Wilcoxon, Padj < 0.05): Ins0, BMI, Glu0, FSH, LH, and SHBG. BMI, body mass index; DHEAS, dehydroepiandrosterone sulfate; FSH, follicle-stimulating hormone; Glu0, fasting glucose; Ins0, fasting insulin; IQR, interquartile range; LH, luteinizing hormone; PCOS, polycystic ovary syndrome; SHBG, sex hormone binding globulin; T, testosterone.
Fig 3
Fig 3. PCA plot of quantitative traits for genotyped PCOS clustering cohort.
Genotyped PCOS cases are plotted on the first 2 PCs of the adjusted quantitative trait data and colored according to their identified subtype. Subtype clusters are shown as 95% concentration ellipses, assuming bivariate normal distributions. The relative magnitude and direction of trait correlations with the PCs are shown with black arrows. BMI, body mass index; DHEAS, dehydroepiandrosterone sulfate; FSH, follicle-stimulating hormone; Glu0, fasting glucose; Ins0, fasting insulin; LH, luteinizing hormone; PC, principal component; PCA, principal component analysis; PCOS, polycystic ovary syndrome; SHBG, sex hormone binding globulin; T, testosterone.
Fig 4
Fig 4. Clustering of ungenotyped PCOS clustering cohort.
(a) Hierarchical clustering of 263 ungenotyped PCOS cases according to adjusted quantitative traits replicate reproductive (blue), metabolic (red), and unclassified (gray) clusters. Heatmap colors correspond to trait z-scores. (b) PCA plot of ungenotyped PCOS cases replicate results from genotyped cases. (a) Hierarchical clustering of 263 ungenotyped PCOS cases according to adjusted quantitative traits replicate reproductive (blue), metabolic (red), and indeterminate (gray) clusters. Heatmap colors correspond to trait z-scores. (b) PCA plot of ungenotyped PCOS cases replicate results from genotyped cases. BMI, body mass index; DHEAS, dehydroepiandrosterone sulfate; FSH, follicle-stimulating hormone; Glu0, fasting glucose; Ins0, fasting insulin; LH, luteinizing hormone; PC, principal component; PCA, principal component analysis; PCOS, polycystic ovary syndrome; SHBG, sex hormone binding globulin; T, testosterone.
Fig 5
Fig 5. Genome-wide association results.
Manhattan plots for (a) reproductive, (b) metabolic, and (c) indeterminate PCOS subtypes. The red horizontal line indicates genome-wide significance (P ≤ 1.67 × 10⁻⁸). Genome-wide significant loci are colored in green and labeled according to nearby gene(s). Quantile–quantile plots with genomic inflation factor, λGC, are shown adjacent to corresponding Manhattan plots. PCOS, polycystic ovary syndrome.
Fig 6
Fig 6. Risk allele ORs in PCOS and PCOS subtypes.
ORs with 95% CIs and association P-values from the Stage 1 discovery sample are shown for each subtype-specific risk allele identified in this study relative to the corresponding values for the other subtypes and for PCOS disease status in general (includes all subtypes). Some SNPs were not characterized in certain subtypes because of low allele counts or low imputation confidence. CI, confidence interval; OR, odds ratio; PCOS, polycystic ovary syndrome; SNP, single nucleotide polymorphism.
Fig 7
Fig 7. Regional association plots of genome-wide significant loci.
Regional plots of association (left y-axis) and recombination rates (right y-axis) for the chromosomes (a) 1p36.21, (b) 2q37.3, (c) 4q22.3, (d) 5p14.2–p14.1, (e) 2p24.2–q24.3, and (f) 1p14.1 loci after imputation. The lead SNP in each locus is labeled and marked in purple. All other SNPs are color coded according to the strength of LD with the top SNP (as measured by r2 in the European 1000 Genomes data). Imputed SNPs are plotted as circles and genotyped SNPs as squares. LD, linkage disequilibrium; SNP, single nucleotide polymorphism.
Fig 8
Fig 8. Chromatin interaction map of PRDM2/KAZN locus.
(A) Shown is the interaction frequency heatmap from chr1:13,300,000–16,200,000 in ovarian tissue. The color of the heatmap indicates the level of normalized interaction frequencies with blue triangles indicating topological association domains. (B) One-to-all interaction plots are shown for the lead SNP (rs78025940; shown in red) and lead genotyped SNP (rs16850259; shown in blue) as bait. Y-axes on the left and the right measure bias-removed interaction frequency (red and blue bar graphs) and distance-normalized interaction frequency (magenta dots), respectively. (C) The arc representation of significant interactions for distance-normalized interaction frequencies ≥ 2 is displayed relative to the RefSeq-annotated genes in the locus. chr, chromosome; SNP, single nucleotide polymorphism.
Fig 9
Fig 9. Chromatin interaction map of KCHN7/FIGN locus.
(A) Shown is the interaction frequency heatmap from chr2:162,660,000 to 165,860,000 in pancreatic tissue. The color of the heatmap indicates the level of normalized interaction frequencies with blue triangles indicating topological association domains. (B) One-to-all interaction plots are shown for the lead SNP (rs13401392; shown in blue) and second-leading SNP (rs1394240; shown in red) as bait. Y-axes on the left and the right measure bias-removed interaction frequency (blue and red bar graphs) and distance-normalized interaction frequency (magenta dots), respectively. (C) The arc representation of significant interactions for distance-normalized interaction frequencies ≥ 2 is displayed relative to the RefSeq-annotated genes in the locus. chr, chromosome; SNP, single nucleotide polymorphism.
Fig 10
Fig 10. DENND1A rare variant carriers by subtype.
The proportions of affected women with DENND1A rare variants in families with PCOS are shown by classified subtype. Women with the reproductive subtype were significantly more likely to carry one or more of the DENND1A rare variants compared to other women with PCOS (P = 0.03). PCOS, polycystic ovary syndrome.
Fig 11
Fig 11. PCA of affected women in PCOS families showing DENND1A rare variant carriers.
Affected women in PCOS families are plotted on the first 2 PCs of the adjusted quantitative trait data and colored according to their classified subtype. Markers outlined in bold represent DENND1A rare variant carriers. Subtype clusters are shown as 95% concentration ellipses, assuming bivariate normal distributions. The relative magnitude and direction of trait correlations with the PCs are shown with black arrows. BMI, body mass index; DHEAS, dehydroepiandrosterone sulfate; FSH, follicle-stimulating hormone; Glu0, fasting glucose; Ins0, fasting insulin; LH, luteinizing hormone; PC, principal component; PCA, principal component analysis; PCOS, polycystic ovary syndrome; SHBG, sex hormone binding globulin; T, testosterone.

References

    1. Manolio TA, Collins FS, Cox NJ, Goldstein DB, Hindorff LA, Hunter DJ, et al. Finding the missing heritability of complex diseases. Nature. 2009;461(7265): 747–53. 10.1038/nature08494 - DOI - PMC - PubMed
    1. Boyle EA, Li YI, Pritchard JK. An expanded view of complex traits: From polygenic to omnigenic. Cell. 2017;169(7): 1177–86. 10.1016/j.cell.2017.05.038 - DOI - PMC - PubMed
    1. Wray NR, Wijmenga C, Sullivan PF, Yang J, Visscher PM. Common Disease Is More Complex Than Implied by the Core Gene Omnigenic Model. Cell. 2018;173(7): 1573–80. 10.1016/j.cell.2018.05.051 - DOI - PubMed
    1. Ringman JM, Goate A, Masters CL, Cairns NJ, Danek A, Graff-Radford N, et al. Genetic heterogeneity in Alzheimer disease and implications for treatment strategies. Curr Neurol Neurosci Rep. 2014;14(11): 499 10.1007/s11910-014-0499-8 - DOI - PMC - PubMed
    1. Flint J, Kendler KS. The genetics of major depression. Neuron. 2014;81(3): 484–503. 10.1016/j.neuron.2014.01.027 - DOI - PMC - PubMed

Publication types