. 2020 May 22:7:247.
doi: 10.3389/fmed.2020.00247. eCollection 2020.

Growth Rate and Acceleration Analysis of the COVID-19 Pandemic Reveals the Effect of Public Health Measures in Real Time

Affiliations

Growth Rate and Acceleration Analysis of the COVID-19 Pandemic Reveals the Effect of Public Health Measures in Real Time

Yuri Tani Utsunomiya et al. Front Med (Lausanne). .

Abstract

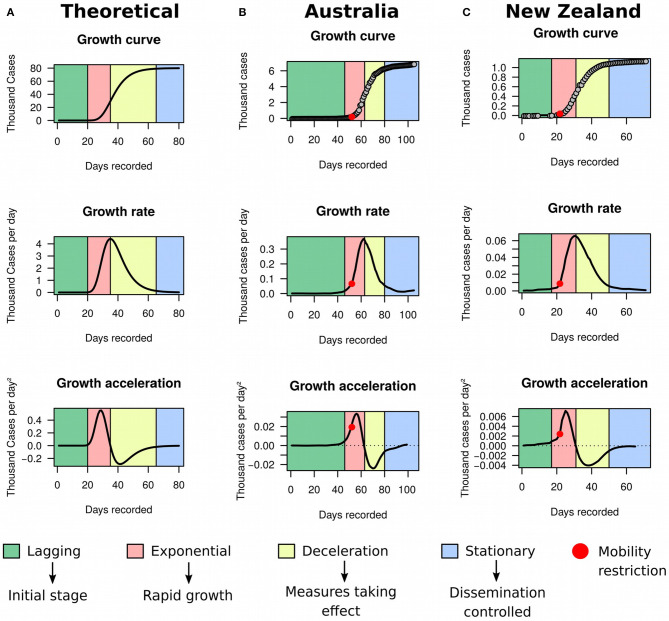
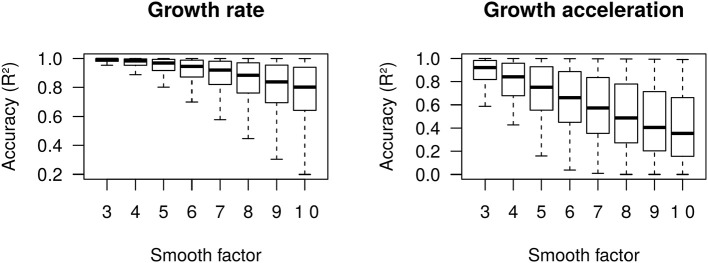
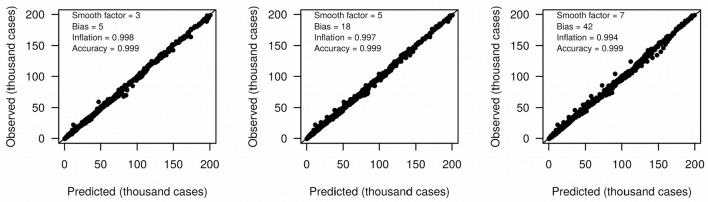
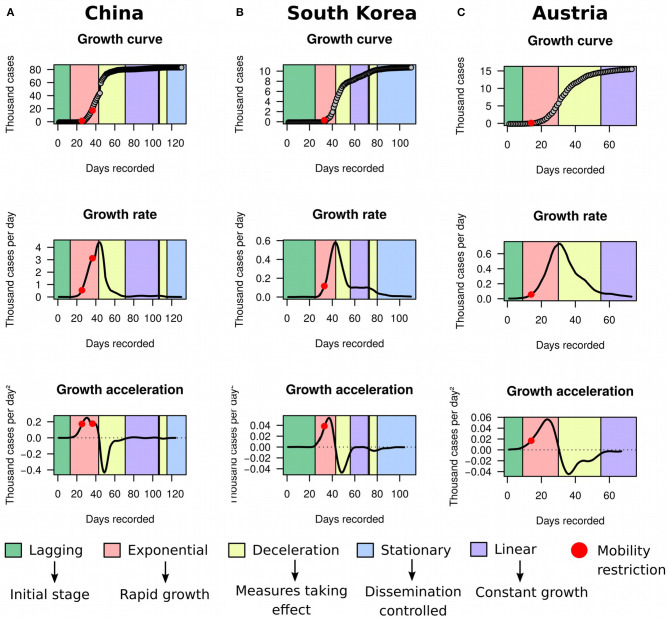
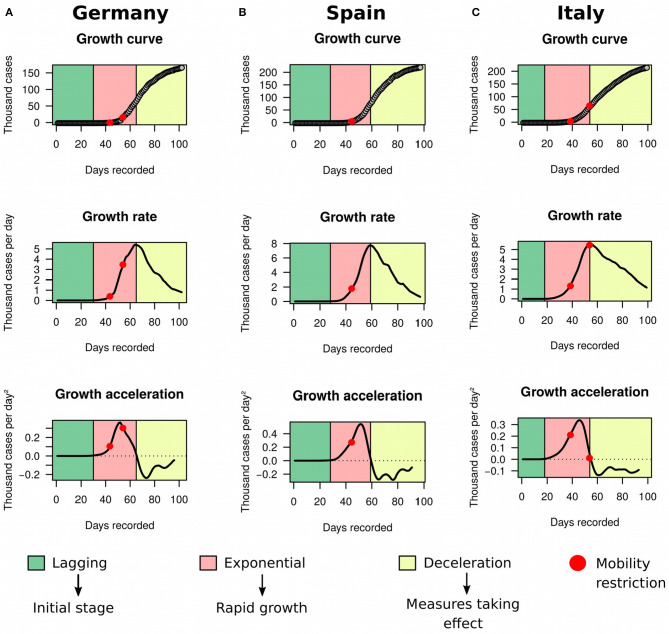
Background: Ending the COVID-19 pandemic is arguably one of the most prominent challenges in recent human history. Following closely the growth dynamics of the disease is one of the pillars toward achieving that goal. Objective: We aimed at developing a simple framework to facilitate the analysis of the growth rate (cases/day) and growth acceleration (cases/day2) of COVID-19 cases in real-time. Methods: The framework was built using the Moving Regression (MR) technique and a Hidden Markov Model (HMM). The dynamics of the pandemic was initially modeled via combinations of four different growth stages: lagging (beginning of the outbreak), exponential (rapid growth), deceleration (growth decay), and stationary (near zero growth). A fifth growth behavior, namely linear growth (constant growth above zero), was further introduced to add more flexibility to the framework. An R Shiny application was developed, which can be accessed at https://theguarani.com.br/ or downloaded from https://github.com/adamtaiti/SARS-CoV-2. The framework was applied to data from the European Center for Disease Prevention and Control (ECDC), which comprised 3,722,128 cases reported worldwide as of May 8th 2020. Results: We found that the impact of public health measures on the prevalence of COVID-19 could be perceived in seemingly real-time by monitoring growth acceleration curves. Restriction to human mobility produced detectable decline in growth acceleration within 1 week, deceleration within ~2 weeks and near-stationary growth within ~6 weeks. Countries exhibiting different permutations of the five growth stages indicated that the evolution of COVID-19 prevalence is more complex and dynamic than previously appreciated. Conclusions: These results corroborate that mass social isolation is a highly effective measure against the dissemination of SARS-CoV-2, as previously suggested. Apart from the analysis of prevalence partitioned by country, the proposed framework is easily applicable to city, state, region and arbitrary territory data, serving as an asset to monitor the local behavior of COVID-19 cases.

Keywords: Hidden Markov Model; coronavirus; growth curve analysis; mathematical modeling; moving regression; severe acute respiratory syndrome.


Figures

Figure 1
Figure 1
Growth rate and acceleration in Australia and New Zealand. (A) Theoretical model exemplified by simulated data using a three-parameters Gompertz model with an asymptote at 80,000, growth coefficient of 0.15, inflection time at 35, and time ranging from 1 to 80. (B) Fitted curves for Australia between January 25th and May 8th 2020. (C) Fitted curves for New Zealand between February 28th and May 8th 2020.
Figure 2
Figure 2
Accuracy (R2) of moving regression estimates of growth rate and growth acceleration from 50,000 simulated Gompertz growth curves.
Figure 3
Figure 3
Accuracy (R2) of moving regression predictions of next-day COVID-19 prevalence.
Figure 4
Figure 4
Growth rate and acceleration in China, South Korea, and Austria. (A) Fitted curves for China between December 31st 2019 and May 8th 2020. The first red dot marks the midpoint between January 23rd and 24th 2020, when a strict cordon sanitaire was imposed to Wuhan, Shanghai, Jiangsu, and Hainan. The second red dot pinpoints February 4th 2020, when the cordon was extended to a larger portion of the eastern part of China. (B) Fitted curves for South Korea between January 20th and May 8th 2020. The red dot is placed between February 20th and 21st, when a collection of restrictions to human mobility was imposed, including lockdown of Daegu city, suspension of flights, cancellation of mass gatherings, and lockdown of all South Korean military bases. (C) Fitted curves for Austria between February 26th and May 8th 2020. The red dot is placed on March 10th, when the Austrian government ordered children to stay at home and announced closure of universities and cancellation of public gatherings. The apparent stationary phase in these three countries was in reality classified as a mixture of linear growth, deceleration, and stationary stage by our framework.
Figure 5
Figure 5
Growth rate and acceleration in Germany, Spain and Italy. These three countries were in deceleration as of May 8th. (A) Germany determined school closing in early March (first red dot) and extended restrictions to movement and gatherings within the country by March 22nd (second red dot). (B) Spain declared state of emergency on March 14th (red dot). Acceleration decline started 1 week later. (C) Italy imposed a strict quarantine on March 10th 2020 (first red dot) and closure of borders on March 25th 2020 (second red dot).

References

    1. World Health Organization Coronavirus Disease (COVID-2019) Situation Reports. Available online at: https://www.who.int/emergencies/diseases/novel-coronavirus-2019/situatio... (accessed March 25, 2020).
    1. Coronaviridae Study Group of the International Committee on Taxonomy of Viruses . The species severe acute respiratory syndrome-related coronavirus: classifying 2019-nCoV and naming it SARS-CoV-2. Nat Microbiol. (2020) 5:536–44. 10.1038/s41564-020-0695-z - DOI - PMC - PubMed
    1. Andersen KG, Rambaut A, Lipkin WI, Holmes EC, Garry RF. The proximal origin of SARS-CoV-2. Nat Med. (2020) 26:450–2. 10.1038/s41591-020-0820-9 - DOI - PMC - PubMed
    1. Zhou P, Yang XL, Wang XG, Hu B, Zhang L, Zhang W, et al. . A pneumonia outbreak associated with a new coronavirus of probable bat origin. Nature. (2020) 579:270–3. 10.1038/s41586-020-2012-7 - DOI - PMC - PubMed
    1. Chen S, Yang J, Yang W, Wang C, Bärnighausen T. COVID-19 control in China during mass population movements at New Year. Lancet. (2020) 395:764–6. 10.1016/S0140-6736(20)30421-9 - DOI - PMC - PubMed