. 2020 Oct;159(4):1487-1503.e17.
doi: 10.1053/j.gastro.2020.06.031. Epub 2020 Jun 20.

IRE1A Stimulates Hepatocyte-Derived Extracellular Vesicles That Promote Inflammation in Mice With Steatohepatitis

Affiliations

IRE1A Stimulates Hepatocyte-Derived Extracellular Vesicles That Promote Inflammation in Mice With Steatohepatitis

Debanjali Dasgupta et al. Gastroenterology. 2020 Oct.

Erratum in

  • Correction.
    [No authors listed] [No authors listed] Gastroenterology. 2022 Apr;162(4):1363-1365. doi: 10.1053/j.gastro.2022.01.031. Epub 2022 Feb 3. Gastroenterology. 2022. PMID: 35122740 No abstract available.

Abstract

Background & aims: Endoplasmic reticulum to nucleus signaling 1 (ERN1, also called IRE1A) is a sensor of the unfolded protein response that is activated in the livers of patients with nonalcoholic steatohepatitis (NASH). Hepatocytes release ceramide-enriched inflammatory extracellular vesicles (EVs) after activation of IRE1A. We studied the effects of inhibiting IRE1A on release of inflammatory EVs in mice with diet-induced steatohepatitis.

Methods: C57BL/6J mice and mice with hepatocyte-specific disruption of Ire1a (IRE1αΔhep) were fed a diet high in fat, fructose, and cholesterol to induce development of steatohepatitis or a standard chow diet (controls). Some mice were given intraperitoneal injections of the IRE1A inhibitor 4μ8C. Mouse liver and primary hepatocytes were transduced with adenovirus or adeno-associated virus that expressed IRE1A. Livers were collected from mice and analyzed by quantitative polymerase chain reaction and chromatin immunoprecipitation assays; plasma samples were analyzed by enzyme-linked immunosorbent assay. EVs were derived from hepatocytes and injected intravenously into mice. Plasma EVs were characterized by nanoparticle-tracking analysis, electron microscopy, immunoblots, and nanoscale flow cytometry; we used a membrane-tagged reporter mouse to detect hepatocyte-derived EVs. Plasma and liver tissues from patients with NASH and without NASH (controls) were analyzed for EV concentration and by RNAscope and gene expression analyses.

Results: Disruption of Ire1a in hepatocytes or inhibition of IRE1A reduced the release of EVs and liver injury, inflammation, and accumulation of macrophages in mice on the diet high in fat, fructose, and cholesterol. Activation of IRE1A, in the livers of mice, stimulated release of hepatocyte-derived EVs, and also from cultured primary hepatocytes. Mice given intravenous injections of IRE1A-stimulated, hepatocyte-derived EVs accumulated monocyte-derived macrophages in the liver. IRE1A-stimulated EVs were enriched in ceramides. Chromatin immunoprecipitation showed that IRE1A activated X-box binding protein 1 (XBP1) to increase transcription of serine palmitoyltransferase genes, which encode the rate-limiting enzyme for ceramide biosynthesis. Administration of a pharmacologic inhibitor of serine palmitoyltransferase to mice reduced the release of EVs. Levels of XBP1 and serine palmitoyltransferase were increased in liver tissues, and numbers of EVs were increased in plasma, from patients with NASH compared with control samples and correlated with the histologic features of inflammation.

Conclusions: In mouse hepatocytes, activated IRE1A promotes transcription of serine palmitoyltransferase genes via XBP1, resulting in ceramide biosynthesis and release of EVs. The EVs recruit monocyte-derived macrophages to the liver, resulting in inflammation and injury in mice with diet-induced steatohepatitis. Levels of XBP1, serine palmitoyltransferase, and EVs are all increased in liver tissues from patients with NASH. Strategies to block this pathway might be developed to reduce liver inflammation in patients with NASH.

Keywords: ER Stress; Exosome; Lipotoxicity; Macrophage.


Figures

Figure 1.
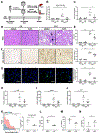
Figure 1.. Pharmacological IRE1A inhibition attenuates NASH.
A) Schematic depicting 4μ8C or DMSO treatment in FFC-fed mice. B) Relative mRNA expression of spliced Xbp1; C) EV counts in plasma; D) Representative H&E stained images (black arrows indicate inflammatory foci; E) Serum ALT; F) Representative images of IHC for galectin-3 and its quantification; G) Representative images of TUNEL stained liver sections and its quantification; relative mRNA expression of H) Cd68, I) Lgals3, and J) Ly6c in CD- and FFC-fed mice treated with 4μ8C (n=5 each). K) Flow cytometry data showing CD11b+F4/80+Ly6C+cells in livers and Ly6C+ cells (%) in CD11b+F4/80+ population in livers (n=3 each). Plasma levels of L) TNF-α, M) IL1β, and N) IL10 (n=5 each) in 4μ8C or DMSO treated FFC-fed mice. Two-tailed Student’s t-test was used for statistical analyses. Scale bar=50 μm.
Figure 2.
Figure 2.. Hepatocyte-specific Ire1a knock out attenuates NASH.
A) Schematic depicting FFC-fed hepatocyte-specific Ire1a knock out (Ire1aΔhep) or wildtype control (Ire1aloxP/loxP) mice. B) Relative mRNA expression of spliced Xbp1; C) Plasma EV counts; D) Representative H&E stained images (black arrows indicate inflammatory foci); E) Serum ALT; F) Representative images of galectin-3 IHC and its quantification; G) Representative images of TUNEL stained liver sections and its quantification; H) Relative mRNA expressions of Cd68, Lgals3, and Ly6c (n=5 each). I) Flow cytometry data showing CD11b+F4/80+Ly6C+ cells in livers and Ly6C+cells (%) in total CD11b+F4/80+ cell population (n=3 each). Plasma levels of J) TNF-α, K) IL1β, and L) IL10 (n=5 each) in FFC-fed Ire1aΔhep or Ire1aloxP/loxP mice. Two-tailed Student’s t-test was used for statistical analyses. Scale bar=50 μm.
Figure 3.
Figure 3.. IRE1A induces the release of EVs from hepatocytes.
A) Plasma EV counts of AdB-gal or AdIRE1A transduced mice (n=10 AdB-gal, n=14 AdIRE1A). B) Plasma EV counts and C) Relative mRNA expression of spliced Xbp1 in liver of mice transduced with AdIRE1A and treated with 4μ8C or DMSO (n=6 each). D) EV size and E) Hepatocyte-origins of EVs by immuno-electron microscopy using ASGPR1 (10 nm beads) and CYP2E1 (15 nm beads) antibody-coated beads (scale bar=200 nm); F) Western blotting for exosome markers (Alix, Tsg101, CD81 and CD9) and hepatocyte marker ASGPR1 and G) their quantification in AdIRE1A or AdB-gal transduced mice (n=3 each). H) Plasma EV counts in ROSAmT/mG mice, transduced with AAV8-TBG-Cre and AdIRE1A or AdB-gal (n=4 each). Two-tailed Student’s t-test was used for statistical analyses.
Figure 4.
Figure 4.. IRE1A-stimulated EVs recruit monocyte-derived macrophages into the liver.
A) Schematic depicting the experimental design for EV transplantation. EVs from equal number of AdB-gal or AdIRE1A-transduced primary mouse hepatocytes (PMH) were transplanted into mice. Representative images and quantification of labelled EV-transplanted mice (n=3 each) at 0 hour and 4 hours to show the hepatic uptake of EVs. The images are scaled to show standardized uptake values (SUV). B) Representative images of galectin-3 IHC (scale bar equals 50 μm) and its quantification; C) Relative mRNA expressions of Cd68, Lgals3, and Ly6c (n=6 for B-gal EV transplanted mice, n=7 for IRE1A EV transplanted mice). D) Flow cytometry data showing CD11b+F4/80+Ly6C+cells in livers and Ly6C+cells (%) in total CD11b+F4/80+ cell population (n=3 each). Plasma levels of E) TNF-α, F) IL1β, and G) IL10 in both groups of EV-transplanted mice (n=5 each, cytokine levels were below detection level in some samples from each group). H) Representative BMDM migration plots in EV gradients at 2 hours. Cells highlighted in red are migrating up toward the positive end of the EV gradient. I) Migration velocity of BMDMs exposed to B-gal EVs or IRE1A EVs gradient and J) Accumulated distance (total path length) by BMDMs migrating in B-gal EVs or IRE1A EV gradient (n=3 each). Two-tailed Student’s t-test was used for statistical analyses.
Figure 5.
Figure 5.. IRE1A induces de novo ceramide biosynthesis.
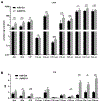
Sphingolipid content of A) Livers (n=8 each); B) EVs (n=3 each) from AdB-gal or AdIRE1A transduced mice. Two-tailed Student’s t-test was used for statistical analyses.
Figure 6.
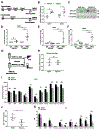
Figure 6.. IRE1A-stimulated EV release is mediated by the transcriptional activation of SPT.
A) Cartoon of putative XBP1 binding sites in the promoter of Sptlc1 and Sptlc2 genes by in silico analysis. B) Relative mRNA expression of Sptlc1and Sptlc2 (n=5 each) and C) Western blotting for SPTLC1 and SPTLC2 (n=3 each) in livers of AdIRE1A or AdB-gal transduced mice. ChIP assay demonstrating XBP1 promoter occupancy of D) Sptlc1, E) Sptlc2, and F) ERdj4 (n=5 each). G) Schematic for myriocin treatment of AdIRE1A-transduced mice. H) Relative mRNA expression of spliced Xbpl; I) Sphingolipid contents of livers; J) EV counts in plasma; K) Sphingolipid content of EVs (n=4 each) from myriocin-treated mice. Two-tailed Student’s t-test was used for statistical analyses.
Figure 7.
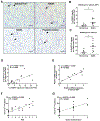
Figure 7.. Spliced XBP1 and SPTLC1 are increased in human NASH.
A) Representative images of RNAScope ISH using specific probes against spliced XBP1 (red dots, black arrow head) and SPTLC1 (green dots, black arrow) in human liver sections (normal and NASH); positive control is stained for POLR2A-C2 (red dots) and PPIB-C1 (green dots), scale bar=50 μm; B) quantification of spliced XBP1 signal and C) SPTLC1 signal in high power fields (n=7 in normal liver, n=10 in NASH). Graph showing collinearity between D) Spliced XBP1 signal and SPTLC1 signal by RNAscope (n=17); E) Relative mRNA expression of spliced XBP1 and SPTLC1 (n=13); F) EV count and NAFLD activity score (NAS) (n=27); G) EV count and grade of inflammation (n=27). Two-tailed Student’s t-test was used for statistical analyses. Pearson correlation analysis was performed in Microsoft excel.

References

    1. Calzadilla Bertot L, Adams LA. The Natural Course of Non-Alcoholic Fatty Liver Disease. Int J Mol Sci 2016;17. - PMC - PubMed
    1. Lassailly G, Caiazzo R, Buob D, et al. Bariatric Surgery Reduces Features of Nonalcoholic Steatohepatitis in Morbidly Obese Patients. Gastroenterology 2015;149:379–88; quiz e15-6. - PubMed
    1. Gehrke N, Schattenberg JM. Metabolic Inflammation-A Role for Hepatic Inflammatory Pathways as Drivers of Comorbidities in Nonalcoholic Fatty Liver Disease? Gastroenterology 2020. - PubMed
    1. Hirsova P, Ibrahim SH, Gores GJ, et al. Lipotoxic lethal and sublethal stress signaling in hepatocytes: relevance to NASH pathogenesis. J Lipid Res 2016;57:1758–1770. - PMC - PubMed
    1. Fun XH, Thibault G. Lipid bilayer stress and proteotoxic stress-induced unfolded protein response deploy divergent transcriptional and non-transcriptional programmes. Biochim Biophys Acta Mol Cell Biol Lipids 2019. - PubMed

Publication types

MeSH terms