

Spatial modeling, risk mapping, change detection, and outbreak trend analysis of coronavirus (COVID-19) in Iran (days between February 19 and June 14, 2020)
- PMID: 32574693
- PMCID: PMC7305907
- DOI: 10.1016/j.ijid.2020.06.058
Spatial modeling, risk mapping, change detection, and outbreak trend analysis of coronavirus (COVID-19) in Iran (days between February 19 and June 14, 2020)
Abstract
Objectives: Coronavirus disease 2019 (COVID-19) represents a major pandemic threat that has spread to more than 212 countries with more than 432,902 recorded deaths and 7,898,442 confirmed cases worldwide so far (on June 14, 2020). It is crucial to investigate the spatial drivers to prevent and control the epidemic of COVID-19.
Methods: This is the first comprehensive study of COVID-19 in Iran; and it carries out spatial modeling, risk mapping, change detection, and outbreak trend analysis of the disease spread. Four main steps were taken: comparison of Iranian coronavirus data with the global trends, prediction of mortality trends using regression modeling, spatial modeling, risk mapping, and change detection using the random forest (RF) machine learning technique (MLT), and validation of the modeled risk map.
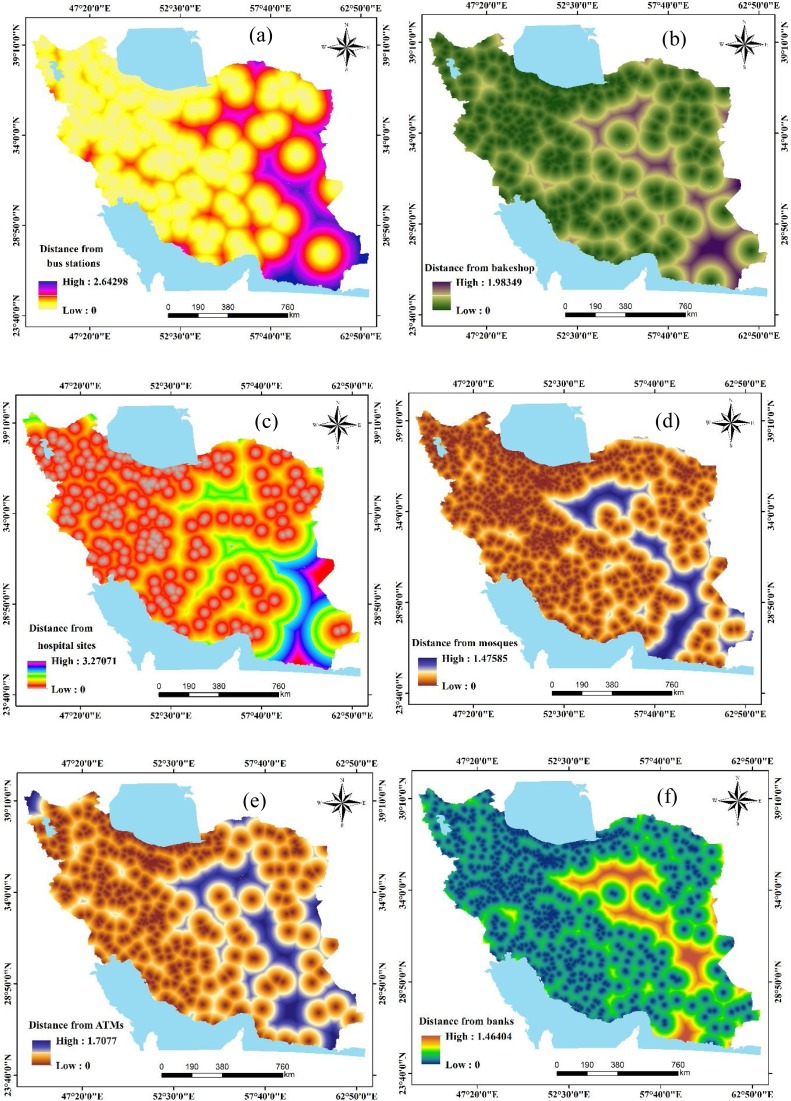
Results: The results show that from February 19 to June 14, 2020, the average growth rates (GR) of COVID-19 deaths and the total number of COVID-19 cases in Iran were 1.08 and 1.10, respectively. Based on the World Health Organisation (WHO) data, Iran's fatality rate (deaths/0.1M pop) is 10.53. Other countries' fatality rates were, for comparison, Belgium - 83.32, UK - 61.39, Spain - 58.04, Italy - 56.73, Sweden - 48.28, France - 45.04, USA - 35.52, Canada - 21.49, Brazil - 20.10, Peru - 19.70, Chile - 16.20, Mexico- 12.80, and Germany - 10.58. The fatality rate for China is 0.32 (deaths/0.1M pop). Over time, the heatmap of the infected areas identified two critical time intervals for the COVID-19 outbreak in Iran. The provinces were classified in terms of disease and death rates into a large primary group and three provinces that had critical outbreaks were separate from the others. The heatmap of countries of the world shows that China and Italy were distinguished from other countries in terms of nine viral infection-related parameters. The regression models for death cases showed an increasing trend but with some evidence of turning. A polynomial relationship was identified between the coronavirus infection rate and the province population density. Also, a third-degree polynomial regression model for deaths showed an increasing trend recently, indicating that subsequent measures taken to cope with the outbreak have been insufficient and ineffective. The general trend of deaths in Iran is similar to the world's, but Iran's shows lower volatility. Change detection of COVID-19 risk maps with a random forest model for the period from March 11 to March 18 showed an increasing trend of COVID-19 in Iran's provinces. It is worth noting that using the LASSO MLT to evaluate variables' importance, indicated that the most important variables were the distance from bus stations, bakeries, hospitals, mosques, ATMs (automated teller machines), banks, and the minimum temperature of the coldest month.
Conclusions: We believe that this study's risk maps are the primary, fundamental step to take for managing and controlling COVID-19 in Iran and its provinces.
Keywords: Heatmap; Iran; Outbreak trend; Regression model; Risk map; Spatial modeling.
Copyright © 2020 The Authors. Published by Elsevier Ltd.. All rights reserved.
Figures


References
-
- Aik J., Heywood A.E., Newall A.T., Ng L.C., Kirk M.D., Turner R. Climate variability and salmonellosis in Singapore – a time series analysis. Sci Total Environ. 2018;639:1261–1267. - PubMed
-
- Alberts C.J., Boyd A., Bruisten S.M., Heijman T., Hogewoning A., van Rooijen M. Hepatitis A incidence, seroprevalence, and vaccination decision among MSM in Amsterdam, the Netherlands. Vaccine. 2019;37:2849–2856. - PubMed
-
- Al-Quraishi T., Abawajy J.H., Chowdhury M.U., Rajasegarar S., Abdalrada A.S. Breast cancer recurrence prediction using random forest model. In: Ghazali R., Deris M., Nawi N., Abawajy J.H., editors. Recent advances on soft computing and data mining. SCDM 2018. Springer; Cham: 2018. p. 700. Advances in Intelligent Systems and Computing. - DOI
MeSH terms
LinkOut - more resources
Full Text Sources
