

GLI1 and AXIN2 Are Distinctive Markers of Human Calvarial Mesenchymal Stromal Cells in Nonsyndromic Craniosynostosis
- PMID: 32575385
- PMCID: PMC7352200
- DOI: 10.3390/ijms21124356
GLI1 and AXIN2 Are Distinctive Markers of Human Calvarial Mesenchymal Stromal Cells in Nonsyndromic Craniosynostosis
Abstract
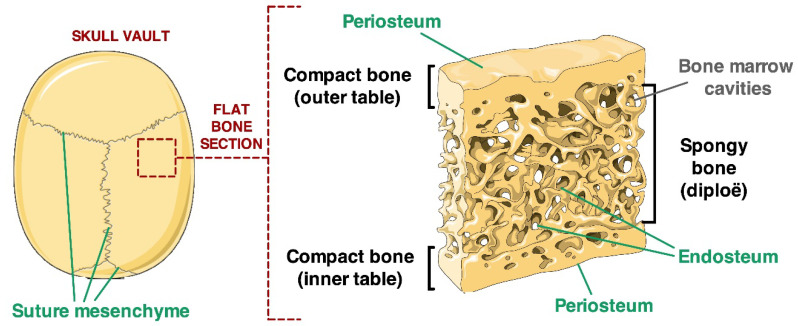
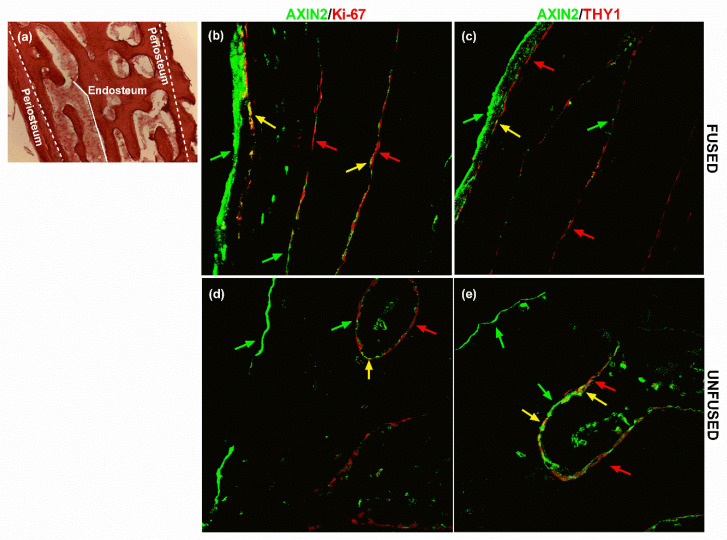
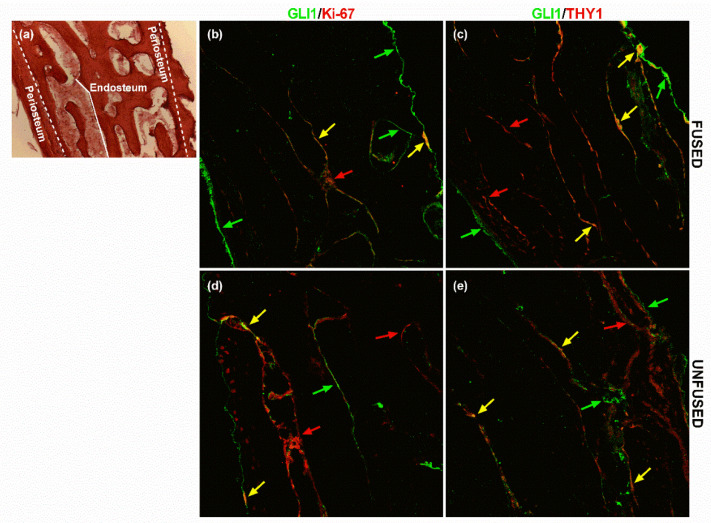
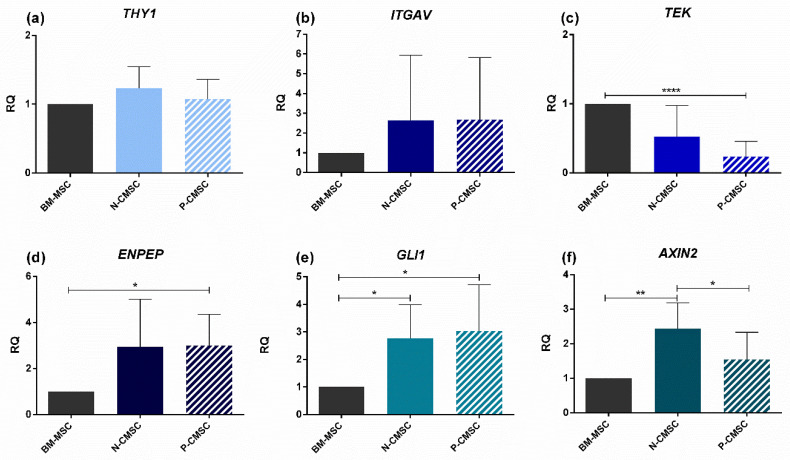
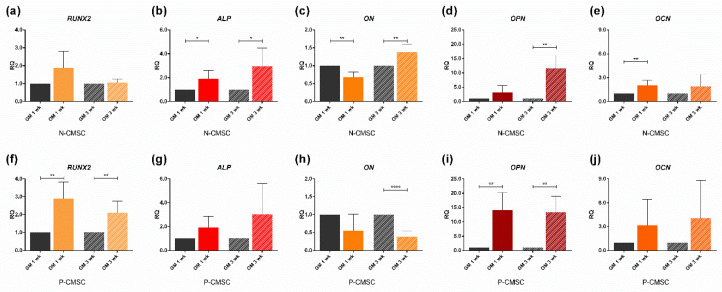
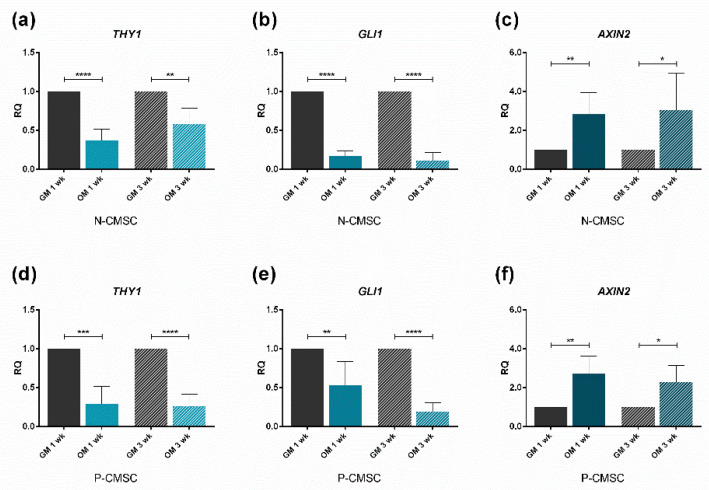
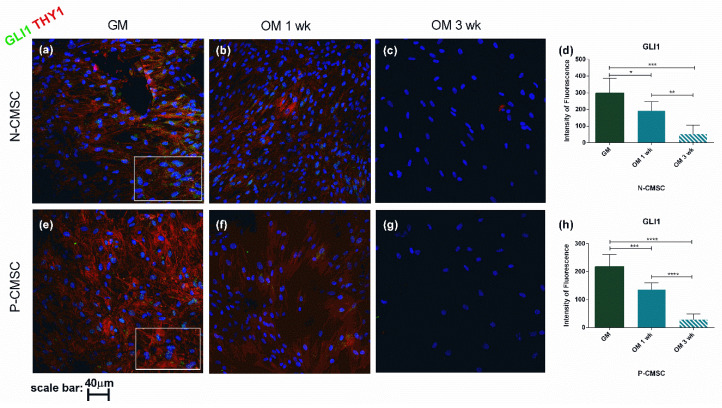
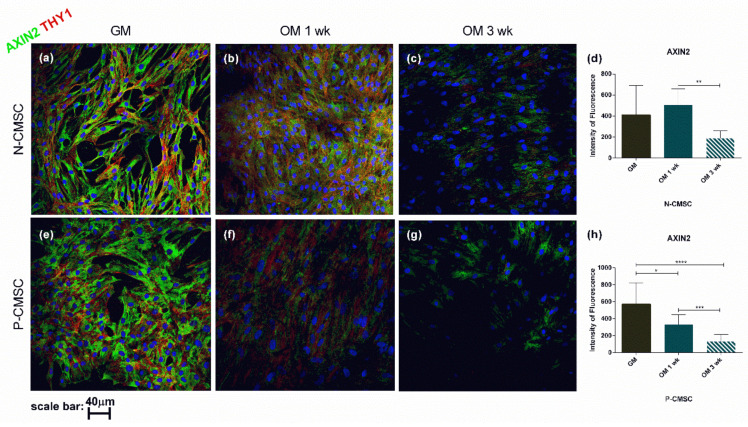
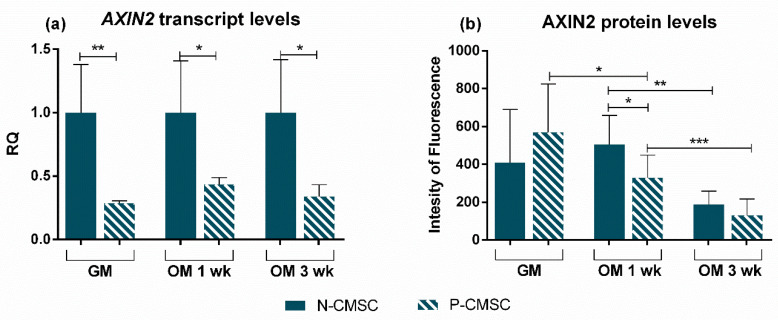
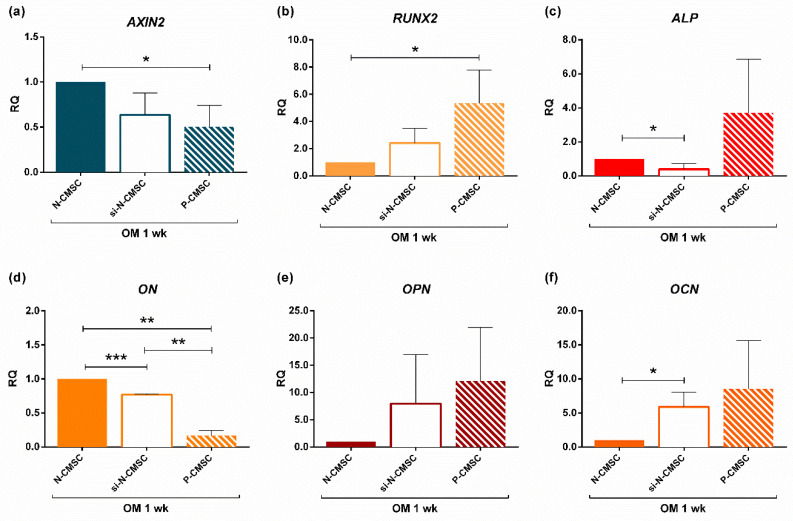
All skeletal bones house osteogenic stem cell niches, in which mesenchymal stromal cells (MSC) provide progenitors for tissue growth and regeneration. They have been widely studied in long bones formed through endochondral ossification. Limited information is available on the composition of the osteogenic niche in flat bones (i.e., skull vault bones) that develop through direct membranous ossification. Craniosynostosis (CS) is a congenital craniofacial defect due to the excessive and premature ossification of skull vault sutures. This study aimed at analysing the expression of GLI1, AXIN2 and THY1 in the context of the human skull vault, using nonsyndromic forms of CS (NCS) as a model to test their functional implication in the aberrant osteogenic process. The expression of selected markers was studied in NCS patients' calvarial bone specimens, to assess the in vivo location of cells, and in MSC isolated thereof. The marker expression profile was analysed during in vitro osteogenic differentiation to validate the functional implication. Our results show that GLI1 and AXIN2 are expressed in periosteal and endosteal locations within the osteogenic niche of human calvarial bones. Their expression is higher in MSC isolated from calvarial bones than in those isolated from long bones and tends to decrease upon osteogenic commitment and differentiation. In particular, AXIN2 expression was lower in cells isolated from prematurely fused sutures than in those derived from patent sutures of NCS patients. This suggests that AXIN2 could reasonably represent a marker for the stem cell population that undergoes depletion during the premature ossification process occurring in CS.
Keywords: AXIN2; GLI1; bone development; cranial suture; mesenchymal stromal cells; nonsyndromic craniosynostosis; osteogenesis; personalised medicine; regenerative medicine; stem cell niche.
Conflict of interest statement
The authors declare no conflict of interest.
Figures
Similar articles
-
Cranial Suture Mesenchymal Stem Cells: Insights and Advances.Biomolecules. 2021 Jul 31;11(8):1129. doi: 10.3390/biom11081129. Biomolecules. 2021. PMID: 34439795 Free PMC article. Review.
-
Increased FGF8 signaling promotes chondrogenic rather than osteogenic development in the embryonic skull.Dis Model Mech. 2018 Jun 15;11(6):dmm031526. doi: 10.1242/dmm.031526. Dis Model Mech. 2018. PMID: 29752281 Free PMC article.
-
BBS9 gene in nonsyndromic craniosynostosis: Role of the primary cilium in the aberrant ossification of the suture osteogenic niche.Bone. 2018 Jul;112:58-70. doi: 10.1016/j.bone.2018.04.013. Epub 2018 Apr 17. Bone. 2018. PMID: 29674126 Free PMC article.
-
The suture provides a niche for mesenchymal stem cells of craniofacial bones.Nat Cell Biol. 2015 Apr;17(4):386-96. doi: 10.1038/ncb3139. Epub 2015 Mar 23. Nat Cell Biol. 2015. PMID: 25799059 Free PMC article.
-
The Development of the Calvarial Bones and Sutures and the Pathophysiology of Craniosynostosis.Curr Top Dev Biol. 2015;115:131-56. doi: 10.1016/bs.ctdb.2015.07.004. Epub 2015 Oct 1. Curr Top Dev Biol. 2015. PMID: 26589924 Review.
Cited by
-
Distinct fibroblast progenitor subpopulation expedites regenerative mucosal healing by immunomodulation.J Exp Med. 2023 Mar 6;220(3):e20221350. doi: 10.1084/jem.20221350. Epub 2022 Dec 30. J Exp Med. 2023. PMID: 36584405 Free PMC article.
-
Crosstalk Between Wnt/β-Catenin and Hedgehog Supports Gli1+ Lineage Osteogenesis in Cranial Sutures.Int J Mol Sci. 2025 Apr 9;26(8):3508. doi: 10.3390/ijms26083508. Int J Mol Sci. 2025. PMID: 40332045 Free PMC article.
-
Basic and Preclinical Research for Personalized Medicine.J Pers Med. 2021 Apr 29;11(5):354. doi: 10.3390/jpm11050354. J Pers Med. 2021. PMID: 33946634 Free PMC article. Review.
-
GATA4-driven miR-206-3p signatures control orofacial bone development by regulating osteogenic and osteoclastic activity.Theranostics. 2021 Jul 25;11(17):8379-8395. doi: 10.7150/thno.58052. eCollection 2021. Theranostics. 2021. PMID: 34373748 Free PMC article.
-
Targeted allele-specific FGFR2 knockdown via human recombinant ferritin nanoparticles for personalized treatment of Crouzon syndrome.Mol Ther Nucleic Acids. 2024 Dec 12;36(1):102427. doi: 10.1016/j.omtn.2024.102427. eCollection 2025 Mar 11. Mol Ther Nucleic Acids. 2024. PMID: 39906733 Free PMC article.
References
-
- Wilk K., Yeh S.-C.A., Mortensen L.J., Ghaffarigarakani S., Lombardo C.M., Bassir S.H., Aldawood Z.A., Lin C.P., Intini G. Postnatal calvarial skeletal stem cells expressing PRX1 reside exclusively in the calvarial sutures and are required for bone regeneration. Stem Cell Rep. 2017;8:933–946. doi: 10.1016/j.stemcr.2017.03.002. - DOI - PMC - PubMed
MeSH terms
Substances
Grants and funding
LinkOut - more resources
Full Text Sources
Miscellaneous
