

Circulating miRNAs in Small Extracellular Vesicles Secreted by a Human Melanoma Xenograft in Mouse Brains
- PMID: 32575666
- PMCID: PMC7352810
- DOI: 10.3390/cancers12061635
Circulating miRNAs in Small Extracellular Vesicles Secreted by a Human Melanoma Xenograft in Mouse Brains
Abstract
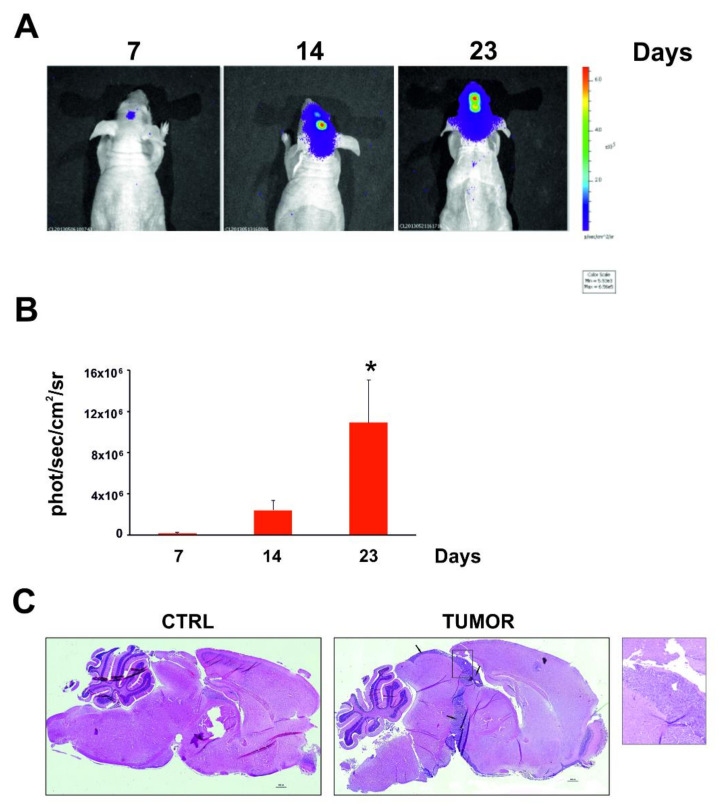
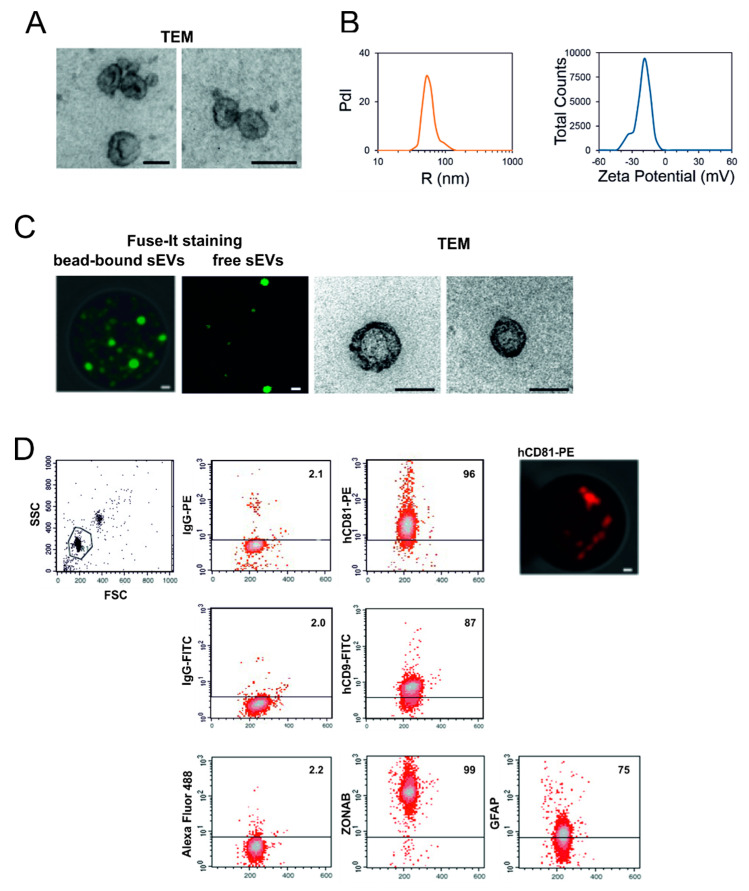
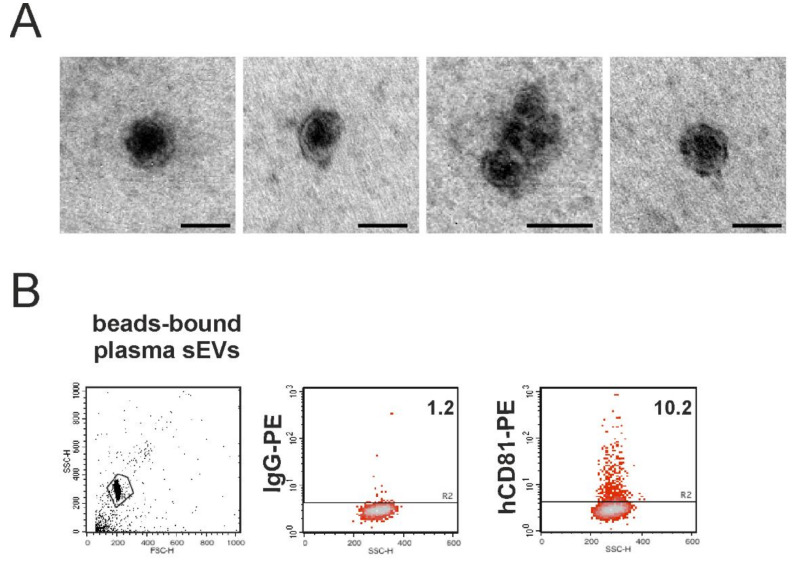
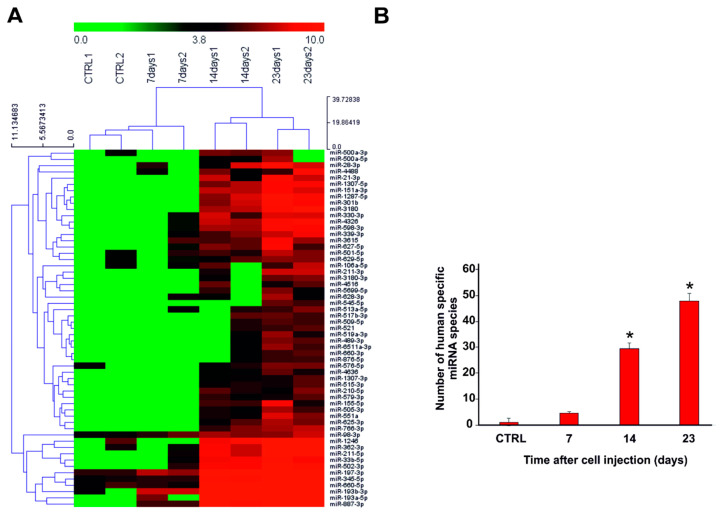
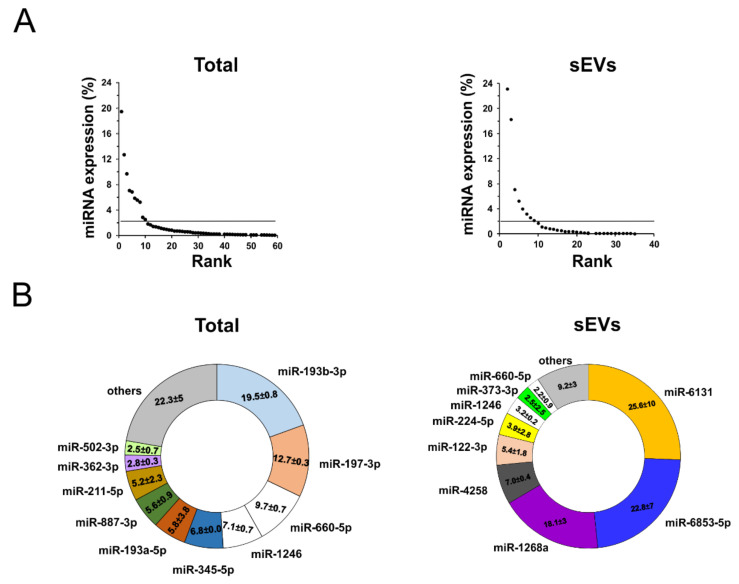
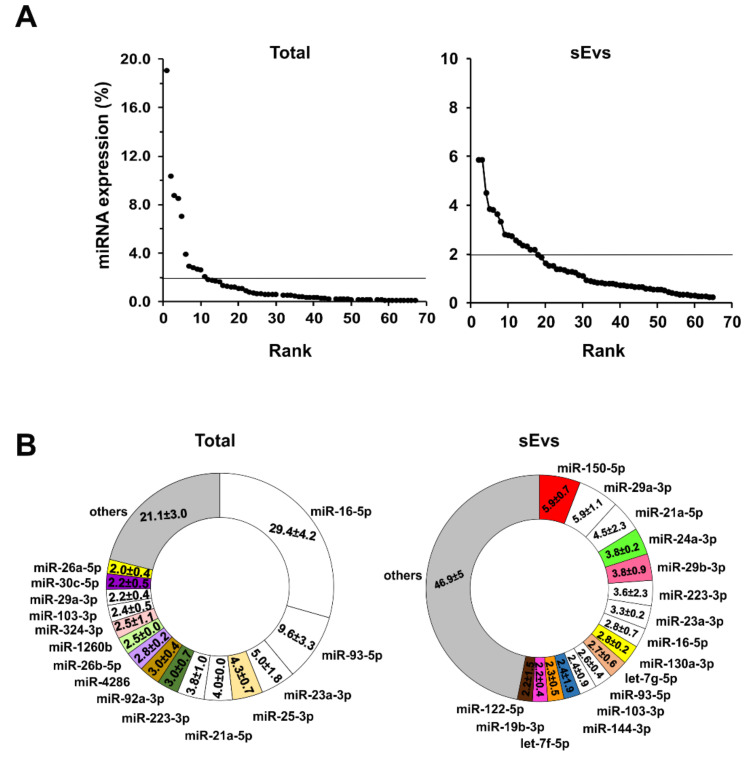
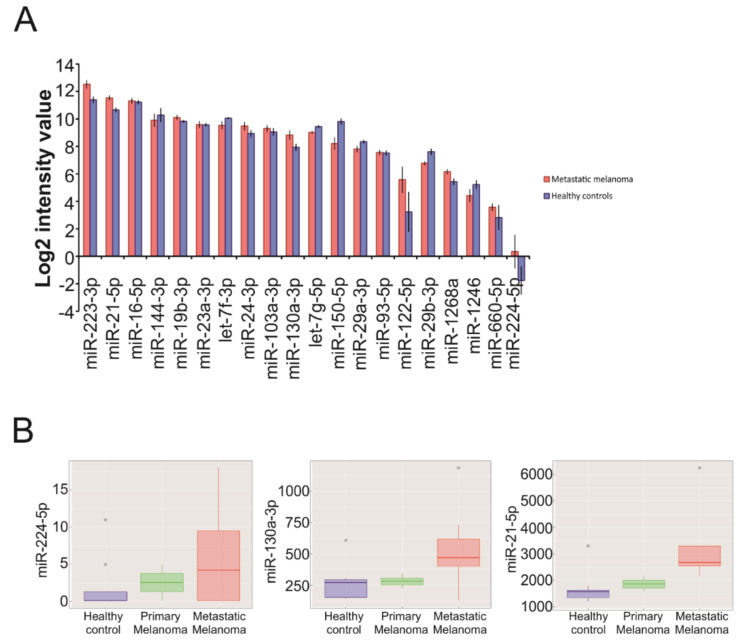
The identification of liquid biomarkers remains a major challenge to improve the diagnosis of melanoma patients with brain metastases. Circulating miRNAs packaged into tumor-secreted small extracellular vesicles (sEVs) contribute to tumor progression. To investigate the release of tumor-secreted miRNAs by brain metastasis, we developed a xenograft model where human metastatic melanoma cells were injected intracranially in nude mice. The comprehensive profiles of both free miRNAs and those packaged in sEVs secreted by the melanoma cells in the plasma demonstrated that most (80%) of the sEV-associated miRNAs were also present in serum EVs from a cohort of metastatic melanomas, included in a publicly available dataset. Remarkably, among them, we found three miRNAs (miR-224-5p, miR-130a-3p and miR-21-5p) in sEVs showing a trend of upregulation during melanoma progression. Our model is proven to be valuable for identifying miRNAs in EVs that are unequivocally secreted by melanoma cells in the brain and could be associated to disease progression.
Keywords: circulating miRNAs; melanoma; small extracellular vesicles.
Conflict of interest statement
The authors declare no conflict of interest.
Figures
Similar articles
-
Comprehensive Analyses of miRNAs Revealed miR-92b-3p, miR-182-5p and miR-183-5p as Potential Novel Biomarkers in Melanoma-Derived Extracellular Vesicles.Front Oncol. 2022 Jul 8;12:935816. doi: 10.3389/fonc.2022.935816. eCollection 2022. Front Oncol. 2022. PMID: 35898875 Free PMC article.
-
Liver injury changes the biological characters of serum small extracellular vesicles and reprograms hepatic macrophages in mice.World J Gastroenterol. 2021 Nov 21;27(43):7509-7529. doi: 10.3748/wjg.v27.i43.7509. World J Gastroenterol. 2021. PMID: 34887646 Free PMC article.
-
Acute Cerebral Ischemia Increases a Set of Brain-Specific miRNAs in Serum Small Extracellular Vesicles.Front Mol Neurosci. 2022 Apr 27;15:874903. doi: 10.3389/fnmol.2022.874903. eCollection 2022. Front Mol Neurosci. 2022. PMID: 35571371 Free PMC article.
-
Trash or Treasure: extracellular microRNAs and cell-to-cell communication.Front Genet. 2013 Sep 5;4:173. doi: 10.3389/fgene.2013.00173. Front Genet. 2013. PMID: 24046777 Free PMC article. Review.
-
Role of microRNA carried by small extracellular vesicles in urological tumors.Front Cell Dev Biol. 2023 Jun 2;11:1192937. doi: 10.3389/fcell.2023.1192937. eCollection 2023. Front Cell Dev Biol. 2023. PMID: 37333986 Free PMC article. Review.
Cited by
-
miRNome and Proteome Profiling of Small Extracellular Vesicles Secreted by Human Glioblastoma Cell Lines and Primary Cancer Stem Cells.Biomedicines. 2022 Aug 4;10(8):1886. doi: 10.3390/biomedicines10081886. Biomedicines. 2022. PMID: 36009432 Free PMC article.
-
Plant-derived extracellular nanovesicles: a promising biomedical approach for effective targeting of triple negative breast cancer cells.Front Bioeng Biotechnol. 2024 Jun 17;12:1390708. doi: 10.3389/fbioe.2024.1390708. eCollection 2024. Front Bioeng Biotechnol. 2024. PMID: 38952670 Free PMC article.
-
Modulating Effects of Cancer-Derived Exosomal miRNAs and Exosomal Processing by Natural Products.Cancers (Basel). 2023 Jan 3;15(1):318. doi: 10.3390/cancers15010318. Cancers (Basel). 2023. PMID: 36612314 Free PMC article. Review.
-
Opportunities Offered by Graphene Nanoparticles for MicroRNAs Delivery for Amyotrophic Lateral Sclerosis Treatment.Materials (Basel). 2021 Dec 24;15(1):126. doi: 10.3390/ma15010126. Materials (Basel). 2021. PMID: 35009270 Free PMC article. Review.
-
Distinct mRNAs in Cancer Extracellular Vesicles Activate Angiogenesis and Alter Transcriptome of Vascular Endothelial Cells.Cancers (Basel). 2021 Apr 22;13(9):2009. doi: 10.3390/cancers13092009. Cancers (Basel). 2021. PMID: 33921957 Free PMC article.
References
-
- Disibio G., French S.W. Metastatic patterns of cancers: Results from a large autopsy study. Arch. Pathol. Lab. Med. 2008;132:931–939. - PubMed
-
- Venur V.A., Funchain P., Kotecha R., Chao S.T., Ahluwalia M.S. Changing Treatment Paradigms for Brain Metastases from Melanoma-Part 1: Diagnosis, Prognosis, Symptom Control, and Local Treatment. Oncology. 2017;31:602–606. - PubMed
Grants and funding
LinkOut - more resources
Full Text Sources
