. 2020 Jun 21;12(6):1643.
doi: 10.3390/cancers12061643.

Myoferlin Is a Yet Unknown Interactor of the Mitochondrial Dynamics' Machinery in Pancreas Cancer Cells

Affiliations

Myoferlin Is a Yet Unknown Interactor of the Mitochondrial Dynamics' Machinery in Pancreas Cancer Cells

Sandy Anania et al. Cancers (Basel). .

Abstract

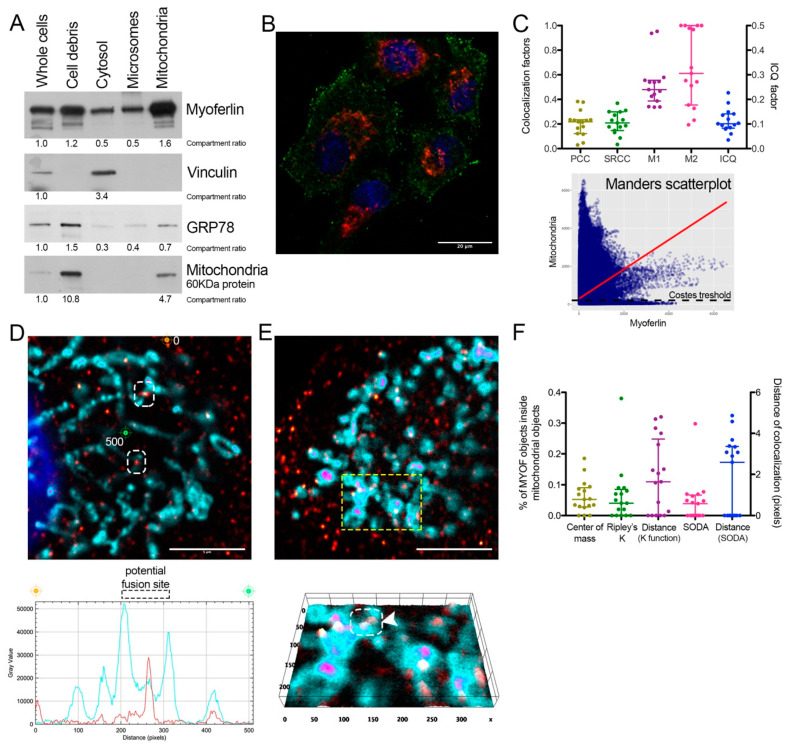
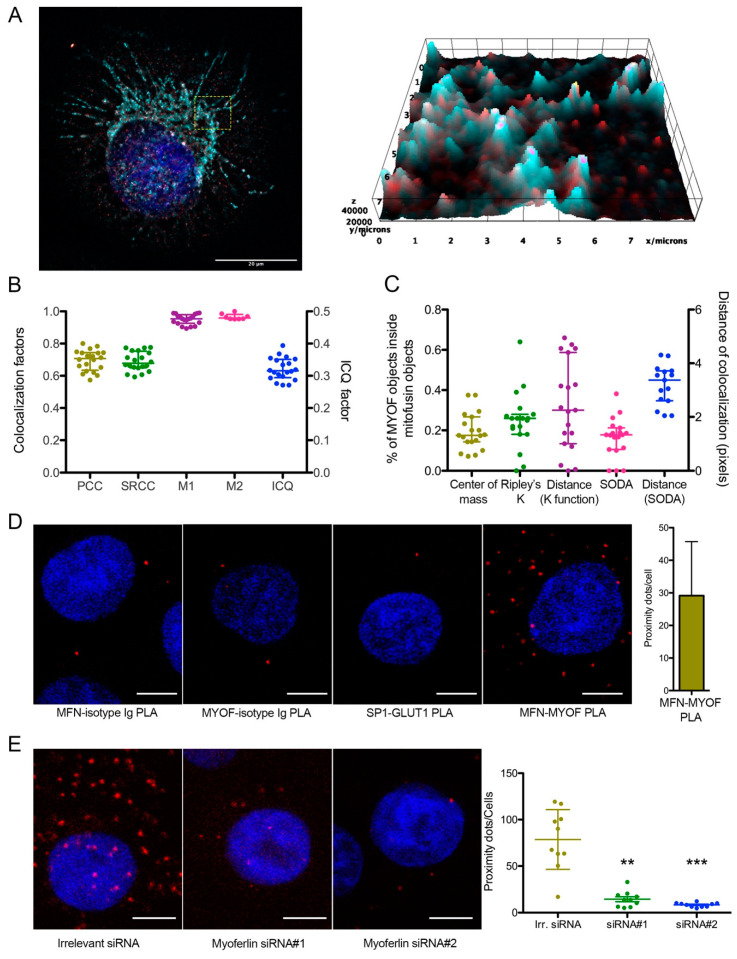
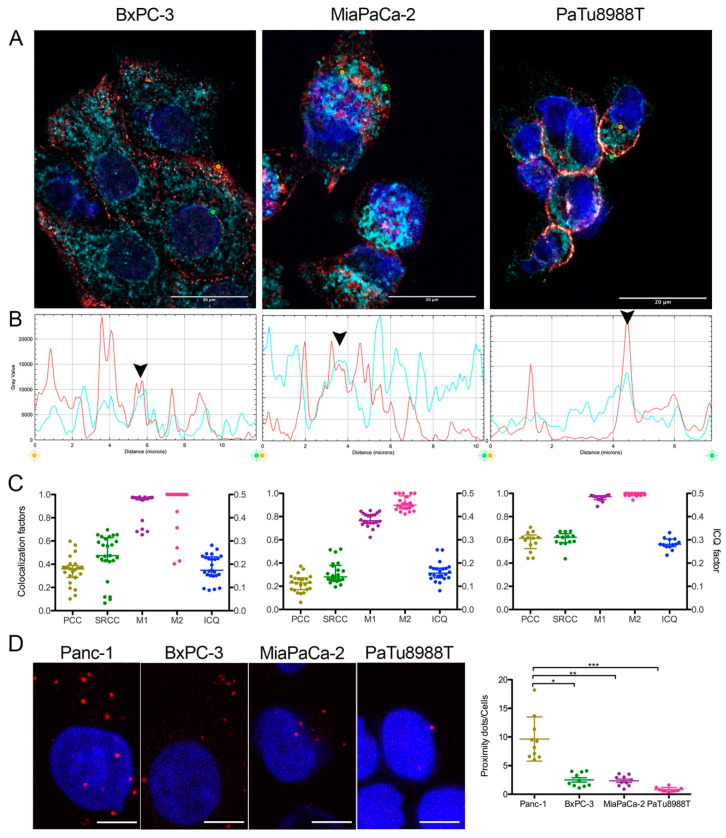
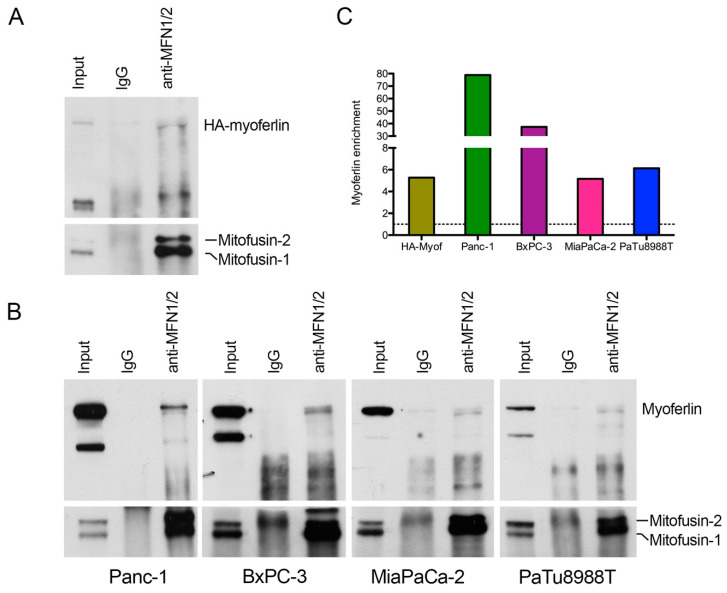
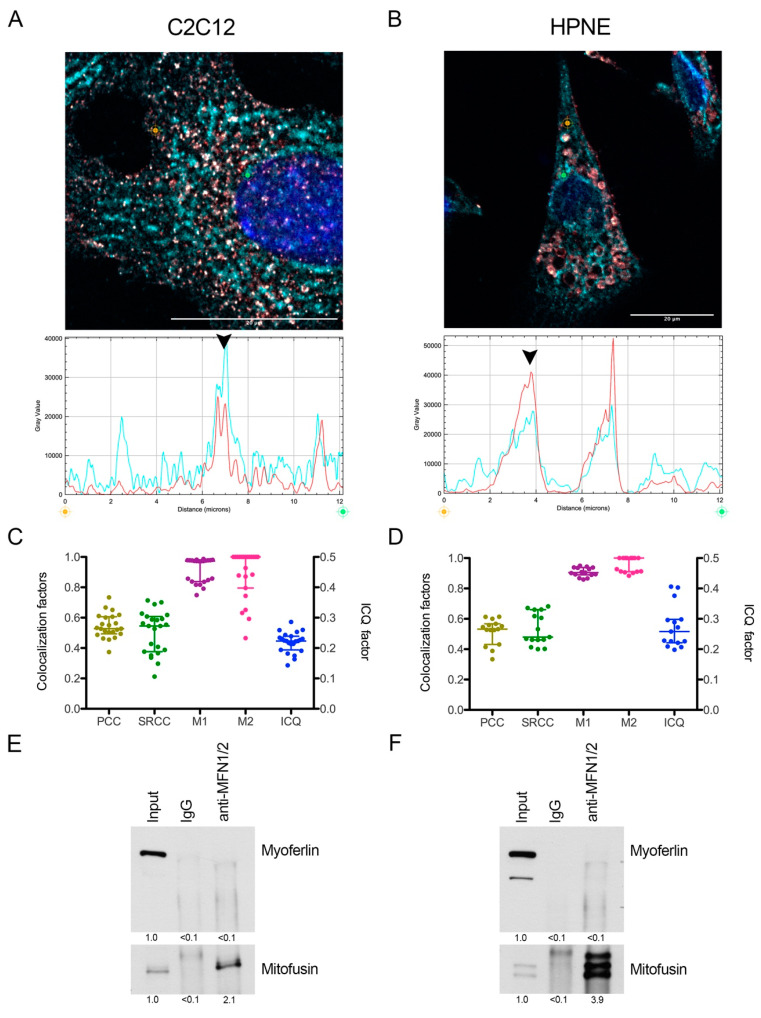
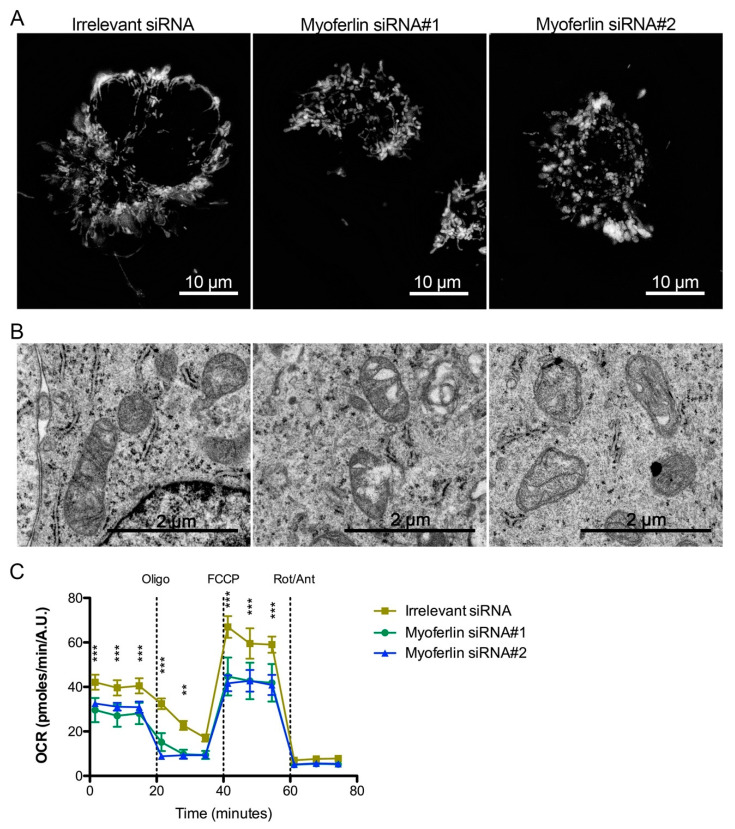
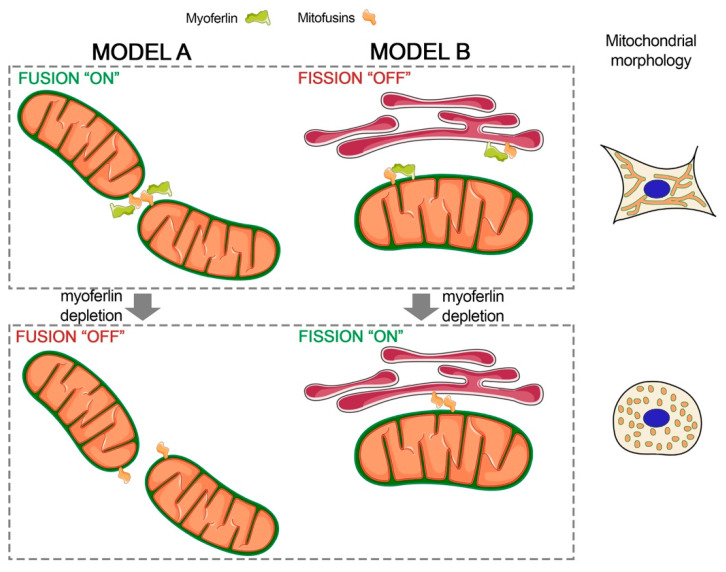
Pancreas ductal adenocarcinoma is one of the deadliest cancers where surgery remains the main survival factor. Mitochondria were described to be involved in tumor aggressiveness in several cancer types including pancreas cancer. We have previously reported that myoferlin controls mitochondrial structure and function, and demonstrated that myoferlin depletion disturbs the mitochondrial dynamics culminating in a mitochondrial fission. In order to unravel the mechanism underlying this observation, we explored the myoferlin localization in pancreatic cancer cells and showed a colocalization with the mitochondrial dynamic machinery element: mitofusin. This colocalization was confirmed in several pancreas cancer cell lines and in normal cell lines as well. Moreover, in pancreas cancer cell lines, it appeared that myoferlin interacted with mitofusin. These discoveries open-up new research avenues aiming at modulating mitofusin function in pancreas cancer.

Keywords: mitochondria; mitofusin; myoferlin; pancreas cancer.


Conflict of interest statement

The authors declare no conflict of interest. The funders had no role in the design of the study; in the collection, analyses, or interpretation of data; in the writing of the manuscript, or in the decision to publish the results.

Figures

Figure 1
Figure 1
Myoferlin was colocalized with mitochondria in Panc-1 cells. (A) Western blot of 6 µg protein samples from whole Panc-1 cells and several cellular compartments isolated from Panc-1 cells. Myoferlin, vinculin, GRP78, and a 60 kDa mitochondrial protein were detected on the same membrane. Compartment relative quantification was performed using ImageJ; (B) representative confocal image of nuclei (blue), myoferlin (K-16—green) and mitochondria (113-1—red) immunofluorescence. Scale bar = 20 µm; (C) Pearson (PCC), Spearman rank (SRCC) correlation coefficients, Manders’ colocalization coefficients (M1,M2), and intensity correlation quotient (ICQ) calculated on 17 independent microscopic fields. Manders scatterplot, associated with its linear regression (red line), shows the correlation between the intensity of each pixels in each channel. (D,E) Deconvoluted confocal image of nuclei (blue), myoferlin (K-16—“hot” red scale), mitochondria (113-1—“cold” cyan scale). Scale bar = 5 µm. Regions surrounded by white dashed boxes are putative mitochondrial fusion sites. (D) Channel intensity profile was established following the segment between orange (0-pixel position) and green (500-pixel position) cross marks; (E) The region surrounded by a yellow dashed box was used to generate the 2D intensity profile. Regions surrounded by white dashed box and marked by white arrow head is a putative mitochondrial fusion site; (F) percentage of myoferlin-positive objects (N = 4286) with the center of a mass overlapping mitochondrial object (N = 459), a percentage of myoferlin-positive object colocalizing mitochondrial object calculated by fitting of the Ripley’s K function or by statistical object distance analysis (SODA). Colocalization distances in pixels were measured in both cases. All experiments were performed as three independent biological replicates.
Figure 2
Figure 2
Myoferlin was colocalized with mitochondrial fusion machinery. (A) Representative deconvoluted confocal image of nuclei (blue), myoferlin (K16—“hot” red scale) and mitofusin-1 (H65—“cold” cyan scale) immunofluorescence. Scale bar = 20 µm. Region surrounded by yellow dashed box was used to generate the 2D intensity profile; (B) Pearson (PCC), Spearman rank (SRCC) correlation coefficients, Manders’ colocalization coefficients (M1,M2), and intensity correlation quotient (ICQ) were calculated on 20 independent microscopic fields randomly selected; (C) percentage of myoferlin-positive objects (N = 7128) with center of mass overlapping mitochondrial object (N = 369), percentage of myoferlin-positive object colocalizing mitochondrial object calculated by fitting of the Ripley’s K function or by statistical object distance analysis (SODA). Colocalization distances in pixels were measured in both cases; (D) representative images of proximity ligation assay (PLA) between myoferlin (HPA) and mitofusin-1/2 (3C9). Scale bar = 4 µm. Controls were established by substitution of antibodies by control isotypes or by using antibodies against non-interacting proteins (SP1 and GLUT1); (E) representative images of PLA in Panc-1 cells transfected with irrelevant or myoferlin-specific siRNA. Scale bar = 4 µm. MFN1/2-MYOF PLA (N = 10) were quantified using ImageJ. Kruskal–Wallis non-parametric test followed by Dunn’s pairwise comparison was performed, ** p < 0.01, *** p < 0.001. All experiments were performed as three independent biological replicates.
Figure 3
Figure 3
Myoferlin was colocalized with MFN1/2 in several pancreas cancer cell lines. (A) representative deconvoluted confocal image of nuclei (blue), myoferlin (HPA—“hot” red scale) and mitofusin-1/2 (3C9—“cold” cyan scale) immunofluorescence of BxPC-3, MiaPaCa-2 and PaTu8988T cell lines. Scale bar = 20 µm. (B) Channel intensity profiles were established following the segment between orange and green cross marks. Black arrow heads indicate colocalization spots. (C) Pearson (PCC), Spearman rank (SRCC) correlation coefficients, Manders’ colocalization coefficients (M1,M2), and intensity correlation quotient (ICQ) were calculated on >13 independent microscopic fields. (D) Representatives images of MFN1/2-MYOF proximity ligation assay (PLA). Scale bar = 4 µm. MFN1/2-MYOF PLA (N = 10) were quantified using ImageJ. Kruskal–Wallis non-parametric test followed by Dunn’s a pairwise comparison was performed, * p < 0.05, ** p < 0.01, *** p < 0.001. All experiments were performed as three independent biological replicates.
Figure 4
Figure 4
Myoferlin interacts with mitofusins in pancreas cancer cell lines. (A) coimmunoprecipitation of mitofusins and HA-tagged myoferlin with an anti-mitofusin antibody. Western blot of protein samples from whole cells (input), IgG control immunoprecipitation (IgG), and mitofusins immunoprecipitation (anti-MFN1/2) of HA-myoferlin transfected Panc-1 cells. HA-myoferlin and mitofusins were detected on the same membrane; (B) coimmunoprecipitation of mitofusins and endogenous myoferlin with an anti-mitofusin antibody. Western blot of protein samples from whole cells, IgG control immunoprecipitation, and mitofusins immunoprecipitation of Panc-1, BxPC-3, MiaPaCa-2, and PaTu8988T cell lines. Myoferlin and mitofusins were detected on the same membrane; (C) myoferlin (or HA-tagged myoferlin) enrichment in anti-MFN1/2 relatively to IgG. Quantification was performed using ImageJ. All experiments were performed as three independent biological replicates.
Figure 5
Figure 5
Myoferlin was colocalized with mitofusin-1 in normal cell lines. Representative deconvoluted confocal image of nuclei (blue), myoferlin (HPA—“hot” red scale) and mitofusin-1/2 (3C9—“cold” cyan scale) immunofluorescence of (A) C2C12 murine myoblast and (B) immortalized human pancreatic normal epithelial (HPNE) cell lines. Scale bar = 20 µm. Channel intensity profiles were established following the segment between orange and green cross marks. Black arrow heads indicate colocalization spots. (C,D) Pearson (PCC), Spearman rank (SRCC) correlation coefficients, Manders’ colocalization coefficients (M1,M2), and intensity correlation quotient (ICQ) were calculated on >15 independent microscopic fields; (E,F) coimmunoprecipitation of mitofusins and endogenous myoferlin with an anti-mitofusin antibody. Western blot of protein samples from whole cells (input), IgG control immunoprecipitation (IgG), and mitofusins immunoprecipitation (anti-MFN1/2) of C2C12 and HPNE cell lines. Myoferlin and mitofusins were detected on the same membrane. Quantification was performed using ImageJ. All experiments were performed as three independent biological replicates.
Figure 6
Figure 6
Mitochondrial impact of myoferlin deletion in pancreas cancer cells. (A) Mitochondria were stained with tetramethylrhodamine ethyl ester (1 nM TMRE) in Panc-1 living cells depleted for myoferlin. (B) Panc-1 cells depleted for myoferlin were fixed with glutaraldehyde and observed under transmission electron microscope. (C) Kinetic oxygen consumption rate (OCR) response of Panc-1 cells to oligomycin (oligo, 1 µM), FCCP (1.0 µM), rotenone, and antimycin A mix (Rot/Ant, 0.5 µM each). Each data point represents mean ± SD of technical replicates. All experiments were performed as three independent biological replicates. *** p < 0.001, ** p < 0.01.
Figure 7
Figure 7
Proposed models for myoferlin involvement in mitochondrial dynamics. Model A describes the functional interaction between mitofusins and myoferlin. Myoferlin interacts with mitofusin and participates, as a positive regulator, to mitochondrial fusion. Myoferlin depletion reduces efficiency or inhibits the mitofusin-mediated mitochondrial fusion. Model B depicts the mitofusin sequestration by myoferlin impairing the ER-mitochondria tethering and subsequent fission. Myoferlin silencing results in the stabilization of the ER-mitochondria tethering by mitofusin interaction allowing ER wrapping and DRP1 recruitment. Designed with Servier Medical Art (https://smart.servier.com) licensed under a Creative Commons Attribution 3.0 Unported License.

References

    1. Viale A., Pettazzoni P., Lyssiotis C.A., Ying H., Sánchez N., Marchesini M., Carugo A., Green T., Seth S., Giuliani V., et al. Oncogene ablation-resistant pancreatic cancer cells depend on mitochondrial function. Nature. 2014;514:628–632. doi: 10.1038/nature13611. - DOI - PMC - PubMed
    1. Rademaker G., Costanza B., Anania S., Agirman F., Maloujahmoum N., Valentin E.D., Goval J.J., Bellahcène A., Castronovo V., Peulen O.J. Myoferlin Contributes to the Metastatic Phenotype of Pancreatic Cancer Cells by Enhancing Their Migratory Capacity through the Control of Oxidative Phosphorylation. Cancers. 2019;11:853. doi: 10.3390/cancers11060853. - DOI - PMC - PubMed
    1. Yu M., Nguyen N.D., Huang Y., Lin D., Fujimoto T.N., Molkentine J.M., Deorukhkar A., Kang Y., Lucas F.A.S., Fernandes C.J., et al. Mitochondrial fusion exploits a therapeutic vulnerability of pancreatic cancer. JCI Insight. 2019;5 doi: 10.1172/jci.insight.126915. - DOI - PMC - PubMed
    1. Rademaker G., Hennequière V., Brohée L., Nokin M.-J., Lovinfosse P., Durieux F., Gofflot S., Bellier J., Costanza B., Herfs M., et al. Myoferlin controls mitochondrial structure and activity in pancreatic ductal adenocarcinoma, and affects tumor aggressiveness. Oncogene. 2018;66:1–15. doi: 10.1038/s41388-018-0287-z. - DOI - PMC - PubMed
    1. Anderson G.R., Wardell S.E., Cakir M., Yip C., Ahn Y., Ali M., Yllanes A.P., Chao C.A., McDonnell D.P., Wood K.C. Dysregulation of mitochondrial dynamics proteins are a targetable feature of human tumors. Nat. Commun. 2018;9:1677. doi: 10.1038/s41467-018-04033-x. - DOI - PMC - PubMed

LinkOut - more resources