. 2020 Jun 21;21(12):4415.
doi: 10.3390/ijms21124415.

A New Selective PPARγ Modulator Inhibits Triglycerides Accumulation during Murine Adipocytes' and Human Adipose-Derived Mesenchymal Stem Cells Differentiation

Affiliations

A New Selective PPARγ Modulator Inhibits Triglycerides Accumulation during Murine Adipocytes' and Human Adipose-Derived Mesenchymal Stem Cells Differentiation

Ghina Al Haj et al. Int J Mol Sci. .

Abstract

Understanding the molecular basis of adipogenesis is vital to identify new therapeutic targets to improve anti-obesity drugs. The adipogenic process could be a new target in the management of this disease. Our aim was to evaluate the effect of GMG-43AC, a selective peroxisome proliferator-activated receptor γ (PPARγ) modulator, during adipose differentiation of murine pre-adipocytes and human Adipose Derived Stem Cells (hADSCs). We differentiated 3T3-L1 cells and primary hADSCs in the presence of various doses of GMG-43AC and evaluated the differentiation efficiency measuring lipid accumulation, the expression of specific differentiation markers and the quantification of accumulated triglycerides. The treatment with GMG-43AC is not toxic as shown by cell viability assessments after the treatments. Our findings demonstrate the inhibition of lipid accumulation and the significant decrease in the expression of adipocyte-specific genes, such as PPARγ, FABP-4, and leptin. This effect was long lasting, as the removal of GMG-43AC from culture medium did not allow the restoration of adipogenic process. The above actions were confirmed in hADSCs exposed to adipogenic stimuli. Together, these results indicate that GMG-43AC efficiently inhibits adipocytes differentiation in murine and human cells, suggesting its possible function in the reversal of adipogenesis and modulation of lipolysis.

Keywords: PPAR γ modulator; adipocytes; adipogenesis; differentiation; lipogenesis.


Conflict of interest statement

G.G. serves as vice president of Giuliani SpA. B.M. is an employee of this company. No other relationships/conditions/circumstances present a potential conflict of interest.

Figures
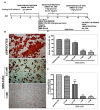
Figure 1
Figure 1
Effect of GMG-43AC on lipid accumulation in 3T3-L1 adipocytes. (A) Two-day post-confluent (day 0) 3T3-L1 preadipocytes were induced to differentiate in the presence of GMG-43AC of increasing concentrations for 10 days. The assays were performed on day 10. Intracellular lipids were stained with Oil Red O. (B) Oil Red O staining of adipocytes (top), cells treated with 0.5 mM (middle) and 1 mM GMG-43AC (bottom) at day 10. (C) Percentage of Oil Red O—positive cells in reference to total cell population. Reported values (mean ± SEM) are the result of 3 independent experiments and for each experiment at least 3 independent fields were considered for every condition (n = 9, ** p < 0.01, **** p < 0.0001 vs. adipocytes). (D) The level of accumulated triglycerides labelled with Oil Red O in 3T3-L1 derived adipocytes and cells treated with different GMG-43AC doses was spectrophotometrically determined at 500 nm at day 10. Each experimental condition was assayed in triplicate and the graph refers to the mean of 3 independent experiments (n = 9, *** p < 0.001, **** p < 0.0001 vs. adipocytes).
Figure 2
Figure 2
GMG-43AC does not induce apoptosis in 3T3-L1 cells. (A) Effect of GMG-43AC on the viability of 3T3-L1 cells was determined by Propidium Iodide Staining. Values are expressed as a percentage of propidium iodide positive cells (cell viability) after a 10 day incubation (n = 5). (B) Control (adipocytes) and GMG-43AC-treated cells were fixed and analyzed for DNA fragmentation by means of TUNEL(Terminal deoxynucleotidyl transferase dUTP Nick End Labeling) after 10 days of differentiation. Percentage of TUNEL-positive cells in reference to total cell population. Data are expressed as the mean ± SEM of two independent experiments, and for each experiment four fields were considered for each condition (n = 8).
Figure 3
Figure 3
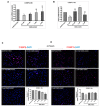
Effect of GMG-43AC on the expression of early adipogenesis transcription factors. Two-day post-confluent 3T3-L1 cells were induced to differentiate in the presence of different GMG-43AC doses and were lysed at the indicated times for subsequent analysis. (A) The mRNA expression levels of C/EBPβ. (B) C/EBPδ were evaluated 48 h after the induction of adipogenesis by means of Real Time PCR. Results were normalized to 18S rRNA and data are expressed as mean ± SEM (n = 4). (C) Immunofluorescence analysis of C/EBPβ and (D) C/EBPδ distribution and localization. Nuclei were stained with DAPI (blue). Reported values (mean ± SEM) are the result of three independent experiments, and for every experiment three fields were considered for each condition (n = 9, * p < 0.05, ** p < 0.01, *** p < 0.001, **** p < 0.0001 vs. adipocytes).
Figure 4
Figure 4
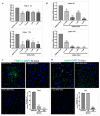
Effect of GMG-43AC on the expression of adipogenesis transcription factors. Adipocytes were induced to differentiate with different concentrations of GMG-43AC and harvested at indicated time during the differentiation period. (A) The mRNA expression of C/EBPα was analyzed by Real Time PCR. Results were normalized to 18S rRNA and data are expressed as mean ± SEM (n = 4, * p < 0.05, ** p < 0.01, *** p < 0.001, **** p < 0.0001 vs. adipocytes). (B) Western blotting analysis of β-Actin and C/EBPα involved in adipogenesis (C) Immunofluorescence analysis of C/EBPα distribution and localization. Nuclei were stained with DAPI (blue). Reported values (mean ± SEM) are the result of three independent experiments, and for every experiment two fields were considered for each condition (n = 6, *** p < 0.001 vs. adipocytes). (D) The mRNA expression of PPARγ was analyzed by Real Time PCR. Results were normalized to 18S rRNA and data are expressed as mean ± SEM (n = 4, * p < 0.05, **** p < 0.0001 vs. adipocytes). (E) Western blotting analysis of β-Actin and PPARγ in adipogenesis. (F) Immunofluorescence analysis of PPARγ distribution and localization. Nuclei were stained with DAPI (blue). Reported values (mean ± SEM) are the result of three independent experiments and for every experiment 2 fields were considered for each condition (n = 6, **** p < 0.0001 vs. adipocytes).
Figure 5
Figure 5
Effect of GMG-43AC on the expression and localization of adipocyte-specific markers. The mRNA expression of (A) FABP-4 and (B) leptin was analyzed by Real Time PCR. Results were normalized to 18S rRNA and data are expressed as the mean ± SEM. (n = 5, * p < 0.05, ** p < 0.01, *** p < 0.001, **** p < 0.0001 vs. adipocytes). Cells were fixed at day 10 of the differentiation process and stained with a specific antibody to investigate by immunofluorescence the distribution and localization of (C) FABP-4 and (D) leptin. Nuclei were stained with DAPI (blue). Reported values (mean ± SEM) are the result of three independent experiments, and for every experiment two fields were considered for each condition. (n = 6, **** p < 0.0001 vs. adipocytes).
Figure 6
Figure 6
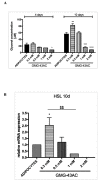
GMG-43AC stimulates lipolysis in 3T3-L1 adipocytes. (A) 3T3-L1 preadipocytes were treated with GMG-43AC for the indicated times and lipolysis was assessed by the amount of glycerol released into the media. Data are expressed as mean ± SEM (n = 3, * p < 0.05, ** p < 0.01, *** p < 0.001, **** p < 0.0001 vs. adipocytes). (B) Analysis of Hsl mRNA levels by real-time RT-PCR after 10 days of treatment with different dosages of GMG-43AC (n = 3, * p < 0.05, vs. ADIPOCYTES: $$ p < 0.01, vs. 0.3 mM GMG-43AC).
Figure 7
Figure 7
Reversion of adipogenesis process by GMG-43AC. (A) Cells were differentiated for 7 days and GMG-43AC was subsequently added to the culture medium and maintained for the following 7 days. (B) Oil Red O staining of control adipocytes and treated with three different concentrations of GMG-43AC (0.5 mM, 1 mM, 2 mM); (C) Percentage of positive cells in reference to total cells population. Reported values (mean ± SEM) are the result of two independent experiments and for each experiment 4 fields were considered for each condition (n = 8, *** p < 0.001 vs. ADIPOCYTES (15d)). (D) Levels of accumulated triglycerides (labeled with Oil Red O) in 3T3-L1 undifferentiated cells and adipocytes after 7 days reversion with GMG-43AC as evidence by quantitative absorbance at 500 nm wavelength. Each experimental condition was assayed in triplicate and the graph is referred to the means of two independent experiments. Values are reported as mean ± SEM (n = 8, ** p < 0.01, *** p < 0.001 vs. ADIPOCYTES 15d).
Figure 8
Figure 8
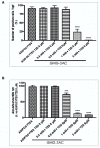
GMG-43AC inhibits adipocyte differentiation in 3T3-L1 cells in the long term. (A) 3T3-L1 preadipocytes were differentiated in presence of GMG-43AC (0.3–2 mM) for 10 days and then cells were incubated in the maintenance medium without GMG-43AC for the following 14 days for a total of 24 days. Levels of accumulated triglycerides were quantified by Oil Red O staining measuring the absorbance at 500 nm wavelength at Day 10 and 24. Data are expressed as mean ± SEM (n = 3, ** p < 0.01, *** p < 0.001, **** p < 0.0001 vs. adipocytes at day 10; $$ p < 0.01, $$$ p < 0.001, $$$$ p < 0.0001 vs. adipocytes at Day 24). (B) The 3T3-L1 cells were differentiated in the presence of GMG-43AC for 10 days and prolonged until 35 days. Levels of accumulated triglycerides were quantified by Oil Red O staining measuring the absorbance at 500 nm wavelength at Day 10 and 35. Each experimental condition was assayed in triplicate and the graph refers to the mean of three independent experiments. Data are expressed as mean ± SEM (n = 3, *** p < 0.001, **** p < 0.0001 vs. adipocytes at day 10; $ p < 0.05, $$ p < 0.01, $$$$ p < 0.0001 vs. adipocytes at Day 35).
Figure 9
Figure 9
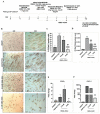
GMG-43AC inhibits lipids accumulation and promotes the loss of accumulated triglycerides in the differentiation induced by troglitazone. Two-day post confluent (day 0) 3T3-L1 preadipocytes were induced to differentiate with troglitazone (TZD) (10 μM) and insulin (10 μg/mL) in the presence of GMG-43AC of increasing concentrations for 10 days. Intracellular lipids were stained with Oil Red O. (A) Percentage of Oil Red O—positive cells in reference to total cell population. Reported values (mean ± SEM) are the result of three independent experiments and for each experiment at least 3 fields were considered for each condition (n = 9, **** p < 0.001 vs. adipocytes). (B) Quantification of accumulated triglycerides labelled with Oil Red O determined at 500 nm after Oil Red O staining. Each experimental condition was assayed in triplicate and the graphs are referred to the means of three independent experiments (n = 3, *** p < 0.001, **** p < 0.001 vs. adipocytes).
Figure 10
Figure 10
Oil Red O staining and expression of PPARγ and FABP-4 during human Adipose Derived Stem Cells (hADSCs) differentiation. (A) hADSCs differentiation in the presence of 0.5 mM and 2 mM GMG-43AC for 10 days; (B) Oil Red O staining of differentiated hADSCs and treated with GMG-43AC at Day 10. hADSCs were differentiated and treated with 0.5- and 2-mM GMG-43AC for 10 days; (C) Percentage of positive cells in reference to the total population; (D) Levels of accumulated triglycerides (labelled with Oil Red O) in hADSCs undifferentiated and differentiated treated with GMG-43AC as evidenced by quantitative absorbance 500 nm wavelength (n = 3). (E) PPARγ; (F) FABP-4; Reported values (mean ± SEM) are the result of 3 independent experiments, and for each experiment at least three independent fields were considered for every condition (* p < 0.05, ** p < 0.01, *** p < 0.001, **** p < 0.0001 vs. UNDIFF; $$$ p < 0.001, $$$$ p < 0.0001 vs. ADIPOCYTES; # p < 0.05, ## p < 0.01, ### p < 0.001, vs. experimental groups).
Figure 11
Figure 11
Oil Red O staining and expression of PPARγ and FABP-4 in hADSCs differentiated for 14 day; (A) hADSCs differentiation in the presence of 0.5 mM and 2 mM GMG-43AC for 14 days; (B) Oil Red O staining of differentiated hADSCs and treated with GMG-43AC at Day 14. hADSCs were differentiated for 7 days and then treated with 0.5 and 2 mM GMG-43AC for 7 days; (C) Percentage of positive cells in reference to the total population; (D) Levels of accumulated triglycerides (labelled with Oil Red O) in hADSCs undifferentiated and differentiated treated with GMG-43AC as evidenced by quantitative absorbance 500 nm wavelength; (n = 3). (E) PPARγ; (F) FABP-4; Reported values (mean ± SEM) are the result of three independent experiments, and for each experiment at least three independent fields were considered for every condition (* p < 0.05, ** p < 0.01, *** p < 0.001, **** p < 0.0001 vs. UNDIFF $ p < 0.05, $$ p < 0.01, $$$$ p < 0.0001 vs. ADIPOCYTES; ## p < 0.01 vs. experimental groups).
Figure 12
Figure 12
GMG-43AC halts cells proliferation in high concentration. Effect of GMG-43AC on cell proliferation of hADSCs was determined by MTT assay. Values are expressed as a percentage of the MTT absorbance of the control cells, which was set to 100%. Data are expressed as the mean ± SEM of three independent experiments (4 wells/experiment, n = 12; * p < 0.05 vs. UNDIFF).
Figure 13
Figure 13
Molecular structure of the GMG-43AC molecule, as reported in the Molbase database.

References

    1. Rosen E.D., MacDougald O.A. Adipocyte differentiation from the inside out. Nat. Rev. Mol. Cell Biol. 2006;7:885–896. doi: 10.1038/nrm2066. - DOI - PubMed
    1. Park Y.K., Lee J., Hong V.S., Choi J.S., Lee T.Y., Jang B.C. Identification of KMU-3, a novel derivative of gallic acid, as an inhibitor of adipogenesis. PLoS ONE. 2014;9:e109344. doi: 10.1371/journal.pone.0109344. - DOI - PMC - PubMed
    1. Park M.J., Song J.H., Shon M.S., Kim H.O., Kwon O.J., Roh S.S., Kim C.Y., Kim G.N. Anti-Adipogenic Effects of Ethanol Extracts Prepared from Selected Medicinal Herbs in 3T3-L1 Cells. Prev. Nutr. Food Sci. 2016;21:227–235. doi: 10.3746/pnf.2016.21.3.227. - DOI - PMC - PubMed
    1. Sarbatly R., Krishnaiah D., Nithyanandam R. A review of the antioxidant potential of medicinal plant species. Food Bioprod. Process. 2011;89:217–233.
    1. Lagouge M., Argmann C., Gerhart-Hines Z., Meziane H., Lerin C., Daussin F., Messadeq N., Milne J., Lambert P., Elliott P., et al. Resveratrol improves mitochondrial function and protects against metabolic disease by activating SIRT1 and PGC-1alpha. Cell. 2006;127:1109–1122. doi: 10.1016/j.cell.2006.11.013. - DOI - PubMed