

Whole-genome sequence association analysis of blood proteins in a longitudinal wellness cohort
- PMID: 32576278
- PMCID: PMC7310558
- DOI: 10.1186/s13073-020-00755-0
Whole-genome sequence association analysis of blood proteins in a longitudinal wellness cohort
Abstract
Background: The human plasma proteome is important for many biological processes and targets for diagnostics and therapy. It is therefore of great interest to understand the interplay of genetic and environmental factors to determine the specific protein levels in individuals and to gain a deeper insight of the importance of genetic architecture related to the individual variability of plasma levels of proteins during adult life.
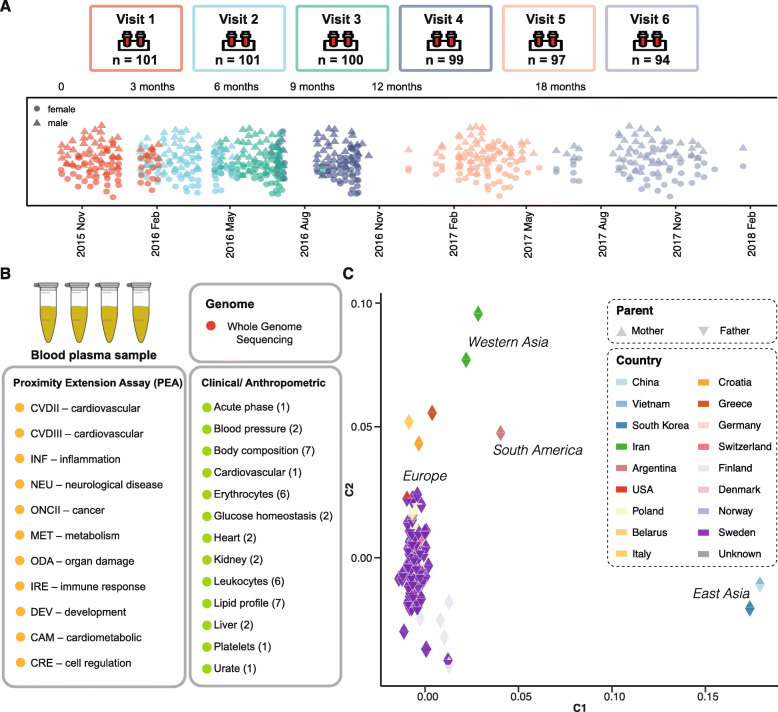
Methods: We have combined whole-genome sequencing, multiplex plasma protein profiling, and extensive clinical phenotyping in a longitudinal 2-year wellness study of 101 healthy individuals with repeated sampling. Analyses of genetic and non-genetic associations related to the variability of blood levels of proteins in these individuals were performed.
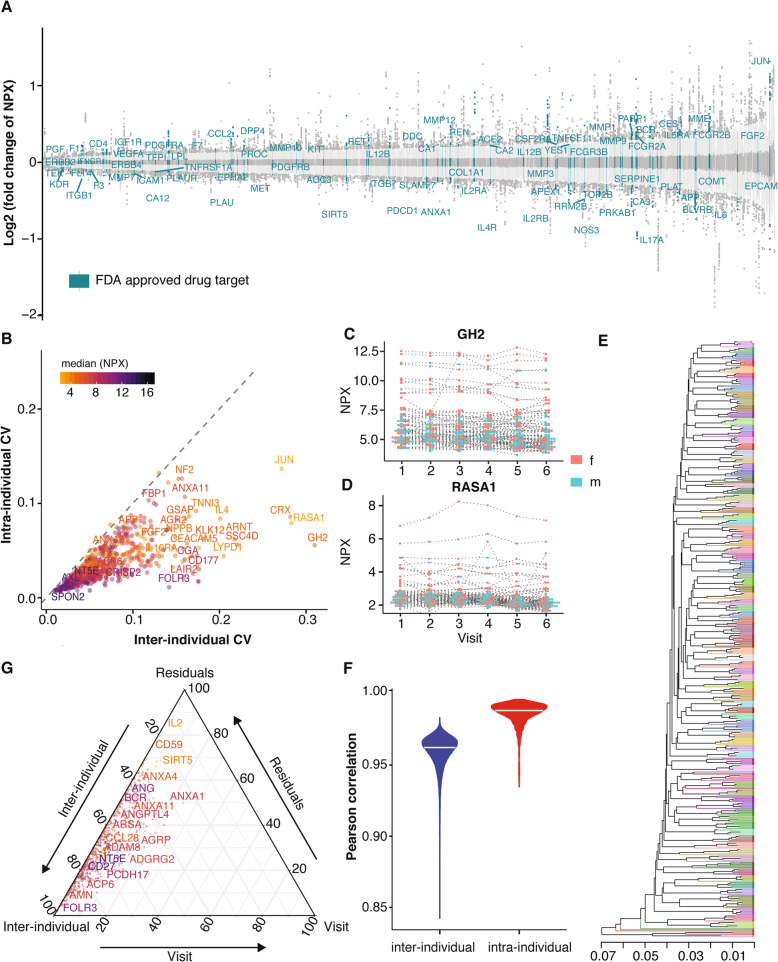
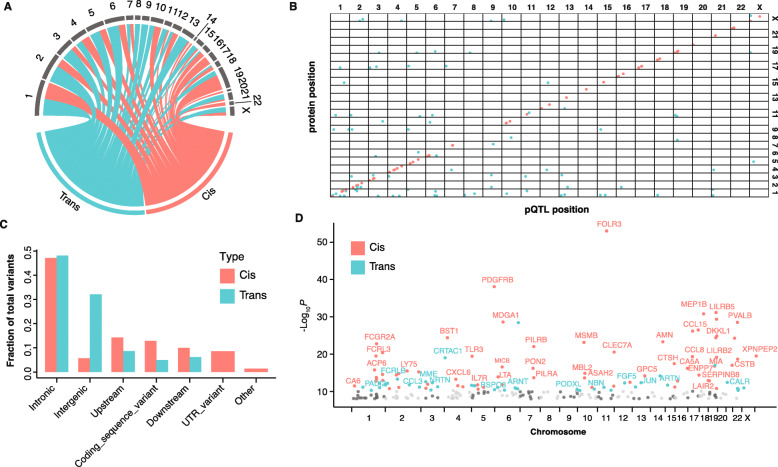
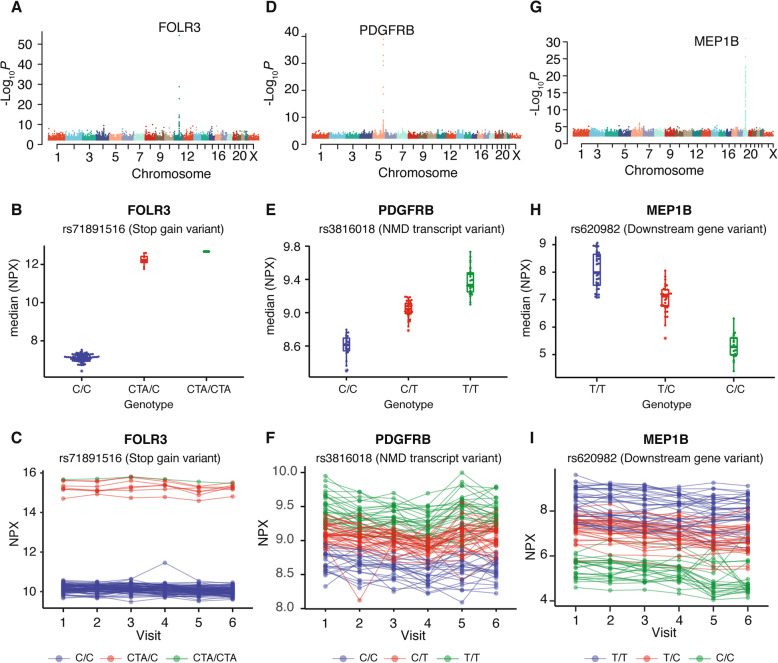
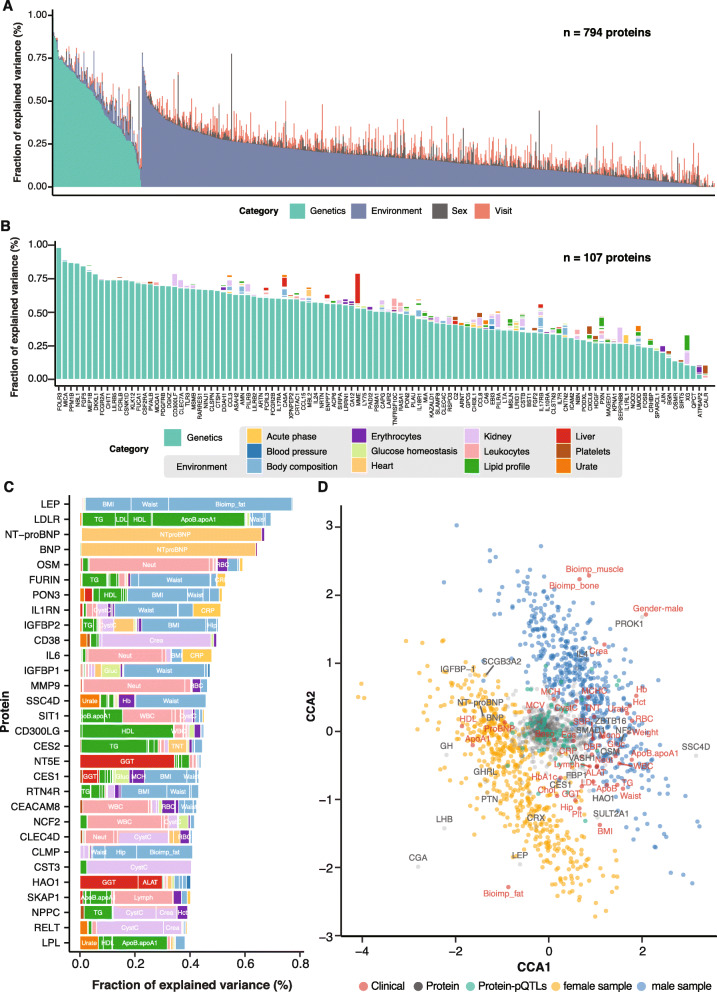
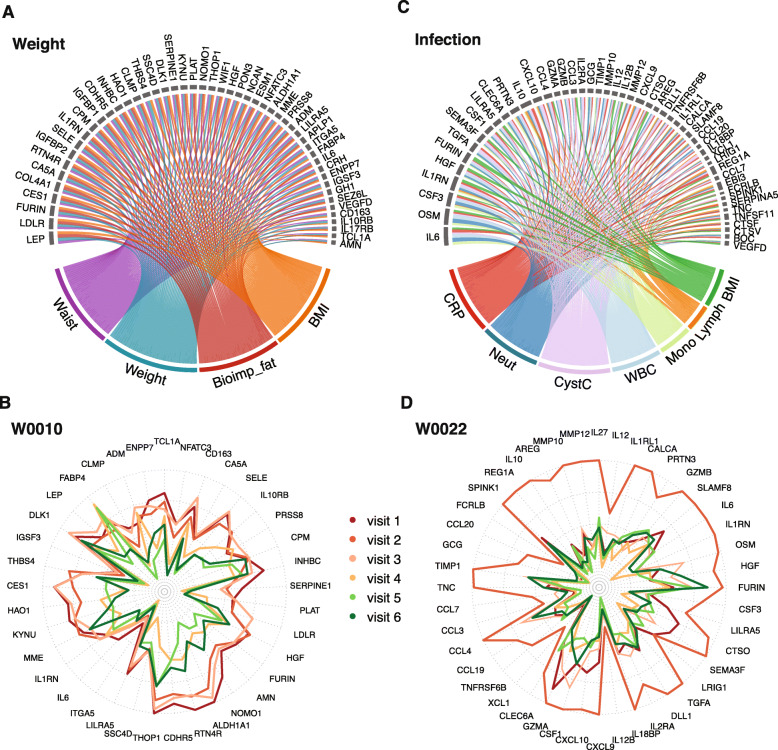
Results: The analyses showed that each individual has a unique protein profile, and we report on the intra-individual as well as inter-individual variation for 794 plasma proteins. A genome-wide association study (GWAS) using 7.3 million genetic variants identified by whole-genome sequencing revealed 144 independent variants across 107 proteins that showed strong association (P < 6 × 10-11) between genetics and the inter-individual variability on protein levels. Many proteins not reported before were identified (67 out of 107) with individual plasma level affected by genetics. Our longitudinal analysis further demonstrates that these levels are stable during the 2-year study period. The variability of protein profiles as a consequence of environmental factors was also analyzed with focus on the effects of weight loss and infections.
Conclusions: We show that the adult blood levels of many proteins are determined at birth by genetics, which is important for efforts aimed to understand the relationship between plasma proteome profiles and human biology and disease.
Keywords: Blood; Genetics; Genome-wide associations; Protein levels; Whole-genome sequence.
Conflict of interest statement
The authors declare that they have no competing interests.
Figures
Similar articles
-
Large-scale integration of the plasma proteome with genetics and disease.Nat Genet. 2021 Dec;53(12):1712-1721. doi: 10.1038/s41588-021-00978-w. Epub 2021 Dec 2. Nat Genet. 2021. PMID: 34857953
-
Contribution of rare whole-genome sequencing variants to plasma protein levels and the missing heritability.Nat Commun. 2022 May 9;13(1):2532. doi: 10.1038/s41467-022-30208-8. Nat Commun. 2022. PMID: 35534486 Free PMC article.
-
Whole Genome Sequence Analysis of the Plasma Proteome in Black Adults Provides Novel Insights Into Cardiovascular Disease.Circulation. 2022 Feb;145(5):357-370. doi: 10.1161/CIRCULATIONAHA.121.055117. Epub 2021 Nov 24. Circulation. 2022. PMID: 34814699 Free PMC article.
-
Genetics meets proteomics: perspectives for large population-based studies.Nat Rev Genet. 2021 Jan;22(1):19-37. doi: 10.1038/s41576-020-0268-2. Epub 2020 Aug 28. Nat Rev Genet. 2021. PMID: 32860016 Review.
-
Preconception genome medicine: current state and future perspectives to improve infertility diagnosis and reproductive and health outcomes based on individual genomic data.Hum Reprod Update. 2021 Feb 19;27(2):254-279. doi: 10.1093/humupd/dmaa044. Hum Reprod Update. 2021. PMID: 33197264 Review.
Cited by
-
Body fluid biomarkers and psychosis risk in The Accelerating Medicines Partnership® Schizophrenia Program: design considerations.Schizophrenia (Heidelb). 2025 May 21;11(1):78. doi: 10.1038/s41537-025-00610-4. Schizophrenia (Heidelb). 2025. PMID: 40399418 Free PMC article.
-
Genome-wide association study and genomic heritabilities for blood protein levels in Lori-Bakhtiari sheep.Sci Rep. 2021 Dec 9;11(1):23771. doi: 10.1038/s41598-021-03290-z. Sci Rep. 2021. PMID: 34887490 Free PMC article.
-
Integration of molecular profiles in a longitudinal wellness profiling cohort.Nat Commun. 2020 Sep 8;11(1):4487. doi: 10.1038/s41467-020-18148-7. Nat Commun. 2020. PMID: 32900998 Free PMC article.
-
Identifying proteomic risk factors for cancer using prospective and exome analyses of 1463 circulating proteins and risk of 19 cancers in the UK Biobank.Nat Commun. 2024 May 15;15(1):4010. doi: 10.1038/s41467-024-48017-6. Nat Commun. 2024. PMID: 38750076 Free PMC article.
-
Cancer diagnostics based on plasma protein biomarkers: hard times but great expectations.Mol Oncol. 2021 Jun;15(6):1715-1726. doi: 10.1002/1878-0261.12809. Epub 2020 Nov 17. Mol Oncol. 2021. PMID: 33012111 Free PMC article. Review.
References
-
- Solomon T, Lapek JD, Jr, Jensen SB, Greenwald WW, Hindberg K, Matsui H, et al. Identification of common and rare genetic variation associated with plasma protein levels using whole-exome sequencing and mass spectrometry. Circ Genom Precis Med. 2018;11(12):e002170. doi: 10.1161/CIRCGEN.118.002170. - DOI - PMC - PubMed
Publication types
MeSH terms
Substances
LinkOut - more resources
Full Text Sources
