

Relationships Between Initial COVID-19 Risk Perceptions and Protective Health Behaviors: A National Survey
- PMID: 32576418
- PMCID: PMC7242956
- DOI: 10.1016/j.amepre.2020.05.001
Relationships Between Initial COVID-19 Risk Perceptions and Protective Health Behaviors: A National Survey
Abstract
Introduction: Perceptions of health risks inform decisions about protective behaviors, but COVID-19 was an unfamiliar risk as it began to spread across the U.S. In the initial stage of the epidemic, authors examined perceived risks for COVID-19 infection and infection fatality and whether these risk perceptions were associated with protective behaviors. They also examined whether findings differed between later versus earlier responders.
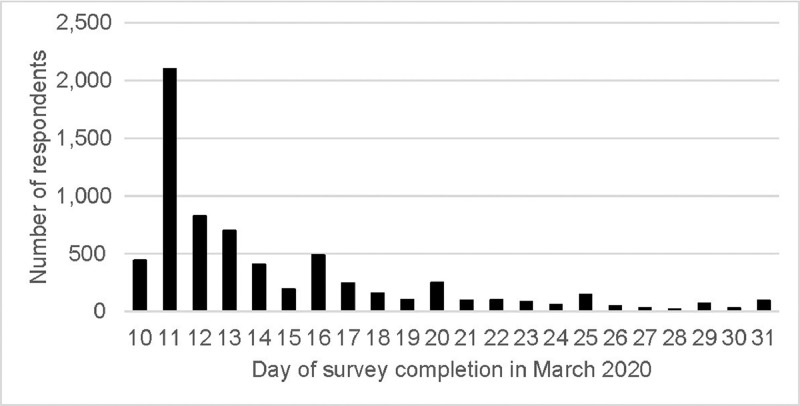
Methods: Between March 10 and March 31, 2020, a cross-sectional online survey was conducted with a nationally representative U.S. sample (n=6,684). Half responded before March 13, 2020 (versus later). Participants assessed their risks of COVID-19 infection and infection fatality (0%-100%) which were transformed into quartiles (1-4). They reported their implementation of protective behaviors like handwashing and social distancing (yes/no). Analyses were conducted in April‒May 2020.
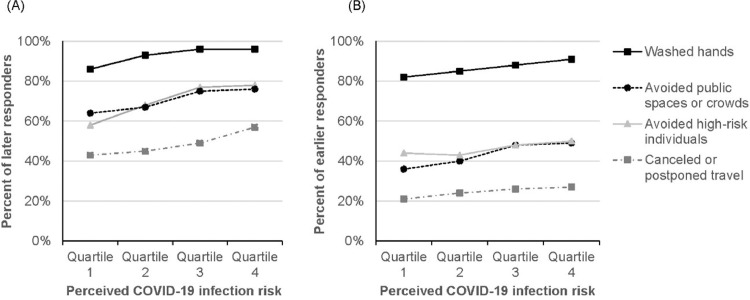
Results: Median perceived risk was 10.00% for COVID-19 infection and 5.00% for infection fatality, but respondents showed large disagreement. An increase of 1 quartile in perceived infection risk was associated with being 1.45 times (95% CI=1.33, 1.58) more likely to report handwashing, with perceived infection fatality risk showing no significant association. When predicting social distancing behaviors such as avoiding crowds, both quartile-based risk perceptions were significant (OR=1.24, 95% CI=1.17, 1.30 for infection and OR=1.19, 95% CI=1.13, 1.26 for infection fatality). Perceived COVID-19 infection risk, protective behaviors, and their relationship increased among later (versus earlier) responders.
Conclusions: Despite disagreements about the risks, people perceiving greater risks were more likely to implement protective behaviors-especially later (versus earlier) in March 2020. These findings have implications for risk communication.
Copyright © 2020 American Journal of Preventive Medicine. Published by Elsevier Inc. All rights reserved.
Figures


References
-
- Park M, Thwaites RS, Openshaw PJM. COVID-19: lessons from SARS and MERS. Eur J Immunol. 2020;50(3):308–311. doi: 10.1002/eji.202070035. - DOI
-
- What you can do. Centers for Disease Control and Prevention. www.cdc.gov/coronavirus/2019-ncov/need-extra-precautions/get-ready.html. Updated May 8, 2020. Accessed June 3, 2020.
-
- Fischhoff B. Risk perception and communication. In: Fischhoff B, ed. Risk Analysis and Human Behavior. London, UK: Routledge; 2012:3–32. 10.4324/9780203140710. - DOI
Publication types
MeSH terms
LinkOut - more resources
Full Text Sources
Miscellaneous
